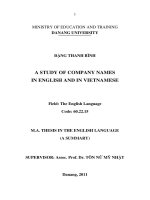
A STUDY OF VOLTAGE DISTURBANCES IN DISTRIBUTION NETWORK
Bạn đang xem bản rút gọn của tài liệu. Xem và tải ngay bản đầy đủ của tài liệu tại đây (1.76 MB, 28 trang )
MINISTRY OF EDUCATION AND TRAINING
THE UNIVERSITY OF DANANG
NGO MINH KHOA
A STUDY OF VOLTAGE DISTURBANCES
IN DISTRIBUTION NETWORK
SPECIALIZATION: ELECTRICAL ENGINEERING
CODE: 62.52.02.02
DISSERTATION IN BRIEF
Danang – 2016
This dissertation has been finished at: Danang University of
Technology, The university of Danang
Supervisor 1: Assoc, Prof. PhD. Dinh Thanh Viet
Supervisor 2: PhD. Nguyen Huu Hieu
Examiner 1: GS.VS.TSKH. Trần Đình Long
Examiner 2: PGS.TS. Võ Ngọc Điều
Examiner 3: TS. Lê Hữu Hùng
The dissertation will be defended at the Thesis Assessment
Committee at Da Nang University Level at Room No:
............................................................................................
.............................................................................................
............................................................................................
At date
month
2016
The dissertation is available at:
1. The National Library.
2. The Information Resources Center, The university of Danang.
1
INTRODUCTION
1. The reason for choosing the dissertation
Nowadays, electrical equipment in modern industry uses more
and more electronic devices, controllers (such as motor speed drive
controllers,
programmable
logic
controllers,
etc.)
with
the
involvement of the distributed generation using renewable energy
sources (wind, solar, etc.) in distribution networks. These devices
require high voltage quality in order to ensure their normal operation
conditions.
2. The purposes of the research
- The dissertation researches about signal processing methods
used in voltage disturbance analysis problems. Then a new method
based on discrete wavelet transform (DWT) and linear adaptive
neural network (ADALINE) is proposed in order to determine and
classify accurately voltage disturbances which appear at a
monitoring position in distribution network.
- The dissertation researches characteristics, effects, solutions
and standards of voltage sag. Then the authors proposes a research
method of voltage sag effects to sensitive loads in distribution
network based on modeling and simulating by using Matlab/Simulink
software.
- Application of the proposed method in chapter 2 to determine
voltage sag indices according to the IEEE Std. 1564-2014 standard
and evaluate voltage quality for sensitive loads in Vietnam’s
distribution networds.
- Application of voltage sag mitigation methods by using
mitigation equipments at connection point between sensitive loads
and distribution network.
2
3. Research methods
To build up the system to monitor, classify and mitigate
voltage disturbances especially voltage sag/swell, the research
method of the dissertation will study problems below:
+ The background of signal processing methods in modern
signal processing applied in power system are researched in this
dissertation.
+ Highlights of characteristic identification methods of signals
follow artificial intelligent are studying and then the efficiency of
voltage disturbance classification system is improved.
+ Data in this work is gathered by simulating transient
process in power system by Matlab/Simulink software, real data is
also gathered to evaluate the proposed methods.
4. The object and scope of research
The research object: The dissertation researches on voltage
disturbances in distribution networks including types of short-term
voltage variations (voltage sag, voltage swell, voltage interruption)
and long-term voltage variations which impact on voltage quality in
distribution network.
The research scope: The dissertation researches voltage
disturbance classification methods aforementioned, and studies
effects and determinating indices of voltage sag in order to improve
voltage quality for sensitive loads in distribution networks. In
addition, this dissertation also studies voltage sag mitigation
solutions in distribution networks.
5. The meaning of science and practice of the dissertation
The meaning of science: With the previous content, the
dissertation results will have the meaning of sience as following:
3
- A voltage disturbances classification method meets
requirements on monitoring voltage quality in distribution network.
The system can handle a large volume of input data collected from
the monitoring locations on the grid.
- It shows that the necessery of voltage disturbances
classification especially in the context of increasing the power
electronic devices as well as distributed generation involved in
distribution network.
- Discrete wavelet transform (DWT) method is a effective tool
in signal processing, its detail and approximation coefficients are the
typical characteristics of voltage disturbances.
- ADALINE shows ability for voltage amplitude identification
comparing with traditional methods. ADALINE can also determine
both the amplitude and phase angle of different frequency
components of voltage disturbance signals.
The meaning of practice: The research problems in the
dissertation will have the meaning of practice as following:
- Classification is an essential task in the management and
operation of the power grid to deliver the best performance.
- With the huge data of real waveforms recorded by power
quality monitoring equipment which are located at difference points
in distribution networks, and the considering period can be long
(weeks, months, years). Therefore, we need a classification system to
classify that data.
- The classification results will help the selection, design and
installation of suitable equipment to prevent the consequences which
voltage disturbances can cause impact on the electrical equipment
customers and the electricity unit.
4
CHAPTER 1. VOLTAGE DISTURBANCE CLASSIFICATION
OVERVIEW IN DISTRIBUTION NETWORK
1.1. Introduction
Voltage quality monitoring is a process of gathering, analyzing
and describing the real data into useful information. Data collection
process is usually done by continuously measuring the voltage as
shown in Figure 1.1. Normally the process of analysis and evaluation
is done in the traditional way, but with the recent advantages in the
fields of signal processing and artificial intelligence has opened up
many opportunities to be able to design and application intelligent
systems use to automatically analyze and evaluate real data with
human intervention [17]. The main goal of the data collection is to
identify and control the disturbances. This can be done by detecting,
analyzing and defining characteristic of different NLDA.
Variations
3
Average
1
2
Preprocessing
Measurement
Saving data
Các sự kiện
Triggering
Calculating
indicies
Saving data
Statistics and
publishing
Figure 1.1. Voltage quality measurment and monitoring diagram.
F
0
x
x
(x)
x
x
x
0
0
x
x
0
0
0
0
0
Input space
Y
(x)
(x) (0)
(x)
(0)
(x)
(x)
(0)
(0)
(x)
(0)
(0)
(0) (0)
Feature space
C1
C2
Decision space
Figure 1.2. The meaning of extracting characteristic input signal.
5
1.2. Voltage disturbance classification methods
There are many different methods to determine the
characteristics and to classify voltage disturbances, however they can
be classified into two main groups as follows:
+ The traditional methods: They are the methods commonly
used in the protection relay and power quality monitoring devices in
distribution network.
The root mean square (RMS) method
The fundamental voltage method
The peak voltage method
+ The morden methods: Because the traditional methods have
weaknesses in detecting the voltage disturbance characteristics so we
need to find out the modern methods to quickly and accurately detect
voltage disturbances.
The short-time Fourier transform
The adaptive linear neural network (ADALINE)
The wavelet transform
1.3. Conclusion
Based on the content presented on the voltage disturbance
classification method of in distribution network. It shows that there
are many methods of classifying voltage disturbance, but each
method has different advantages and disadvantages. Therefore
finding a more suitable method to apply to the classification of
voltage disturbance types to bring high efficiency in monitoring,
operation distribution network.
Although classic methods has advantages but also exist certain
disadvantage in determining the characteristics to classify the voltage
disturbance types. Therefore the trend will study application of
6
methods of modern signal processing to determine parameters and
accurate classification of voltage disturbance types. A review of
existing methods for determining the characteristics and classification
voltage disturbance shows that usually we have to combine modern
methods to maximize efficiency as well as overcoming disadvantages
each other in determining the characteristics and classification
voltage disturbances. Hence using DWT and ADALINE combined to
determine voltage disturbance characteristics.
CHAPTER
2.
A
CHARACTERISTICS
METHOD
AND
FOR
DETERMING
CLASSIFYING
VOLTAGE
DISTURBANCES IN DISTRIBUTION NETWORK
2.1. Introduction
Voltage disturbance monitoring becomes necessary in the
management and operation in order to improve the quality of
electricity supply to customers especially for modern industrial
customers such as electronic manufacture, semiconductor material
manufacture, computer data centers, etc. as shown in Figure 2.1.
Factories
Grid
Sensitive
equipment
Figure 2.1. The necessary of voltage disturbance monitoring.
2.2. Characteristics and classification of voltage disturbances
The monitoring system includes three modules as shown in
Figure 2.3. Voltage disturbance characteristics as shown in Figure
2.4.
7
Monitoring point
Steady state measurement
Grid
TU
Module of
DAQ and
trigger
Module of
classification
system
Thresholds and
settings
Reference
data
Module of
monitoring
results
Alarm/
Trip
Event log:
Type, amplitude,
duration
statistics:
Trends, charts.
Figure 2.3. Modules of voltage disturbance monitoring system.
Long-term voltage
variations
Short-term voltage variations
2.0
1.8
Instantaneous
Overvoltage
Event magnitude (p.u)
1.6
Momentary
1.4
Temporary
1.2
1.0
0.8
0.6
0.4
Under-
0.2
voltage
0.0
0.5 cycles
30 cycles
3s
1 min
Duration of event
Note:
Sag
Swell
Long
interruption
Interruption
Figure 2.4. Definition of voltage disturbances according to 1159-2009 [32].
2.3. Background of wavelet transform
2.3.1. Wavelet transform (WT)
2.3.2. Discrete wavelet transform (DWT)
2.3.3 Mother wavelet selection
2.4. The proposed method
The algorithm of proposed method is shown in Figure 2.7.
There are 3 main parts: (1) – This is the signal processing unit using
low-pass filters and A/D conversion to get the voltage digital signal
form. (2) - This component combines DWT and ADALINE to extract
the characteristics of voltage signal that is: duration and magnitude of
the event from the input voltage signal. (3) – This is voltage
8
disturbance classification unit from the characteristic extracted earlier
to return the result of the types of voltage disturbance. The
classification algorithm is shown in Figure 2.8.
(2)
(1)
u(t)
Signal
processing;
Lowpass filter
u(n)
A/D conversion
DWT using Db6
with J levels
D1(n)
AJ(n)
ADALINE
(3)
U1(n)
Classification
results
Classifying
voltage
disturbances
Idendifying:
- Duration
- Magnitude
Figure 2.7. Characteristic determination and voltage disturbance
classification
2.4.1. Determine J levels in DWT
DWT multi-resolution analysis transforms the original signal
in time domain to time domain-frequency. Assuming voltage signal
with sampling frequency is fs, while the approximation coefficients
(Aj) and detail coefficients (Dj) with different frequency bands.
2.4.2. Voltage amplitude estimate by ADALINE
ADALINE is a form of adaptive filter used to extract the signal
in the noise environment using two-layer feedforward neural
network, with N inputs and one output [66], [8]. ADALINE has
many advantages as follows: online training based on the change in
the input and output response; Self-adaptive algorithm is applied to
train the network weights; Simple structure and easy integration of
the hardware.
2.4.3. Voltage disturbance classification
9
30% swell
50% sag
ts
te
Error! No text of specified style in document..1.
Figure 2.9. Voltage sag
b)
D1, (c)
ts
te
Figure 2.10. Voltage swell
Error! No text of specified style in document..1.
(U1
.
characteristics using the method.
Characteristics using the method.
1
1
2.5. The results of the proposed method
2.5.1. Signal mathematical model of voltage disturbances
To evaluate the effectiveness of the proposed method, voltage
disturbance data is created by using mathematical equations:
U sin t
if t ts | t te
u (t ) m
U dis sin t dis if ts t te
(2.27)
Using Matlab software to create signal samples by using (2.27)
with a sampling frequency of 512 samples/cycle for the fundamental
frequency of 50 Hz, with the voltage disturbance parameters within
the limits according to IEEE Std. 1159-2009 standard.
2.5.2. Electromagnetic transient software by Matlab/Simulink
Matlab/Simulink software is used as a tool for modeling IEEE
34 buses distribution netword [77], some simulation cases are
considered to simulate and voltage in a number of buses are kept to
create a database for studies assessing the effectiveness of the
proposed method.
10
Figure 2.12. The voltage profile is in grid IEEE 34 when faults occurs at bus 836.
2.5.3. Accuracy assessment of the method estimates the V-D-A
The time and amplitude estimation error:
t dt dt '
u %
U 890 U 890
U 890
(2.34)
100
2.5.4. Application for the voltage waveforms
Figure 2.17. Case 1.
Figure 2.18. Case 2.
11
Figure 2.19. Case 3.
2.7. Conclusion
DWT is used in this dissertation to extract the typical
characteristics of voltage disturbances: voltage sag, voltage swell and
voltage interruption. Detail level 1 (D1) coefficients of DWT is very
sensitive to sudden changes in the signal, so it is used to determine
the beginning and end of the signal disturbance.
Using the number of analysis levels consistent with the
sampling frequency of the signal voltage to generate approximately
AJ coefficients which contain only the fundamental frequency range
desired. AJ approximation coefficient is considered as input of
ADALINE to estimate the amplitude of the voltage signal.
Modeling data to assess the effectiveness of the proposed
method is done by mathematical modeling and simulation of
electromagnetic transients using Matlab/Simulink software for IEEE
34 buses network. Short-circuits are simulated at several locations as
well as the changes in value of the fault impendance and event
duration to create database to evaluate the proposed method.
12
CHAPTER 3. DETERMINING VOLTAGE SAG INDICES FOR
SENSITIVE LOADS IN DISTRIBUTION NETWORK
3.1. Introduction
3.2. Determining voltage sag indices in power systems
3.2.1. The method of sequence components
3.2.2. The method of six RMS voltages
3.3. Voltage sag indices according to IEEE Std. 1564-2014
3.3.1. The single event indices
3.3.2. The site indices
3.3.3. The system indices
3.4. Voltage sag indices according to IEEE Std. 1564-2014
The input database
including N samples
n=1
Application of the proposed method
in Chapter 2
n=n+1
No
Voltage sag?
Yes
1
2
3
Determining duration and magnitude of
voltage sag
Calculating voltage sag energy and severity
Classifying types of voltage sag
No
n>N?
Yes
Calculating the site indicies: SARFIX,
SARFISEMI, SARFIITIC and IEC table
Voltage quality evaluation based on the
voltage sag indicies
Figure 3.7. The proposed method for determining voltage sag indices.
13
The proposed method for determining voltage sag indices in
order to evaluate voltage quality in distribution network are
implemented by using the proposed method in Chapter 2. The
algorithm is shown in Figure 3.7. The inputs are database of voltage
disturbance events which were gathered from different sources such
as the power quality monitoring, fault record equipment, protection
relay, intelligent measurement equipment, etc. The database is
voltage signals sampled from events occurred at monitoring points.
3.5. Calculating voltage sag indices
3.5.1. Determining the single-event indices of voltage waveforms
The author uses voltage waveforms occurred in three-phase
power systems to evaluate the proposed method in determining
voltage sag characteristics and indices. The database of voltage
waveforms are used from the sample sources in the power quality
analysis program PQDiffractor [80]. From the sample database
available in the program, the author chooses 3 voltage sag waveforms
as shown in Figure 3.8(a), Figure 3.9(a) and Figure 3.10(a) to
calculate voltage indices. Figure 3.8(b), Figure 3.8(b) and Figure
3.10(b) are the results of their RMS voltages. The single-event
indices are also determined using the proposed method.
5
a) Dien ap ba pha
x 10
uabc (V)
1
Ua
Ub
Uc
0.5
0
0
h i gian t n t i:
0.05
0.1
0.15
0.2
0.25
b) Dien ap RMS
sự kiện
ng l
c
k
ng mất: Esv = 3.1340 s
độ nghiệm trọng: Se = 0.3922 (p.u)
1
Uabc (p.u)
s
Biên độ lõm áp: U% = 76.39%
-0.5
-1
các c
K
D ng lõm áp: Ca
0.9
iện áp đ
0.8
ệ s thu n ngh h: F = 0.9420
tr ng: V = 0.7480 (p.u)
0.7
0
0.05
0.1
0.15
t (s)
0.2
0.25
Figure Error!
3.8. No
The
results of the single-event voltagetheo
sag (Sample 1).
text of specified style in document..1
14
4
a) Dien ap ba pha
x 10
2
uabc (V)
K
Ua
Ub
Uc
1
0
h i gian t n t i:
0
0.1
0.2
0.3
0.4
0.5
ng l
0.6
c
k
ng mất: Esv = 2.423 s
độ nghiêm trọng: Se = 0.6283 (p.u)
b) Dien ap RMS
D ng lõm áp: Cb
1
Uabc (p.u)
s theo sự kiện
Biên độ lõm áp: % = 80.96%
-1
-2
các c
0.9
iện áp đ
0.8
ệ s thu n ngh h:
tr ng: V = 0.7770 (p.u)
0.7
0
0.1
0.2
0.3
t (s)
0.4
0.5
0.6
Error! No text of specified style in document..1
theo
Figure 3.9. The results of the single-event voltage sag (Sample 2).
4
a) Dien ap ba pha
x 10
Ua
Ub
Uc
uabc (V)
1
0
K
s theo sự kiện
Biên độ lõm áp: U% = 81.16%
h i gian t n t i:
-1
0
0.02
0.04
0.06
0.08
0.1
ng l
0.12
c
k
ng mất: Esv = 2.3160 s
độ nghiêm trọng: Se = 0.6283 (p.u)
b) Dien ap RMS
D ng lõm áp: Cc
1
Uabc (p.u)
các c
iện áp đ
0.9
tr ng: V = 0.807 (p.u)
ệ s thu n ngh h: F = 0.9350
0.8
0.7
0
0.02
0.04
0.06
0.08
t (s)
0.1
0.12
theo
Figure 3.10. The results of the single-event voltage
sag (Sample 3).
Error! No text of specified style in document..1
3.5.2. Application for the tower Dang Minh, HCM city
3.5.2.1. The results of single-event indices
This dissertation uses the real database from events occurred
and recorded by power quality monitoring PQube installed at the
tower Dang Minh, HCM city. Figure 3.11 shows the results of
severity, non-severity voltage sag and other events in July and
August, 2015 at the tower Dang Minh.
(a)
Error! No text of specified style in document..1
(b)
phân tích
Figure 3.11. The analysis results of voltage sags in July and August, 2015.
15
3.5.2.2. The results of the site indices
T ng
S vi ph
i n: 545
ITIC: 349
T ng
S vi ph
i n:
545
SEMI: 349
Figure 3.12. SARFICurve indices according to type of curve of July, 2015.
3.6. Conclusion
From the analysis results in this chapter, every type of voltage
sag in three-phase power system is characteristed by type, magnitude
and duration time.
When all events at single monitoring position are determined
the characteristics and indices of the single-event then the site indices
are also indentified to evaluate voltage quality at the position. The
site indices are used in this dissertation including: SARFIX, SARFIITIC,
SARFISEMI, voltage sag table, energy of voltage sags and severity of
voltage sags.
In this chapter, a calculation program indices and statistic the
voltage sag events are build-up in Matlab software. Applying the
method which is proposed in Chapter 2 to calculate voltage sags and
compare with the standard method according to IEEE Std. 15642014.
In order to evaluate the proposed method, a database of voltage
sag waveforms are extracted from the power quality analysis program
PQDiffrator to evaluate the proposed method. In addition, voltage
sag events recorded at the tower Dang Minh, HCM city are also used
to calculate the voltage sag indices.
16
CHAPTER 4. VOLTAGE SAG/SWELL MITIGATION FOR
SENSITIVE LOADS IN DISTRIBUTION NETWORK
4.1. Introduction
4.2. The main characteristics of voltage sag
4.2.1. Voltage sag magnitude
Let we consider a 22 kV power system as shown in Figure 4.4.
The influence of short-circuit power of grid source to voltage sag
1
1
0.8
0.8
Usag (p.u)
Usag (p.u)
magnitude as shown in Figure 4.5.
0.6
0.4
0.6
0.4
SN = 750 MVA
0.2
F = 50 mm 2
0.2
SN = 200 MVA
F = 120 mm 2
SN = 75 MVA
0
F = 240 mm 2
0
0
5
10
15
20
25
0
5
10
15
20
25
L (km)
L (km)
Figure 4.5. The influence of short-
Figure 4.6. The influence of cross
circuit power to magnitude.
area of power lines to magnitude.
4.2.2. Time duration
4.2.3. Phase angle jump
4.3. The impacts of voltage sags
4.4. Voltage sag/swell mitigation methods
4.5. Voltage sag/swell mitigation using DVR
4.6. The proposed method of voltage sag impact study to the
sensitive loads
The impact evaluation of voltage sag to sensitive loads in
distribution network often implement by using physical models [12].
However the evaluation by using that method needs to have a real
voltage sag source equipment, high cost and difficult implemention.
17
Therefore in this dissertation, the author proposes a method based on
function modules in Matlab/Simulink software to determine
charateristics of voltage sag and its effects to sensitive loads in
distribution networks. The algorithm of the proposed method is
shown in Figure 4.20.
Voltage sag are created by
mathematic model,
simulation or real data
The signals are amplified
according to voltage level
feed in sensitive loads
Three-phase voltage
sag source model
The three-phase controlled
voltage source model
Three-phase measurement
Sensitive load model
Determination model of
voltage sag characteristics:
magnitude and duration
Analysis model of
voltage sag impacts to
sensitive loads
Figure 4.20. The proposed method for studying voltage sag impacts to
sensitive loads.
4.6.1. Voltage sag source module
4.6.2. Voltage sag characteristic determination module
4.6.3. Voltage sag impacts to AC-DC-AC conversion
+ Object description: Figure 4.24 shows the study model of
voltage sag impacts to AC-DC-AC conversion [76].
18
Figure 4.24. A study of voltage sag impacts to AC-DC-AC conversion.
+ The results: Voltage sag effects to the operation of AC-DCAC conversion if it make the DC voltage of the conversion decreases
below the minimum DC voltage (UDCmin) then the conversion will be
switch off the grid [14]. Howerver each type of voltage sag will have
the different impacts to the operation of AC-DC-AC conversion.
Let’ uppo e that V=0.5 (p.u), the i pact of voltage ag type A and
C to the AC-DC-AC conversion operation respectively in Figure 4.25
and Figure 4.26.
Figure 4.25. The impacts of voltage
Figure 4.26. The impacts of voltage
sag type A to AC-DC-AC.
sag type C to AC-DC-AC.
The dependence of DC minimum voltage (Udcmin) at output of
the conversion depend on the characteristic voltage (V) and duration
time of voltage sag types. This is shown in Figure 4.28 to Figure 4.34
re pectively voltage ag type A, B,…, G.
19
Figure 4.28. The dependence of DC
Figure 4.29. The dependence of DC
minimum voltage (type A).
minimum voltage (type B).
4.7. DVR application to mitigate voltage sag/swell
4.7.1. The proposed configuration of DVR
The configuration of DVR is used in this section is shown in
Figure 4.35.
Udvr
Zs
It
Ut
Us
Cfa
Ngu n
T i
Lfa
C1
S1
S3
S2
S4
Udc
C2
Bộ điều hiển
Thestyle
configuration
Error!Figure
No text of4.35.
specified
in document..1of
4.7.2. Control system of DVR
DVR.
DVR.
The block diagram of DVR control system uses the d-q-0
transform method shown in Figure 4.36.
20
PLL
Supply voltage Us
Referrence voltage
Uref
Convert to d-q-0
Convert to d-q-0
Comparator
Convert to abc
PWM signals
VSC
Figure 4.36. The DVR control algorithm base on the d-q-0 transform.
4.7.3. The results of DVR to mitigate voltage sag/swell
The DVR model proposed in this study is modeled in
Matlab/Simulink shown in Figure 4.37.
Figure 4.37. The DVR model to mitigate voltage sag/swell.
4.7.3.1. Voltage sag
21
Lets three-phase voltage sag has Usag = 0.5 pu occurs at source
side beginning at ts = 0.2 s and ending at te = 0.4 s. Three phase
source voltages decrease to 0.5 p.u in duration 0.2 – 0.4 s shown in
Figure 4.38(a). When voltage sag is detected, DVR will create
compensation voltages series to source voltages with waveforms in
Figure 4.38(b) to compensate voltage sag caussed.
The single-phase voltage sag occurs in source side is
considered in Figure 4.39. In this case, phase A occurs sag in
duration 0.2-0.4 s shown in Figure 3.39(a). When voltage sag is
detected the DVR will create compensation voltage on phase A
shown in Figure 4.39(b). The results of load voltage is remained at
nominal level in that duration as shown in Figure 4.39(c). Therefore
the load is not effected by voltage sag at source side.
(a) Dien ap nguon
(a) Dien ap nguon
1
Us (p.u)
Us (p.u)
1
0
-1
0.1
0
-1
0.2
0.3
0.4
0.5
0.1
0.2
1
0
-1
0.1
0.2
0.3
0.4
0.5
0.5
0.4
0.5
0.4
0.5
0
-1
0.1
0.2
0.3
(c) Dien ap tai
1
1
Ut (p.u)
Ut (p.u)
0.4
1
(c) Dien ap tai
0
-1
0.1
0.3
(b) Dien ap DVR
Udvr (p.u)
Udvr (p.u)
(b) Dien ap DVR
0
-1
0.2
0.3
t (s)
0.4
Figure 4.38. Three-phase sag.
0.5
0.1
0.2
0.3
t (s)
Figure 4.39. Single phase sag.
4.7.3.2. Voltage swell
Lets consider three-phase voltage swell with Uswell = 1.5 p.u
occurs in source side beginning at ts = 0.2 s and ending at te = 0.4 s.
22
Three phase voltage at source side will increase to 1.5 p.u in that
duration as shown in Figure 4.39(a). When voltage swell is detected,
DVR will create the compensation voltage as waveform in Figure
4.41(b) to compensate voltage swell. The result of load voltage is
remained at nominal level 1.0 p.u as shown in Figure 4.41(c) in that
duration. Therefore the load is not effected by voltage swell in source
side.
The single phase voltage swell at source side is considered as
Figure 4.42. In this case, phase A is swell in duration 0.2 – 0.4 s as
Figure 4.42(a). When voltage swell is detected then DVR will create
voltage to compensate on phase A as shown in Figure 4.42(b). The
results of load voltage is remained at nominal level as shown in
Figure 4.42(c). Therefore load is not effected by swell in source side.
(a) Dien ap nguon
(a) Dien ap nguon
2
Us (p.u)
Us (p.u)
2
0
-2
0.1
0.2
0.3
0.4
0
-2
0.1
0.5
0.2
(b) Dien ap DVR
0
0.2
0.3
0.4
-2
0.1
0.5
0.2
0.3
0.4
0.5
0.4
0.5
(c) Dien ap tai
2
Ut (p.u)
2
Ut (p.u)
0.5
0
(c) Dien ap tai
0
-2
0.1
0.4
2
Udvr (p.u)
Udvr (p.u)
2
-2
0.1
0.3
(b) Dien ap DVR
0.2
0.3
t (s)
0.4
0.5
Figure 4.41. Three-phase swell.
0
-2
0.1
0.2
0.3
t (s)
Figure 4.42. The single-phase swell.
4.8. Conclusion
This chapter proposed a method to study voltage sag impacts
to sensitive loads in distribution networks based on modules and
23
function blocks in Matlab/Simulink software contribute in the
research, evaluation of voltage sag impacts to the operation of
sensitive loads in distribution networks.
Application of the proposed method to research voltage sag
impacts to AC-DC-AC conversion operation. The simulation results
are based Matlab/Simulink model which shows voltage sag events
occurs in short-time duration but they can effect to the operation of
the sensitive equipment.
Application of DVR to mitigate voltage sag/swell for sensitive
loads in distribution networks. The configuration and control method
based on the d-q-0 transform are proposed and modeled in Matlab/
Simulink. Three-phase and single-phase voltage sag/swell are studied
in this work to evaluate the proposed method.
CONCLUSION AND RECOMMENDATION
1. Conclusion
Based on research purposes, dissertation entitled “A tudy of
voltage
disturbances
in
distribution
networks”
has
novel
contributions in the field of voltage disturbance classification and
mitigation research in distribution networks as following:
1.
This
dissertation
proposes
a
voltage
disturbance
classification method in distribution network based on discrete
wavelet transform (DWT) and adaptive neural network (ADALINE).
The proposed method uses DWT to analysis the input voltage signal
to J levels which is determined according to the sampling frequency
of the input voltage signal. Therefore this transform will create an
approximation coefficient at level J (AJ) which only contains the
fundamental frequency. Then the detail coefficient (D1) is very