Experimental and computational assessment of inlet swirl effects on a gasoline compression ignition (GCI) light duty diesel engine
Bạn đang xem bản rút gọn của tài liệu. Xem và tải ngay bản đầy đủ của tài liệu tại đây (7.14 MB, 19 trang )
Experimental and Computational Assessment of Inlet
Swirl Effects on a Gasoline Compression Ignition (GCI)
Light-Duty Diesel Engine
2014-01-1299
Published 04/01/2014
Paul Loeper, Youngchul Ra, David Foster, and Jaal Ghandhi
Univ. of Wisconsin
CITATION: Loeper, P., Ra, Y., Foster, D., and Ghandhi, J., "Experimental and Computational Assessment of Inlet Swirl
Effects on a Gasoline Compression Ignition (GCI) Light-Duty Diesel Engine," SAE Technical Paper 2014-01-1299, 2014,
doi:10.4271/2014-01-1299.
Copyright © 2014 SAE International
Abstract
The light-medium load operating regime (4-8 bar net IMEP)
presents many challenges for advanced low temperature
combustion strategies (e.g. HCCI, PPC) in light-duty, high
speed engines. In this operating regime, lean global
equivalence ratios (Φ<0.4) present challenges with respect to
autoignition of gasoline-like fuels. Considering this intake
temperature sensitivity, the objective of this work was to
investigate, both experimentally and computationally, gasoline
compression ignition (GCI) combustion operating sensitivity to
inlet swirl ratio (Rs) variations when using a single fuel
(87-octane gasoline) in a 0.475-liter single-cylinder engine
based on a production GM 1.9-liter high speed diesel engine.
For the first part of this investigation, an experimental matrix
was developed to determine how changing inlet swirl affected
GCI operation at various fixed load and engine speed
operating conditions (4 and 8 bar net IMEP; 1300 and 2000
RPM). Here, experimental results showed significant changes
in CA50 due to changes in inlet swirl ratio. For example, at the
4 bar net IMEP operating condition at 1300 RPM, a reduction
in swirl ratio (from 2.2 to 1.5) caused a 6 CAD advancement of
CA50, while increasing swirl ratio (from 2.2 to 3.5) resulted in a
2 CAD retard of CA50. This advancement in CA50 at the 1.5
swirl ratio operating point was accompanied with significant
increases in NOx emissions (from 0.2 to 1.6 g/kg-fuel). Minor
adjustments in injection strategy could be made to maintain
NOx emissions less than 1 g/kg-fuel.
In subsequent experiments at 4 bar net IMEP, first equivalence
ratio, then CA50 were matched in an effort to further isolate the
effects of changing swirl ratio. In these later cases conditions
allowed for a 25C reduction in the required inlet temperature at
the lower swirl condition (from 77C to 52C when reducing swirl
from 2.2 to 1.5). Experimental measurements were numerically
simulated to help analyze the combustion behavior and
emissions characteristics using a 3D-CFD code coupled with
detailed chemistry. This numerical investigation quantified the
thermal and mixing effects of swirl ratio variation on mixture
conditions before ignition and subsequent influence on ignition
timing, in-cylinder pressure profile, and emissions.
Introduction
Global energy consumption forecasts continue to predict
increasing demand for liquid hydrocarbon fuels for the
foreseeable future. For example, the EIA projects liquid fuel
consumption in the transportation sector to increase 46% by
2035, relative to 2008 levels [1]. As a result, concerns related
to excessive urban air pollution as well as consumption of finite
petroleum resources has prompted governmental agencies to
develop increasingly stringent vehicle emissions and fuel
consumption standards. As a result, the two primary IC engine
combustion strategies, gasoline spark-ignition and diesel
compression ignition, have necessarily evolved. For example,
and in general, engine manufacturers have attempted to
improve the fuel consumption of spark-ignited engines by a
combination of reduced displacement, intake turbocharging
and/or implementation of direct injection fuel systems. In
contrast, with inherent advantages related to thermal efficiency
(but challenges related to PM and NOx emissions), diesel
engine development has focused on increased fuel injection
pressures (to enhance air-fuel mixing prior to ignition) and the
use of exhaust gas recirculation (EGR) to reduce peak
combustion temperatures (and higher NOx formation rates)
and the implementation of exhaust gas aftertreatment.
In parallel, advanced combustion research over the last 30
years has focused on the development of low temperature
combustion (LTC) strategies. The primary objective in an LTC
strategy is to develop an air-fuel charge prior to autoignition
devoid of locally rich mixture concentrations that can lead to
either excessive PM (due to insufficient mixing) or NOx
emissions (where locally near-stoichiometric mixture
concentrations can result in high peak combustion
temperatures). By avoiding excessive PM and NOx formation
regions, simultaneous reductions in both can be achieved.
HCCI served as an early example of LTC, and as Najt, Foster,
Onishi et al. [2, 3] demonstrated, short (nearly-volumetric)
combustion durations of a highly premixed charge lead to
thermal efficiencies exceeding 40% (in addition to significant
PM and NOx emission reductions).
However, the combination of kinetically controlled combustion
phasing and short combustion durations presented challenges
with respect to controllability and engine load limitations.
Christensen and Johansson [4, 5] demonstrated the ability to
use EGR and/or intake turbocharging to expand high load
operation. In addition, as demonstrated by Noda, Sjoberg,
Aroonsrisopon et al. [6, 7, 8, 9], HCCI combustion phasing and
duration was shown to be sensitive to temperature and mixture
concentration gradients (i.e. stratification). As a result, varying
levels of mixture and/or temperature stratification were
observed to affect combustion durations leading to moreacceptable pressure rise rates at a given speed/load operating
condition. The ability to use mixture and temperature
stratification to enable better control over combustion phasing
and duration has since led to the development of multiple
variations of HCCI (e.g. PPC, PPCI, GCI, RCCI, etc.). Varying
the inlet air swirl ratio is one method that can be used to vary
in-cylinder temperature stratification.
Traditionally, increasing inlet air swirl has been used as a
strategy in high speed diesel engines to enhance air-fuel
mixing prior to autoignition. And when using a highly reactive
fuel such as diesel, enhanced mixing (or increased
homogeneity) has been observed to reduce specific fuel
consumption due to shorter combustion durations and more
optimal combustion phasing; as well as reductions in PM, CO,
and UHC emissions. In an optical diesel engine, Miles [10]
confirmed combustion processes were significantly affected by
increasing Rs from 1.5 to 3.5 with reductions in ignition delay,
peak heat release rates, and pressure rise rates. Interestingly,
early heat release was shown to be insensitive to changes in
swirl ratio (Rs) during early mixing controlled combustion;
however, later during combustion, the heat release rate then
increased with increasing Rs. Here, combustion luminosity
imaging showed increased activity in the squish and bowl
regions of the combustion chamber during these periods.
Whereas swirl effects have been extensively studied in high
speed diesel applications as discussed previously, a review of
the literature reveals less cohesion with respect to swirl effects
in LTC applications using low reactivity fuels (e.g. gasoline).
For example, in a model developed by Aceves et al. [11]
simulating propane HCCI, reduced inlet swirl (from 4.3 to 0.43)
was examined as a strategy to reduce UHC and CO emissions.
Due to the enhancement of heat transfer resulting from high
inlet swirl (and corresponding increase in boundary layer
thickness), the authors reasoned increasing inlet swirl results
in a overall cooler in-cylinder charge, thus slowing (or
potentially quenching) CO and UHC oxidation kinetics. At the
lower swirl ratio, their model demonstrated negligible effects
with respect to temperature distribution and CO/UHC emission
levels. Experimental results from Christensen and Johansson
[12] (using both PRF50 and pure iso-octane fuels) compared
combustion phasing and emissions performance between a
flat-top and square bowl piston at two different Rs (2.0 vs. 2.8)
in a 1.6-liter engine at 1200 RPM. In results obtained using
pure iso-octane at =0.4, combustion phasing advanced
(between 1 and 2 CAD) for a fixed inlet temperature when swirl
was increased to 2.8. Additionally, the high swirl case resulted
in improvements in combustion and thermal efficiencies, as
well as reductions in HC emissions.
Following, Sjoberg et al. [9] investigated using varying inlet
swirl ratios to shape HCCI heat release rates in a 0.98-liter
single cylinder engine (based on a Cummins B-series diesel
6-cylinder engine) at 1200 RPM. The authors hypothesized
combustion durations could be extended by increasing inlet air
swirl. This would result in increased heat transfer, which would
then create a larger temperature distribution (or thicker
temperature boundary layer). At a fixed CA50 (7.2 ATDC) and
equivalence ratio (Φ=0.381), increasing Rs from 0.9 to 3.6
increased CA10-90 from 4.64 CAD to 5.94 CAD (a 28%
increase). In these cases, fixed CA50 was achieved by
increasing IVC temperature in the higher swirl case (in excess
of 15C higher than the low swirl case). As a result of higher IVC
temperatures (i.e. less dense), gross IMEP was reduced in the
higher swirl case. Therefore, when fueling was increased to
maintain fixed gross IMEP (4.43 bar), the combustion duration
only increased 11.6% in the higher swirl scenario (5.18 vs. 4.64
CAD) and was accompanied by a 3.7% increases in ISFC. In
contrast, by maintaining a fixed Rs of 0.9, the authors observed
similar increases in CA10-90 by reducing coolant temperatures
from 100C to 50C, but with fewer penalties in fuel consumption
(0.5%). As a result, the authors questioned the merits of using
swirl enhancement to extend combustion duration i.e.
increased heat transfer (and reduced efficiency) rates negated
most benefits.
Objectives
Considering the previously discussed results and conclusions
related to inlet swirl effects in LTC strategies, the objectives of
the work to be presented can be divided into three parts:
1. Experimental assessment of inlet swirl effects in a GCI
strategy over a larger load and speed range, than previously
investigated. Results concerning attempts to isolate swirl
effects by first maintaining fixed equivalence ratio, and then
fixed CA50 as well, will be presented.
2. Utilize CFD simulation to provide insight into how the incylinder physics change due to variations in inlet swirl ratio
(e.g. air-fuel mixing vs. temperature effects)
3. Given the results of experiments and CFD simulation,
discuss the merits of using variable inlet swirl as a control
strategy in GCI operation.
Experiment
Engine Setup
The engine used in this study is based on a GM 1.9-liter
EuroIV light-duty 4-cylinder diesel engine. The production
cylinder head is mounted to a single cylinder Labeco CLR
crankcase. A re-entrant piston bowl (16.6:1 compression ratio)
was developed specifically for diesel LTC experiments, and
remains in place for these GCI experiments. Turbocharging
conditions can be simulated through PID control of inlet and
exhaust charge tank pressures. Cooled exhaust gas
recirculation (EGR) can be driven by maintaining a differential
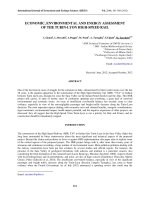
pressure between the surge tanks (shown in Figure 1).
Additional engine specifications are listed in Table 1.
A Kistler 6125B piezoelectric transducer is used for high
resolution cylinder pressure measurements. A BEI encoder
provides 10 pressure measurements per crank angle degree;
high speed data are then averaged over 200 cycles.
A primary objective of this research is to use readily available
87-octane gasoline without addition of ethanol. Fuel properties
are shown in Table 3.
Table 3. Specifications of gasoline used in experiments
Figure 1. Engine test cell experimental setup at the University of
Wisconsin-Madison / GM Collaborative Research Laboratory
Table 1. Single-cylinder engine specifications
Similar to the cylinder head and piston, fueling system
hardware closely resembles the production engine
configuration as well. An off-engine fuel cart utilizing a Bosch
CP3.3 pump delivers fuel to a Bosch common rail and CRIP2MI injector. Rail pressure (maintained by inlet metering and
high pressure bypass valve), injection timing, and duration
parameters are managed through flash commands to a
rewritable ECU via ETAS INCA calibration software. The
experimental injector tip used in this study has 7-holes and a
155° included cone angle. Fuel injection system specifications
are listed in Table 2.
Horiba emission analyzers were used to monitor both exhaust
and intake gas compositions. Five analyzers, including CO2
(Horiba model FMA-220), O2 (AIA-220), CO, NOx (CLA-220),
and HC (FIA-236-1), monitored exhaust gas concentrations
while 2 additional analyzers (CO2 and O2) monitored intake gas
composition. Heated sample lines maintained gas samples at
191°C prior to entering the emissions bench where after the
samples were cooled to condense water (except for the HC
sample). Particulate measurements were monitored using an
AVL Smoke Meter (415S); further discussion of PM
measurements will be omitted since PM measurements never
exceeded 0.01 g/kg-fuel injected.
More specific to the work presented here, inlet swirl ratio
adjustments were made through the adjustment of butterfly
valves housed within a swirl plate (located between the intake
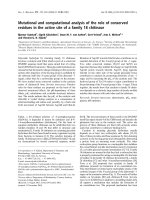
runner and engine cylinder head), as shown in Figure 2.
Table 2. Bosch fuel injection system specifications
Figure 2. The swirl plate situated between the intake runner and
cylinder head features both helical and tangential intake ports. Intake
swirl can be adjusted by opening and/or closing butterfly valves (19
positions) located in the ports.
As seen in Figure 2, butterfly valve adjustments in the helical
and tangential ports can provide a range of inlet swirl ratios, as
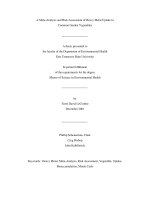
shown in Figure 3.
Figure 4. Experimental test matrix consisting of swirl investigations at
three operating conditions.
Table 4. For each operating condition, three separate cases were
developed to try and isolate inlet swirl effects in GCI operation.
Figure 3. Inlet swirl ratios as a function of butterfly valve position in
either helical or tangential ports. Note Rs=2.2 represents the baseline
inlet swirl condition in which both helical and tangential valves are fully
open.
The inlet swirl ratio has been constant, at Rs=2.2, for the
majority of GCI work within the UW ERC-GM CRL. Therefore,
for each of the load and speed operating conditions
investigated here, Rs=2.2 serves as a baseline operating point.
Experimental Test Conditions
In order to assess the effects of variable swirl ratio in a GCI
operating strategy, three load/speed conditions were selected
encompassing the light-medium load operating regime (see
Figure 4) at inlet swirl ratio values of 1.5, 2.2, and 3.5.
At each load-speed operating condition, three experimental
cases were selected in an effort to isolate inlet swirl effects, as
shown in Table 4.
In case 1, both inlet temperature and IMAP were held constant,
which demonstrated engine response due to varying levels of
intake throttling. Due to these inherent throttling effects, in case
2 the IMAP was adjusted to maintain fixed equivalent ratios for
all three swirl ratios investigated. Lastly, the inlet temperature
was adjusted in case 3 to maintain fixed combustion phasing
(CA50) and allow for further isolation of inlet swirl effects in
GCI. In all three cases, fuel flow was adjusted as necessary to
maintain fixed net IMEP (either 4 bar or 8 bar).
Numerical Approach
Physical Models
For simulating the spray processes and the subsequent mixing
and combustion of fuel/air mixtures in the combustion chamber,
various physical sub-models were employed in the present
KIVA-ERC-CHEMKIN code. The code is based on KIVA3V
Release 2 [13] coupled with the CHEMKIN II library [14] The
added sub-models include models related to drop breakup,
collision and coalescence, drop deformation, drop evaporation,
wall impingement and vaporization, etc.
A hybrid primary spray break-up model that is computationally
efficient as well as comprehensive enough to account for the
effects of aerodynamics, liquid properties and nozzle flows was
employed [15]. In this model, the injected fuel “blobs” are
tracked by a Lagrangian method while the break-up of each
blob is calculated from considerations of jet stability using
Kelvin-Helmholtz (KH) instability theory. For secondary and
further break-up processes, a Kelvin Helmholtz (KH) - Rayleigh
Taylor (RT) hybrid model was used. In the present study, the
model constants were used as suggested by Beale and Reitz
[15] since, due to high volatility of gasoline, the fuel distribution
in the cylinder is not as sensitive to spray model constants as it
is in diesel-fueled spray cases.
A droplet collision model based on the stochastic particle
method [13], in which the collision frequency is used to
calculate the probability that a drop in one parcel will undergo a
collision with a drop in another parcel, was used assuming all
drops in each parcel behave in the same manner. The
probability of coalescence is determined by considering the
Weber number that includes the effects of density and surface
tension of the liquid droplets.
Droplet deformation in terms of its distortion from sphericity is
modeled using a forced, damped harmonic oscillator model,
where the surface tension and viscosity of the droplet are the
major properties used in the restoring force and damping
terms, respectively [16]. Distortions of the droplets affect the
momentum exchange between the droplets and the ambient
gas; and subsequently, drop velocities (or relative velocity
between the drop and the gas) that are governing parameters
in the breakup and evaporation processes as well.
The droplet vaporization model [17] considers the evaporation
of spray droplets using the Discrete Multi-Component (DMC)
approach under temperatures ranging from flash-boiling
conditions to normal evaporation. The improved model
accounts for variable internal droplet temperatures, and
considers an unsteady internal heat flux with internal
circulation, and a model for the determination of the droplet
surface temperature. The model uses an effective heat transfer
coefficient model for the heat flux from the surrounding gas to
the droplet surface. Also, the variable density of the gasoline
surrogate fuel as a function of temperature is considered in the
governing equations and the relevant sub-models. The
effective heat transfer coefficient calculated in the model is also
used to determine the amount of fuel to be treated as vapor
when the drop surface temperature reaches the critical
temperature while the drop interior is still in the sub-critical
condition. The model has been well tested for evaporation of
both sprays and single drops at various pressure and
temperature conditions, including flash-boiling.
Effects associated with spray/wall interactions, including
droplet splash, film spreading due to impingement forces, and
motion due to film inertia were considered in a wall film
sub-model, in addition to calculations of film transport on
complex surfaces with heating and vaporization of the film, and
separation and re-entrainment of films at sharp corners [18].
For the turbulence calculation, the RNG k-ε model [19] was
used.
In the two-phase transport equations, droplets are treated as
point sources and the wall film fuel flow is not resolved on the
computational grid. Therefore, it is assumed that in a
computational cell where droplets or wall film parcels exist, the
liquid vaporizes under the prevailing mixture conditions and the
vapor mixes completely with the gaseous mixture within the
cell. Thus, stratification of gaseous species within a single cell
is not resolved.
The physical models employed in the present study have been
extensively validated for diesel spray injections. Although the
models were not extensively validated with gasoline sprays in
the present study. The performance of the models in gasoline
application was tested by the authors in the previous study
[20]. Lastly, with respect to simulating inlet swirl, the initial
velocity profiles were developed using the Bessel function such
that the overall swirl ratio matched experimental flow-bench
data. The authors believe these resultant velocity profiles fairly
represent swirl motion in the experimental engine setup.
Combustion Models
The ignition/combustion characteristics of automotive fuels are
often represented using blends of two hydrocarbons, typically
the two primary reference fuels, i.e., iso-octane (iC8H18) and
n-heptane (C7H16). It is widely accepted that the oxidation
processes of n-heptane and iso-octane well represent the
ignition and combustion characteristics of diesel and gasoline
fuels, respectively. In the present study, a skeletal reaction
mechanism for primary reference fuel oxidation with 49 species
and 149 reactions [20, 21] was used to calculate the detailed
chemical kinetics of combustion. The mechanism has been
well validated using data from HCCI [22] and direct injection
engine experiments [23], as well as with the ignition delay time
data obtained in shock tube tests [24] for various temperatures,
pressures and fuel compositions. In the present study, gasoline
was modeled as PRF 87, i.e., 87 % iso-octane and 13 %
n-heptane for physical properties and chemistry calculation.
Assuming a well-stirred reactor in each cell, changes of
species concentration were obtained from the chemical
reaction calculations, which are directly integrated with the
transport calculations in the CFD code. For the calculation of
NOx formation, a 4 species (N, NO, N2O and NO2) and 12
reaction NOx mechanism was used that has been reduced
from the GRI NOx mechanism (available online) and added to
the PRF reaction mechanism. A phenomenological soot model,
modified from the Hiroyasu soot model [25] was employed to
predict soot emissions. For oxidation of soot, the NagleStrickland-Constable (NSC) model was employed in the soot
model.
Computational Conditions
The gasoline listed in Table 3 was considered for the
computations. The operating conditions in Table 5 with injection
pressure of 500 bar were used with injection timing as a
parametric variable. A small-bore light-duty diesel engine with
the injection system described above (see Tables 1 and 2) was
used for the simulations. Double injections through a 7-hole
injector with an included spray angle of 155° were modeled. In
the computations, the first injection pulse was assumed to be
made such that the injected fuel vaporizes completely and
mixes uniformly with the air before IVC timing. This assumption
corresponds to operation of the engine where the first pulse
was injected during valve overlap leaving the remainder of the
intake stroke to vaporize and mix before intake valve closure.
figure, the rates are normalized by the maximum value during
the injection. When the injection amount for each pulse was
changed as the engine operating conditions varied, the
duration of each pulse was changed accordingly based on the
measured injection rate profiles. The pressure wave
interactions between the 1st and 2nd pulses can be neglected
since the pulse dwell is long enough for such wave interactions
to damp out.
The injection timings of the second pulses were fixed at −31°
ATDC except for the case of Rs 1.5 in Case 3, the timing of
which was −35° ATDC. The initial and boundary conditions for
a baseline engine operation were first obtained from the
measured data of engine operation. Then, the initial and
boundary conditions were adjusted to match measured
pressure profiles of motoring operation.
The simulated cylinder gas pressures at intake valve closure
(IVC) were obtained from the experimental data and the gas
temperatures at IVC were estimated considering the
corresponding mass and pressure in the cylinder. It is notable
that, due to heat transfer from the cylinder walls, mixing of
fresh air with hot internal residual gases, and a slight
compression of the gas mixture during the period between
BDC and IVC, the gas temperatures at IVC are normally higher
than the intake port gas temperatures. No EGR was
considered, but internal residual exhaust gases were taken into
account to estimate the initial composition at IVC. The injection
pressure was 500 bar, which was significantly lowered from
those of high load operations using the same engine [20].
Detailed computed operating conditions are listed in Table 5.
Table 5. Simulated operating conditions. Numbers in parenthesis are
for the case with swirl ratio of 1.5 in Case-3
For double injection cases considered, the proportion of fuel
injected during the first pulse (hereafter, denoted as 1st split
ratio, S1), which was assumed to be completely vaporized and
uniformly mixed with air before IVC, was fixed at 56%, except
for the 1.5 swirl ratio case of Case-3 (67%).
In Figure 5, the injection rate shape profile of a 2 pulse for the
baseline double injection is shown. The start of injection
commands (SOIC) of the 1st pulse (not shown in the figure) is
−350° ATDC, and the 2nd pulse timing is −31° ATDC. In the
nd
Figure 5. Injection rate shape of a 2nd pulse for the baseline double
injection case (swirl ratio=2.2 of Case-1) used in simulations. Injection
pressure was 500 bar and pulse duration was 562 µs at engine speed
of 1300 rev/min. Rates are normalized by the maximum value during
the injection.
Three dimensional computational grids with the crevice volume
resolved as an elongated top land region were employed. To
save computation load, a 1/7th sector of the full 360° mesh
with periodic boundaries (corresponding to one plume from the
seven-hole injector nozzle) was used. The average cell
dimensions were 1.2 to 1.8 mm and 0.6 to 4.1 mm in the radial
and vertical directions, respectively, with twenty cells
azimuthally (see Figure 6). To resolve the crevice region, i.e.,
the gap between the piston and cylinder wall above the top
ring, two radial cells were used with three vertical cells. This
grid resolution was found to be sufficient to ensure grid
insensitivity of the spray sub-models and the combustion
model during this study.
Figure 6. Vertical cross-section view of the computational grid with
crevice volume resolved as a thin annulus. Azimuthal angle of the
sector span was 51.4 degrees.
Results
Experiments - Case 1
transfer from in-cylinder gases to the wall is enhanced resulting
in an overall cooler charge temperature. This reduction in
temperature causes combustion phasing to retard [6, 9].
During the first set of experiments (case 1), inlet swirl effects
were assessed at two engine speeds, 1300 and 2000 RPM.
This engine speed range is representative of low-to mediumload operation in a light duty vehicle. Additionally, if inlet swirl is
to be used as part of a comprehensive GCI control strategy,
case 1 parameters capture engine response absent of any
changes in intake boost pressure or temperature. As will be
presented, the inlet swirl range investigated resulted in
substantial changes in combustion phasing (CA50). As a result,
these variances necessitated the selection of intake operating
parameters (IMAP and Tin) such that excessive combustion
instability (>3% COV of IMEP) or pressure rise rates (>10 bar/
deg) were avoided. Table 6 shows baseline engine operating
parameters for case 1 experiments (fixed IMAP, Tin, and IMEP).
Table 6. In case 1 experiments, inlet temperature and IMAP remained
fixed at 4 bar net IMEP. Depending on engine speed, inlet temperature
and IMAP differed in order to capture the full range of combustion
phasing for the inlet swirl ratios investigated.
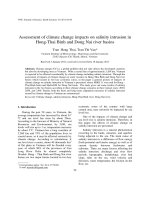
Figure 7. Experimental cylinder pressure and heat release rates for 4
bar net IMEP operation at 1300 RPM given changes in inlet swirl. With
Tin and IMAP fixed at 65C and 130 kPa, respectively, CA50 varies
substantially (∼10 CAD over the inlet swirl range), and advances as
inlet swirl is reduced.
The results of a similar experimental set at 2000 RPM is shown
in Figure 8.
Note at 2000 RPM, due to reductions in both mixing time and
the progression of autoignition chemistry, higher intake
temperature and pressures were required to ensure gasoline
autoignition. For both engine speeds investigated in case 1
experiments, the fuel injection strategy remained fixed, and
consisted of two injections at an injection pressure of 500 bar.
Additionally, 70% of fuel mass was injected early during the
intake stroke (−350° ATDC; also referred to as % premix) with
the remaining 30% of fuel mass injected at −31° ATDC [26, 27].
As shown in Figure 7, at 1300 RPM, the effects on combustion
phasing (and pressure rise rates) due to varying inlet swirl
levels are significant, and indicates in-cylinder temperature
distribution as the dominant process. For example, reducing
the inlet swirl ratio from 2.2 to 1.5 results in the advancement
of CA50 by over 6 CAD (from 6.9° ATDC to 0.6° ATDC). This
advanced, short combustion duration event, results in high
pressure rise rates (10.8 bar/deg) and high NOx emissions (9.1
g/kg-FI), and indicates a hotter, more-thermally homogeneous
mixture distribution prior to ignition, as described by Aceves et
al. [9, 11].
In contrast, increasing inlet swirl from 2.2 to 3.5 was observed
to retard combustion phasing (CA50 retards from 6.9° ATDC to
10.2° ATDC). Pressure rise rates are reduced as well (from 4.3
to 3.2 bar/deg), while combustion duration (in this case,
CA10-75) increases from 8.1 to 10.3 CAD (an increase of
27%). In the case of increasing inlet swirl, these results agree
with previous assessments of increased swirl ratios in LTC
strategies (specifically HCCI). As inlet swirl is increased, heat
Figure 8. Experimental cylinder pressure and heat release rates for 4
bar net IMEP operation at 2000 RPM given changes in inlet swirl. With
Tin and IMAP fixed at 80C and 150 kPa, respectively. Volumetric
efficiency effects are more apparent at the higher engine speed. At
Rs=1.5, cylinder pressure during compression is significantly lower
causing CA50 to retard, relative to Rs=2.2 and 3.5.
Given fixed IMAP and Tin at 2000 RPM, the combustion
phasing variations due to changing inlet swirl are in the
opposite direction as observed at 1300 RPM (see Figure 7 and
Figure 8). Using throttle plates in the intake runner to adjust
inlet swirl levels effectively reduces the volumetric efficiency of
the engine, and these effects figure more prominently at 2000
RPM. For example, at 1300 RPM, reducing swirl from 2.2 to
1.5 results in a reduction of volumetric efficiency from 94.8% to
86.9%. In contrast, at 2000 RPM, the same inlet swirl variation
reduces volumetric efficiency from 94.8% to 74.4%. This
reduction results in a decrease in cylinder pressure (TDC
pressure is reduced from 63.2 bar to 50.8 bar, a 19.6%
reduction) causing CA50 at Rs=1.5 to retard 1.3 CAD (from 8°
to 9.3° ATDC). Increasing Rs from 2.2 to 3.5 causes
combustion phasing to advance 1 CAD (from 8° to 7° ATDC)
and results in higher pressure rise rates as well (3.9 to 5.2 bar/
deg).
Although variations in combustion phasing were observed at
both engine speeds, the results at 2000 RPM were less
significant. While results to be discussed for case 3 (matched
CA50 and Φ) will provide a better understanding of swirl effects
at 2000 RPM, the effects of increasing inlet swirl at 2000 RPM
given fixed IMAP and Tin follow results observed in
conventional diesel combustion; that is, increased swirl
enhances air-fuel mixing and shortens ignition delay.
Figure 9 compares CA50, Φ, and volumetric efficiency as a
function of inlet swirl between the two engine speeds
investigated at 4 bar net IMEP (recall, fueling rate was adjusted
as necessary to maintain constant load).
Interestingly, at 2000 RPM, the variation in CA50 over the swirl
range considered is less than that observed at 1300 RPM.
Specifically, at 1300 RPM, CA50 varies almost 10 CAD (over
the inlet swirl range investigated), as opposed to 2 CAD at
2000 RPM. Regardless of these opposing trends in CA50 at
1300 and 2000 RPM, NOx emission trends are similar, and
appear to be dominated by (and show sensitivity to) local
mixture concentrations, which influences ignition location within
the combustion chamber, and subsequently, peak combustion
temperatures (as will be seen in CFD results, shown Figure
14b and c). For example, although Rs=1.5 causes combustion
phasing to retard at 2000 RPM, NOx emissions remain highest
(as shown in Figure 10); similar to results at 1300 RPM.
Similar NOx trends throughout the swirl range investigated are
observed, i.e., increasing NOx with reduced inlet swirl. UHC
and CO emissions both increase as inlet swirl is increased for
both engine speeds. Specific to UHC trends, increasing inlet
air turbulence appears to result in overly lean regions and
cooler temperatures within the combustion chamber, causing
oxidation kinetics to quench (and corroborated by CFD results).
The CO trends between engine speeds are similar as well;
however, at 2000 RPM, a substantial reduction in CO was
observed (more so than at 1300 RPM) when inlet swirl was
increased from Rs=2.2 to 3.5 (277 to 131 g/kg-FI). CO
emissions for this piston bowl geometry have been shown to
be affected by the ability to promote CO oxidation in the squish
region [28, 29]; this reduction may indicate sufficient local
mixture enrichment in this region.
Figure 9. In a comparison of case 1 experimental results, CA50
exhibits more variation at 1300 RPM than at 2000 RPM. Further, at
1300 RPM, CA50 advances as swirl ratio is reduced; in contrast, at
2000 RPM, CA50 advances (although less) with increased inlet swirl.
Intake throttling resulting from required swirl plate adjustments at
Rs=1.5 and 3.5 reduces volumetric efficiency and effectively creates a
globally-richer mixture concentration.
In order to analyze the in-cylinder combustion behavior with
swirl ratio variation, numerical simulations were performed for
the engine operation at 1300 rev/min.
Figure 11 compares predicted pressure and heat release rate
profiles with measured data. In the figure, predicted (or
calculated) and experimental results are presented with solid
and dashed lines, respectively. It is seen that the change of
pressures during the compression and expansion strokes with
swirl ratio variation is well captured by the prediction. The
predicted ignition timings are in good agreement with
experiments for all three swirl ratios, while pressure rise is
slightly over-predicted for the cases with swirl ratios of 2.2 and
3.5. While experimental heat release is derived from cylinder
pressure data, numerical calculations consist of chemical heat
release only (and absence of wall heat transfer).
Figure 11. Comparison of predicted and measured pressure and heat
release rate profiles for engine operations at 1300 rev/min in Case-1.
Figure 12. Comparison of predicted and measured IMEP and
emissions for engine operations at 1300 rev/min in Case 1. (a) IMEP
and NOx emissions, (b) UHC and CO emissions.
Figure 10. Experimental comparison of emission levels at 4 bar net
IMEP given case 1 operating conditions. NOx trends are similar,
regardless of engine speed, over the inlet swirl range investigated. This
behavior indicates NOx emission rates are dominated by local mixture
concentrations, as opposed to phasing effects (which could increase or
decrease mixing time). UHC emissions increase with increasing inlet
swirl, which could indicate more crevice volume entrapment.
Interestingly, CO emissions for both engine speeds peak at Rs=2.2; at
Rs=1.5, reduced heat transfer (and overall hotter charge) facilitates
more-complete CO oxidation while at Rs=3.5, CO levels are reduced
due to an enrichment of squish region mixture concentration (as will be
shown in CFD results).
The predicted IMEP matched the experimental values of ∼4bar,
and the NOx emissions are in good agreement with measured
data both in trend and quantitatively, as shown in Figure 12a.
UHC emissions are slightly over-predicted, while CO emissions
are significantly over-predicted, as seen in Figure 12b. The
over-prediction of CO emissions is attributed to the
underprediction of CO oxidation during the expansion stroke
after the main ignition (CA >10° ATDC). The first explanation
for this is that while numerical calculations showed higher peak
heat release rates (Figure 11), cumulative heat release was
predicted lower, thus resulting in lower CO oxidation during
piston expansion Secondly, the underpredicted mixing of high
temperature burned gases with unburned charge in the squish
region could be another reason for the numerical results
leading to higher CO emissions. Except for the discrepancy in
CO emissions, the numerical simulations predict the engine
performance and emissions trends quite well.
For the baseline operating conditions (Rs=2.2 in Case 1),
distributions of spray droplet, gas temperature and fuel
equivalence ratio in the cylinder are shown for various crank
angles in Figure 13. The snapshot plots provide a means for
characterizing combustion behavior through temperature and
equivalence ratio distributions along a characteristic plane; in
this case, the spray axis. It is seen in Figure 13a that a small
fraction of spray droplets enter the squish region, and impinge
on the piston-top surface resulting in a thin film of fuel on the
wall. It is also seen that the wall film fuel layer moves in the
direction of in-cylinder swirl during compression. Figure 13b
shows the temperature distribution on the spray axis plane.
The (black) isothermal contour shown in the figure indicates
T=1400 K locations. Ignition is predicted to occur at around +4°
ATDC in the middle of the re-entrant bowl region. High
temperature burned gases are mainly seen in the bowl bottom,
re-entrant and squish regions and move towards the cylinder
liner being convected by the reverse squish flow as the piston
descends. Local maximum gas temperature peaks at slightly
above 2500 K around 10° ATDC (Figure 13d).
Targeting the bowl lip region in the cylinder, the fuel spray is
split between the bowl and squish regions. Due to the
interaction between the squish flow (in the direction of the bowl
center) and the spray-induced flow, the fuel vapor is directed to
the re-entrant region and flows along the bowl surface while
being affected by swirl flow. This helps form charge mixtures
favorable for ignition in the bowl re-entrant region. On the
contrary, the localized wall film fuel forms locally rich regions
near the piston-top surface in the squish region (clearly seen at
TDC in Figure 13c), which burns after the first ignition occurs
(+4° ATDC). Typically, upon ignition, locally rich mixtures serve
to enhance combustion heat release; however, in the squish
region where rich mixtures appear, cooling by evaporation and
wall heat transfer serves to suppress reactions and increase
ignition delay
It is notable that the maximum equivalence ratio in the cylinder
decreases gradually as more mixing of fuel and air evolves
until the ignition timing (see ϕmax values in Figure 13c). Since
the equivalence ratio is calculated using the reactants only, the
equivalence ratio of a local lean/rich mixture approaches zero/
infinite, once ignition occurs. This is why the local maximum
equivalence ratio is seen to increase to ϕmax=2.46 at the timing
of ignition (+4° ATDC) in Figure 13c. Further mixing of burned
gases and unburned mixtures (likely to be lean) increases the
uniformity of the in-cylinder mixtures and maximum
equivalence ratios fall on the lean side (+10° ATDC).
Figure 13. In-cylinder distributions of spray droplets, gas temperature
and equivalence ratio for the simulation baseline operating conditions.
(a) Spray drop distribution at various cranks angles before ignition.
Spray axis planes are plotted for reference. (b) Gas temperature
distributions in the spray axis plane. Iso-contour lines are for 1400 K.
(c) Equivalence ratio distributions in the spray axis plane. Iso-contour
lines are for f=0.5 and local maximum equivalence ratio at each crank
angle is indicated, as well. (d) Profiles of average and local maximum
gas temperatures in the cylinder.
enhanced mixture richness in the squish region before ignition
indicating the potential for improved CO oxidation kinetics (note
Φ=0.5 iso-contour).
As was seen from the pressure profiles (see Figure 7 and
Figure 11), the ignition timings were −2, +4 and + 7° ATDC for
swirl ratios of 1.5, 2.2 and 3.5, respectively. The swirl ratio
change affected the ignition location and the size of ignition
region, as shown in Figure 14c. The ignition location is pushed
towards the bottom of the bowl in the case of Rs=1.5, while the
ignition region extends to the bowl lip region for the case of
Rs=3.5. Due to earlier ignition, burned gas temperatures are
much higher and the high temperature area is much wider in
the case of Rs=1.5 than the other swirl ratio cases at 10°
ATDC. Together with longer time that burned gases reside in
high temperatures, these contribute to the significant increase
of NOx emissions in the case of Rs=1.5 (see Figure 12a).
Due to altered fuel distribution, i.e., increased fuel amount
entering the squish region with a lower swirl ratio), the NOx
emissions distribution and their level are significantly affected.
For the lowest swirl ratio, NOx emissions are mainly formed in
the squish region near the cylinder liner, while local maximum
NOx concentration occurs at the bottom of the bowl in the
highest swirl ratio case. Enhanced uniformity of fuel/air
mixtures in the case of Rs=3.5 reduces the burned gas
temperatures, and thus suppresses NOx formation (Figure
14d).
Figure 14. Comparison of in-cylinder behavior among the three swirl
ratio cases in Case 1. (a) Spray drop distribution at −15° ATDC, (b)
equivalence ratio distributions at crank angle 1-degree before the
ignition timings, (c) gas temperature distributions in the spray axis
plane at ignition timings and 10° ATDC. Local maximum gas
temperatures at 10° ATDC are also indicated. (d) Distributions of NOx
at +15° ATDC.
The effects of swirl ratio variation on combustion behavior and
emissions can be explained by comparison of in-cylinder
distributions of spray droplets, equivalence ratio, gas
temperatures and NOx emissions, as shown in Figure 14. With
a reduced swirl ratio of 1.5, the spray penetrate further and
more fuel enter the squish region forming a larger wall film
(Rs=1.5 in Figure 14a). Reduced swirl flow reduces mixing of
fuel vapor and air, which increases fuel stratification both in the
bowl and squish regions.
Mixing of fuel vapor and air is enhanced by increased swirl,
resulting in more uniform mixtures, which can be seen from the
equivalence ratio distribution before ignition. Figure 14b shows
equivalence ratio distributions in the spray axis plane one
crank angle degree before the ignition timings for the three
swirl ratio cases. It is seen that, in the case of Rs=1.5, rich
regions are more localized and the local maximum equivalence
ratio of the fuel/air mixtures is the highest (ϕmax=1.15) among
the cases. Increased stratification with lower swirl ratio tends to
advance ignition timings. In addition, as observed in both
experiments and computations, CO emissions decreased when
increasing inlet swirl from 2.2 to 3.5; CFD results indicate
Experiments - Case 2
Considering the effect that opening or closing the swirl plates
had on volumetric efficiency, the case 2 experimental
objectives were to match equivalence ratios for the inlet swirl
range investigated (while maintaining fixed IMEP and Tin). In
addition, data were also collected at 8 bar net IMEP.
Results at 4 bar net IMEP, 1300 RPM, are shown in Figure 15.
Figure 15. Swirl effects at 4 bar net IMEP, 1300 RPM experiments, with
matched equivalence ratios. As a result of matching Φ (primarily
through increasing IMAP), Rs=3.5 combustion advances indicating
pressure enhancement of autoignition kinetics. CA50 at Rs=1.5
remains well advanced.
Rs=1.5 retained the significant combustion phasing
advancement, with respect to Rs=2.2 and 3.5, as was seen in
case 1; both pressure rise rates (11.4 bar/deg) and NOx
emissions (12.7 g/kg-FI) remained high for Rs=1.5.
Adjustments in IMAP at Rs=3.5 caused CA50 to advance from
10.2° in case 1 to 7° ATDC, which nearly matches the CA50 at
Rs=2.2 (6.9° ATDC). Although CA50 is matched, combustion
duration (CA10-75) is longer in the higher swirl case (9.3 CAD
vs. 8.1 CAD, or a 14.8% increase), perhaps indicating greater
temperature heterogeneity. This larger temperature distribution
may create a staged combustion event as ignition begins in the
hottest region and proceeds to the next hottest, and so on [9].
At 2000 RPM, adjustments in IMAP to match Φ cause CA50 for
both Rs=1.5 and 3.5 to advance, as shown in Figure 16,
indicating pressure enhancement of autoignition kinetics.
Figure 17. First law energy accounting compares fuel energy pathways
for Rs=1.5 and 3.5 at 4 bar net IMEP, 2000 RPM. Although CA50 is
within 0.5 CAD, turbulent enhancement of heat transfer at Rs=3.5
primarily contributes to a 4-point reduction in gross ITE.
Increasing load at 2000 RPM from 4 to 8 bar net IMEP reveals
similar trends to those at 4 bar net IMEP, as shown in Figure
18. For this case, EGR was utilized (13.65% inlet O2
concentration) for both NOx emission reductions (specifically,
to keep NOx below 0.5 g/kg-FI) and phasing control (to keep
PRR <10 bar/deg).
Figure 16. Inlet swirl effects at 4 bar net IMEP, 2000 RPM experiments,
with matched equivalence ratios. CA50 at Rs=3.5 remains advanced of
Rs=2.2; however, Rs=1.5 results indicate a significant advancement of
CA50. Similar to results at 1300 RPM, increasing IMAP to match Φ
causes an enhancement of autoignition kinetics resulting in reduced
ignition delay.
At Rs=1.5, IMAP was increased to 188 kPa, and 170 kPa at
Rs=3.5 (both from a baseline IMAP of 150 kPa). CA50 for
these two cases are within 0.5 CAD (2.4° ATDC at Rs=1.5; 2.9°
ATDC at Rs=3.5), and further analysis of heat release rates
show similar early heat release rates; however, the peak heat
release rate at Rs=1.5 is 93.9 J/deg (vs. 82.7 J/deg at Rs=3.5),
and the latter heat release appears to extend longer in the high
swirl case. These results again indicate that, given equivalent
combustion phasing, greater in-cylinder turbulence (due to
higher inlet swirl) enhances heat transfer creating a cooler,
more temperature-stratified charge.
A simple, first law energy accounting balance provides
additional insight, as shown in Figure 17. The heat transfer
increases at the higher swirl condition by 7.6-percentage
points. Although combustion efficiencies are similar (91.5% vs.
90.2%), increased heat transfer at Rs=3.5 is the primary
contributor to the reduction in gross indicated thermal
efficiency.
Figure 18. Inlet swirl effects at 8 bar net IMEP, 2000 RPM experiments
(with 13.65 % inlet O2 concentration), and shows similar results to 4
bar net IMEP operation. Specifically, between 4 and 8 bar net IMEP, at
2000 RPM, inlet swirl effects are similar, which indicates inlet air
turbulence levels established by varying swirl are dominating
combustion phasing (as opposed to increases in Φ with increasing
load).
At 8 bar net IMEP, with fixed equivalence ratio (Φ=0.77), both
reducing and/or increasing inlet swirl has an advancing effect
on combustion phasing. In the former case, when reducing
inlet swirl from Rs=2.2 to 1.5, combustion phasing advanced
from 19.5° to 10.1° ATDC due to a reduction in heat transfer
and subsequent increase in overall in-cylinder temperatures. In
the latter case of increased inlet swirl (from Rs=2.2 to 3.5),
CA50 again advances (from 19.5° to 8.8° ATDC) indicating
enhanced mixing (or fuel enrichment) in the squish region,
which serves to reduce ignition delay. In the absence of higher
in-cylinder temperatures (e.g. Rs=1.5) or enhanced mixing
(e.g. Rs=3.5), combustion phasing at Rs=2.2 retards
significantly into the expansion stroke (although combustion
efficiency is 89.9%, or ∼6 percentage points lower than the
other two cases).
Figure 19 compares the case 2 emissions at 4 bar net IMEP
between the two engine speeds investigated (case 1 emissions
are shown for comparison as well with dashed lines, and are
very similar in trend and magnitude).
advanced with respect to Rs=2.2). As noted previously in, a
reduction in inlet swirl causes an overall increase in
temperature due to reduced heat transfer, thus enhancing
autoignition kinetic rates. In contrast, observe in Figure 19, how
CO emissions significantly reduce at Rs=3.5 relative to the
baseline swirl case. Although heat transfer appears to
significantly increase due to enhanced turbulence in the
near-wall region (or squish region), this enhanced mixing may
serve to richen the squish region resulting in advanced
combustion.
Figure 20. Comparison of predicted and measured pressure profiles,
and IMEP and NOx emissions for engine operations at 1300 rev/min in
Case-2. (a) pressure profiles, (b) IMEP and NOx emissions.
Figure 19. Given matched Φ, emission trends (solid lines) match those
observed in case 1 experiments (dashed lines). NOx emissions reveal
negligible sensitivity to global equivalence ratio, indicating local mixture
concentration levels are dominating. Both UHC and CO emissions
reveal negligible changes as well in going from case 1 to case 2
conditions (again, adjusting IMAP to match global Φ)
Even with fixed equivalence ratios, CA50 still exhibits
considerable variation as a function of swirl ratio, regardless of
speed. Additionally, at fixed equivalence ratios and 2000 RPM,
Rs=3.5 exhibits similar behavior to Rs=1.5 (i.e., CA50 is
Numerical simulations for engine operation at 1300 rev/min in
Case 2 could capture the experimental pressure profiles of the
three swirl ratio cases quite well, as shown in Figure 20a. To
match overall equivalence ratio, the intake manifold pressures
were increased for Rs=1.5 and 3.5 cases, and thus
compression and expansion pressure profiles were raised to
be slightly higher than that of Rs=2.2 case. The IMEP was
reasonably well matched to the experimental value except that
the Rs=3.5 case is slightly over-predicted. The NOx emissions
trend is also well captured (see Figure 20b).
Experiments - Case 3
Case 3 represents attempts to assess how much temperature
reduction is required at Rs=1.5 to match CA50 at Rs=2.2.
Further, at this reduced temperature, an investigation
assessing the capability of fuel injection strategy to minimize
NOx emissions (for the Rs=1.5 condition, specifically) was
explored as well. Figure 22 shows the resulting changes in
operation due to varying swirl ratio, with fixed equivalence ratio
(Φ=0.29), CA50 (4.5° ATDC), and load at 1300 RPM (note fuel
injection strategy remains fixed as well i.e. 70% premix fuel
with a second injection at −31° ATDC).
Figure 21. Comparison of in-cylinder behavior among the three swirl
ratio cases in Case 2. (a) Spray drop distribution at −15° ATDC, (b) gas
temperature distributions in the spray axis plane at ignition timings and
10° ATDC. Local maximum gas temperatures at 10° ATDC are also
indicated. (c) Distributions of NOx at +15° ATDC.
When matching the overall equivalence ratio for the three swirl
ratios, the spray droplet distributions were not seen to be
affected much, as shown in Figure 21a, although the total
evaporation was slightly increased by enhanced spray breakup
due to ambient pressure increase. Enhanced evaporation
resulted in the advancement of ignition timings in Rs=1.5 and
3.5 cases compared to those in Case 1 (see Figure 21b). The
ignition locations were predicted to be quite similar to those in
Case 1. With increased swirl ratio, the first ignition tends to
occur at the bottom of the bowl, while the ignition location
moves towards the bowl lip region with decreasing swirl ratio. It
is seen in Figure 21b that the area of the high temperature
burned region is much wider in Rs=1.5 case compared to the
other cases. As in Case1, the high temperature area extends
to most of the squish region, while it is limited to the squish
region near the bowl lip in the other two cases.
As expected from the temperature distributions in Figure 21b, it
is seen that NOx mainly forms in the squish region due to the
burning of squish-entering spray fuels in the Rs=1.5 case
(Figure 21c). Similar behavior is seen for Rs=2.2 case, but the
NOx formation rate is relatively low due to enhanced mixing
and increased fuel amount entering the bowl region with
increasing swirl ratio. In the Rs=3.5 case, the residence time
for NOx formation after ignition is similar to that of Rs=2.2.
However, due to enhanced mixing of fuel and air, local
maximum burned gas temperatures are low enough to
suppress NOx formation, resulting in slightly lower level of NOx
emissions than the Rs=2.2 case.
Figure 22. Both inlet temperature and IMAP were adjusted to match
CA50 and Φ for all swirl ratios investigated for 4 bar net IMEP, 1300
RPM experiments.
Although net IMEP is matched at all swirl ratios (as opposed to
gross IMEP, which only considers P-V work during the
compression and expansion strokes), the cylinder pressure for
Rs=2.2 is lower in the CAD range shown due to less pumping
work during the intake and exhaust strokes compared to
Rs=1.5 and Rs=3.5 (where pumping work increased 38% and
19%, respectively). Continuing, with matched CA50 and
equivalence ratio, the inlet temperature at Rs=1.5 was 52C,
compared to 77C at Rs=2.2. And due to increased NOx
emissions at Rs=1.5 (as discussed previously), the injection
strategy was modified slightly by increasing % premixture from
70% to 80% to reduce NOx to less than 1 g/kg-FI (specifically,
0.76 ±0.12 g/kg-FI, or 9.3 ppm NOx). By roughly estimating
frictional losses of 0.8 bar FMEP in a multi-cylinder engine,
0.76 g/kg-FI is approximately 0.21 g/kWh for this condition,
which is below the US 2010 NOx emission standard (0.27 g/
kWh).
Further, the changes in Tin and IMAP required at 2000 RPM
were similar for Rs=1.5; however, combustion phasing
advancement effects at Rs=3.5 required greater reductions in
intake temperature than those observed at 1300 RPM (as
shown in Figure 23). Recall, inlet temperature reductions are
required due to simultaneous increases in inlet pressure, IMAP,
(which were required to match Φ).
The CA50 advancement at Rs=3.5 was such that the intake
temperature had to be reduced 20C to match baseline CA50
levels (8° ATDC). Lastly, regardless of engine speed and inlet
swirl level (with respect to Rs=2.2), intake throttling required
increases in IMAP to match global equivalence ratios.
In closing the experimental results discussion, first law energy
accounting comparing 4 bar net IMEP operation at 1300 and
2000 RPM for the matched CA50 and Φ can provide additional
insight (as shown in Figure 24)
Figure 23. With Rs=2.2. serving as the baseline condition, matching
CA50 and Φ for case 3 experiments (4 bar net IMEP) required inlet
temperature (black colored bars) and IMAP (red colored bars)
adjustments at Rs=1.5 and 3.5. Regardless of swirl ratio, and due to
throttling effects, IMAP was increased to match Φ, and inlet
temperature was reduced to match CA50. At Rs=1.5, regardless of
engine speed, intake temperatures were reduced 25C. At Rs=3.5,
1300 RPM, a 1C reduction in Tin was required, while 2000 RPM (and
indicating the advancing effect of higher swirl at 2000 RPM), Tin was
reduced 20C from baseline.
The first law analysis suggests substantial effects on heat
transfer result from varying inlet swirl due to turbulence
enhancement. These heat transfer effects are the primary
contributor to changes in thermal efficiency, and fuel
consumption; decreases in heat transfer due to decreasing
inlet swirl increase efficiency (e.g., gross ISFC decreases with
decreasing inlet swirl from 218.1 to 189.7 g/kWh at 1300 RPM;
and 206.5 to 186.3 g/kWh at 2000 RPM). Also, at 2000 RPM,
note the overall reduction in heat transfer as compared to
cases at 1300 RPM, which is due to reduced wall exposure
time at the higher engine speed. And due to fixed combustion
phasing (and similar injection strategies), combustion
inefficiencies in all three cases are relatively constant.
Figure 24. A comparison of first law energy accounting at 1300 and
2000 RPM considering matched CA50 and Φ. Regardless of engine
speed, heat transfer increases with increasing inlet swirl levels, and
gross ITE decreases. Note combustion inefficiencies remain relatively
constant as inlet swirl is adjusted. It should also be noted that injection
strategy was not optimized to reduce combustion inefficiencies, yet
gross ITE values are approaching 45% at the lowest swirl condition.
Figure 25. Comparison of predicted and measured pressure profiles,
and IMEP and NOx emissions for engine operations at 1300 rev/min in
Case 3. (a) pressure profiles, (b) IMEP and NOx emissions.
The predicted pressure profiles for Case 3 operation are
compared with measured data in Figure 25a. Reduced intake
temperature in the Rs=1.5 case helped retard ignition timing in
the simulation, although the amount of retardation was not as
substantial as the experiments, compared to the other cases.
The slightly earlier ignition contributes to the overprediction of
NOx emissions in the Rs=1.5 case than the other swirl ratio
cases, as shown in Figure 25b.
Although the ignition timings of the three swirl cases were
similar, their ignition locations were still significantly affected by
the swirl flow, as was in Case 1 and Case 2. It is interesting
that ignition first occurs in the squish region in the Rs=1.5
case, while it occurs in the bowl region in the other swirl ratio
cases. With the intake gas temperature lowered by 13°C, the
ignition delay in the Rs=1.5 case is increased and more time is
available for the fuel entering the squish region to vaporize and
mix with the air. This develops mixtures favorable for ignition in
the squish region. The area and distribution of high
temperature regions at 10° ATDC are seen to be similar in the
three swirl ratio cases (Figure 26c). However, the local
maximum temperature is the highest in the Rs=1.5 case due to
the highest stratification of the fuel, which contributes to the
highest NOx emissions. The location of high NOx concentration
region is affected by the swirl ratio change; the squish region in
Rs=1.5 case, and the bowl bottom region in Rs=3.5 case, as
shown in Figure 26d.
Comments on NOx Emissions
In the Case 1 and 2 studies (e.g., 4 bar net IMEP at 1300
RPM), a reduction in inlet swirl to Rs=1.5 caused NOx
emissions to increase, as shown in Figure 27a.
Figure 26. Comparison of in-cylinder behavior among the three swirl
ratio cases in Case 3. (a) Spray drop distribution at −15° ATDC, (b)
equivalence ratio distributions at TDC. Iso-contours are for Φ=0.5. (c)
gas temperature distributions in the spray axis plane at ignition timings
and 10° ATDC. Local maximum gas temperatures at 10° ATDC are
also indicated. (d) Distributions of NOx at +15° ATDC.
As in Case 1 and Case 2, the spray droplet distributions in the
cylinder at −15° ATDC are significantly affected by swirl ratio
change i.e., as swirl ratio is increased, less fuel spray enters
the squish region (with more entering the bowl region), as
shown in Figure 26a. Enhanced mixing of fuel and air can be
confirmed from the fuel distribution in the axis plane. It is seen
in Figure 26b that fuel is distributed in a wider range with
increased swirl ratio, reaching the bowl bottom region in the
Rs=3.5 case. The local maximum equivalence ratio (numbers
in the figures) at TDC is the lowest at ϕmax=0.86 in the highest
swirl case, which indicates that the entire in-cylinder mixture is
lean.
Figure 27. With fixed injection strategies in Case 1 and 2 experiments,
Rs=1.5 resulted in excessive NOx emissions. In Case 3 experiments,
injection strategy was altered to demonstrate effective emission
reduction capabilities with minor adjustments in fuel injection
parameters (bottom chart)
However, these large increases in NOx emissions could be
mitigated by employing small adjustments in the fuel injection
strategy (see Figure 27b). The required small adjustments
(specifically, increasing % premix fuel from 70% to 80% along
with an advancement of SOI2 from −31° to −35° ADTC) in
fueling offers insight into the effect that the local mixture
concentration has on NOx formation rates. Further, the ability
to effectively reduce NOx emissions in a GCI strategy with
minimal input warrants the pursuit of variable inlet swirl as a
control strategy to control combustion phasing without adverse
effects on engine-out NOx emissions. Of course, as premix fuel
amounts increase, CO and UHC emissions increase with
increasing fuel amounts entering crevice volume regions. To
mitigate this trade-off, future work hopes to explore piston
geometry shapes more-optimally designed for GCI operation.
Summary/Conclusions
The results presented within this paper are significant from a
potential engine controls standpoint. Throughout this research
[20, 26, 27, 30], regardless of operating point (load or speed),
a primary objective has been to maintain perspective related to
the transition of GCI operation from the laboratory to the real
world. In particular, the operating strategies considered to
maintain a robust system must be realistically feasible, i.e., the
strategies must possess fast response (on the order of single
engine cycles). Varying inlet swirl may offer the operator a
fast-response control variable that significantly impacts
combustion phasing. Considering the optimal CA50 range
discussed in previous research (maintaining acceptable
PRR<8 bar/deg; and stability, or %COV of net IMEP less than
3% with CA50 between 6° and 11° ATDC [27]) in the low/
medium load regime, variable inlet swirl offers the potential to
effectively mitigate large variations in inlet temperature (e.g.,
cold starts, traversing mountain passes, etc.) for GCI.
Additionally, any adverse effects in NOx emissions due to
combustion phasing advance can successfully be reduced
through small adjustments in injection strategy (e.g. more
premix fuel).
Experiments assessing the effects of inlet swirl in GCI
operating modes provided a number of interesting results:
1. In this light duty engine application, varying the inlet swirl
ratio had significant effects on combustion phasing, or
CA50. For example, under fixed Tin and IMAP at 1300 RPM,
CA50 advanced nearly 10 CAD with reductions in inlet
swirl (from Rs=3.5 to 1.5). In contrast, at 2000 RPM, CA50
retarded ∼2 CAD with reductions in inlet swirl.
2. Throttling effects due to changing swirl plate positions are
larger at 2000 RPM. For example, at Rs=1.5, TDC pressure
decreased 12 bar compared to Rs=2.2
3. Regardless of engine speed, emission trends were similar
in case 1 and case 2 studies. NOx emissions increased
significantly by over one order of magnitude at Rs=1.5, while
CO emissions are highest in the baseline Rs=2.2 condition.
First law accounting indicated heat transfer decreased with
decreasing inlet swirl; thus contributing to higher combustion
temperatures, and higher NOx emissions. CFD simulations
confirmed these results by showing larger high temperature
zones within the combustion temperature.
4. With excessive NOx emission concerns in case 1 and
case 2 at Rs=1.5, case 3 experiments showed the ability to
make significant reductions in NOx emissions (from 2.4 g/
kg-FI to 0.76 g/kg-FI at 1300 RPM) with minor adjustments
in injection strategy. Further, Rs=1.5 provided the best
performance with respect to gross ITE and ISFC (44% and
189.7 g/kWh at 1300 RPM, for example) resulting from less
heat transfer of fuel energy. CFD solutions confirmed higher
in-cylinder temperatures at ignition, compared to Rs=2.2
and 3.5. In addition, intake temperature requirements (at
both 1300 and 2000 RPM) were 25C lower than baseline
(Rs=2.2).
CFD solutions at 1300 RPM showed good agreement with
experimental results for all test cases. And as was shown in
first law energy accounting (with the experimental data), the
CFD results validated that the primary factor in CA50 variations
with changing inlet swirl results from bulk temperature changes
of the in-cylinder charge (and thus changes in heat transfer).
Bulk gas temperature changes dominate phasing effects; in
contrast, local mixture concentrations due to enhanced swirl (or
less) influence emissions.
References
1. Conti, J., and Holtberg, P., 2011, “International Energy
Outlook 2011,” U.S. Energy Information Administration.
2. Onishi, S., Jo, S., Shoda, K., Jo, P. et al., “Active ThermoAtmosphere Combustion (ATAC) - A New Combustion
Process for Internal Combustion Engines,” SAE Technical
Paper 790501, 1979, doi:10.4271/790501.
3. Najt, P. and Foster, D., “Compression-Ignited
Homogeneous Charge Combustion,” SAE Technical Paper
830264, 1983, doi:10.4271/830264.
4. Christensen, M. and Johansson, B., “Influence of Mixture
Quality on Homogeneous Charge Compression Ignition,”
SAE Technical Paper 982454, 1998, doi:10.4271/982454.
5. Christensen, M. and Johansson, B., “Supercharged
Homogeneous Charge Compression Ignition (HCCI) with
Exhaust Gas Recirculation and Pilot Fuel,” SAE Technical
Paper 2000-01-1835, 2000, doi:10.4271/2000-01-1835.
6. Noda, T. and Foster, D., “A Numerical Study to Control
Combustion Duration of Hydrogen-Fueled HCCI by Using
Multi-Zone Chemical Kinetics Simulation,” SAE Technical
Paper 2001-01-0250, 2001, doi:10.4271/2001-01-0250.
7. Sjöberg, M., Edling, L., Eliassen, T., Magnusson, L. et al.,
“GDI HCCI: Effects of Injection Timing and Air Swirl on Fuel
Stratification, Combustion and Emissions Formation,” SAE
Technical Paper 2002-01-0106, 2002, doi:10.4271/200201-0106.
8. Aroonsrisopon, T., Werner, P., Waldman, J., Sohm, V.
et al., “Expanding the HCCI Operation With the Charge
Stratification,” SAE Technical Paper 2004-01-1756, 2004,
doi:10.4271/2004-01-1756.
9. Sjöberg, M., Dec, J., Babajimopoulos, A., and Assanis,
D., “Comparing Enhanced Natural Thermal Stratification
Against Retarded Combustion Phasing for Smoothing of
HCCI Heat-Release Rates,” SAE Technical Paper 2004-012994, 2004, doi:10.4271/2004-01-2994.
10.Miles, P., “The Influence of Swirl on HSDI Diesel
Combustion at Moderate Speed and Load,” SAE Technical
Paper 2000-01-1829, 2000, doi:10.4271/2000-01-1829.
11.Aceves, S., Flowers, D., Martinez-Frias, J., Smith, J. et al.,
“A Sequential Fluid-Mechanic Chemical-Kinetic Model of
Propane HCCI Combustion,” SAE Technical Paper 200101-1027, 2001, doi:10.4271/2001-01-1027.
12.Christensen, M. and Johansson, B., “The Effect of InCylinder Flow and Turbulence on HCCI Operation,” SAE
Technical Paper 2002-01-2864, 2002, doi:10.4271/200201-2864.
13.Amsden, A., 1999, “KIVA-3V, Release 2, Improvements to
KIVA-3V.”.
14.Kee, R. J., Rupley, F. M., and Miller, J. A., 1989,
“CHEMKIN-II: A FORTRAN Chemical Kinetics Package
for the Analysis of Gas Phase Chemical Kinetics,” Sandia
Report.
15.Beale, J. C., and Reitz, R. D., 1999, “Modeling Spray
Atomization with the Kelvin-Helmholtz/Rayleigh-Taylor
Hybrid Model,” Atomization and Sprays, 9, pp. 623-650.
16.Liu, A., Mather, D., and Reitz, R., “Modeling the Effects of
Drop Drag and Breakup on Fuel Sprays,” SAE Technical
Paper 930072, 1993, doi:10.4271/930072.
17.Ra, Y., and Reitz, R., 2009, “A Vaporization Model for
Discrete Multi-component Fuel Sprays,” International
Journal of Mutliphase Flow, 35, pp. 101-117.
18.O'Rourke, P. and Amsden, A., “A Particle Numerical Model
for Wall Film Dynamics in Port-Injected Engines,” SAE
Technical Paper 961961, 1996, doi:10.4271/961961.
19.Han, Z., and Reitz, R. D., 1995, “Turbulence Modeling of
Internal Combustion Engines Using RNG k-e Models,”
Comb. Sci. Tech., 106, pp. 267-295.
20.Ra, Y., Loeper, P., Reitz, R., Andrie, M. et al., “Study of
High Speed Gasoline Direct Injection Compression Ignition
(GDICI) Engine Operation in the LTC Regime,” SAE Int. J.
Engines 4(1):1412-1430, 2011, doi:10.4271/2011-01-1182.
21.Ra, Y., and Reitz, R., 2008, “A Reduced Chemical Kinetic
Model for IC Engine Combustion Simulations with Primary
Reference Fuels,” Combustion and Flame, 155, pp. 713738.
24.Fieweger, K., Blumenthal, R., and Adomeit, G., 1997,
“Self-Ignition of S.I. Engine Model Fuels: A Shock Tube
Investigation at High Pressure,” Combustion and Flame,
109, pp. 599-619.
25.Hiroyasu, H. and Kadota, T., “Models for Combustion
and Formation of Nitric Oxide and Soot in Direct Injection
Diesel Engines,” SAE Technical Paper 760129, 1976,
doi:10.4271/760129.
26.Loeper, P., 2013, “Experimental Investigation of Gasoline
Compression Ignition (GCI) Combustion in a Light Duty
Diesel Engine,” PhD, University of Wisconsin.
27.Loeper, P., Ra, Y., Adams, C., Foster, D. et al.,
“Experimental Investigation of Light-Medium Load
Operating Sensitivity in a Gasoline Compression Ignition
(GCI) Light-Duty Diesel Engine,” SAE Technical Paper
2013-01-0896, 2013, doi:10.4271/2013-01-0896.
28.Opat, R., Ra, Y., Gonzalez D., M., Krieger, R. et al.,
“Investigation of Mixing and Temperature Effects on HC/CO
Emissions for Highly Dilute Low Temperature Combustion
in a Light Duty Diesel Engine,” SAE Technical Paper 200701-0193, 2007, doi:10.4271/2007-01-0193.
29.Koci, C., Ra, Y., Krieger, R., Andrie, M. et al., “MultipleEvent Fuel Injection Investigations in a Highly-Dilute
Diesel Low Temperature Combustion Regime,” SAE Int. J.
Engines 2(1):837-857, 2009, doi:10.4271/2009-01-0925.
30.Ra, Y., Loeper, P., Andrie, M., Krieger, R. et al., “Gasoline
DICI Engine Operation in the LTC Regime Using TriplePulse Injection,” SAE Int. J. Engines 5(3):1109-1132, 2012,
doi:10.4271/2012-01-1131.
Definitions/Abbreviations
ATDC - After top dead center
CA50 - Crank angle of 50% fuel mass burn fraction
COV - Coefficient of variation
DI - Direct injection
EGR - Exhaust gas recirculation
GCI - Gasoline compression ignition
HCCI - Homogeneous charge compression ignition
IC - Internal combustion
IMAP - Intake manifold absolute pressure
IMEP - Indicated mean effective pressure
22.Hessel, R., Foster, D., Aceves, S., Davisson, M. et al.,
“Modeling Iso-octane HCCI Using CFD with Multi-Zone
Detailed Chemistry; Comparison to Detailed Speciation
Data Over a Range of Lean Equivalence Ratios,” SAE
Technical Paper 2008-01-0047, 2008, doi:10.4271/200801-0047.
ISFC - Indicated specific fuel consumption
23.Genzale, C., Reitz, R., and Musculus, M., “Effects of
Piston Bowl Geometry on Mixture Development and LateInjection Low-Temperature Combustion in a Heavy-Duty
Diesel Engine,” SAE Int. J. Engines 1(1):913-937, 2008,
doi:10.4271/2008-01-1330.
PRR - Pressure rise rate
LTC - Low temperature combustion
NOx - Nitrogen oxides
PCCI - Premixed charge compression ignition
PPC - Partial premixed charge
SOIC - Start of injection command
TDC - Top dead center
UHC - Unburned hydrocarbons
The Engineering Meetings Board has approved this paper for publication. It has successfully completed SAE’s peer review process under the supervision of the session
organizer. The process requires a minimum of three (3) reviews by industry experts.
All rights reserved. No part of this publication may be reproduced, stored in a retrieval system, or transmitted, in any form or by any means, electronic, mechanical,
photocopying, recording, or otherwise, without the prior written permission of SAE International.
Positions and opinions advanced in this paper are those of the author(s) and not necessarily those of SAE International. The author is solely responsible for the content of the
paper.
ISSN 0148-7191
/>