INVESTIGATING POSSIBLE IMPACT OF UPSTREAM DEVELOPMENT SCENARIOS ON THE FLOW REGIME AND SALINITY INTRUSION IN THE DRY SEASON IN THE MEKONG DELTA, VIETNAM
Bạn đang xem bản rút gọn của tài liệu. Xem và tải ngay bản đầy đủ của tài liệu tại đây (2.97 MB, 31 trang )
Header Page 1 of 89.
MINISTRY OF EDUCATION AND TRAINING
VIETNAM ACADEMY FOR WATER RESOURCES
SOUTHERN INSTITUTE OF WATER RESOURCES RESEARCH
--------------------
TO QUANG TOAN
INVESTIGATING POSSIBLE IMPACT OF UPSTREAM
DEVELOPMENT SCENARIOS ON THE FLOW REGIME
AND SALINITY INTRUSION IN THE DRY SEASON IN THE
MEKONG DELTA, VIETNAM
Major: Water Resources Engineering
Code : 62 58 02 12
SUMMARY OF DOCTORIAL THESIS IN ENGINEERING
HOCHIMINH CITY - 2015
Footer Page 1 of 89.
Header Page 2 of 89.
The research has been accomplished at:
Southern Institute of Water Resources Research
Supervisor:
Prof. Dr. Tang Duc Thang
Examiner 1: Assoc. Prof. Dr. Le Van Nghi
Examiner 2: Assoc. Prof. Dr. Nguyen Ba Quy
Examiner 3: Assoc. Prof. Dr. Huynh Thanh Son
This thesis to be defended at the committee of doctorial thesis
examiners, at:
Southern Institute of Water Resources Research
658. Vo Van Kiet Blvd., Ward 01, District 5, Hochiminh city
at 08:00AM, Date 24th January 2015
This thesis can be found at:
-
Vietnam National Library.
-
Library of Vietnam Academy for Water Resources.
-
Library of Southern Institute of Water Resources Research.
Footer Page 2 of 89.
Header Page 3 of 89.
-1INTRODUCTION
0.1. THE URGENCY OF THE THESIS
The Mekong Delta plays a very important role in social and
economic development in Vietnam, especially for food security. It
has been developing very fast, in 1985 total food production
achieved 6.3 million tons, in 2011 it achieved 23.4 million tons,
contributing more than 50% of food production of the whole country,
90% of exported rice production. More than 70% of exported
aquaculture products and about 55% of exported fruit come from the
delta.
Sustainable development of the Mekong Delta has been
threatened by development in the upstream which changes the flow
into the plain in both flood season and dry season, especially a
change in the salinity intrusion in dry season resulting in a change in
the source of water which affects people’s livelihood, agricultural
production (crop pattern, area, yield and production), aquaculture
products and other activities.
In the past time, there were a lot of researches on salinity
intrusion in Mekong Delta in which they concentrated mainly on
monitoring and evaluating the changes of salinity intrusion according
to hydrological and meteorological conditions; calculation for water
resources planning, systematic design and water resources
management. These activities had important contributions to
irrigational development in the Mekong Delta, preventing and
controlling saline water and reserving fresh water for social and
economic development.
Most calculations of salinity intrusion in the country are based
on design probability standards (flow, tide, water use) or on typical
years, therefore, they are still limited very much, the impacts from
the upstream to the Mekong Delta have not been considered in
immediate, short-term or long-term cases. One of reasons leading to
the above-mentioned shortcomings is a lack of tools to evaluate these
impacts.
Footer Page 3 of 89.
Header Page 4 of 89.
-2-
Recently the researches of International Mekong River
Commission have taken into account the upstream development,
their impacts in a ranger of typical hydrological conditions were
evaluated, However, these are only the initial researches which have
just evaluated the overview of the influence of the upstream
development, especially not yet evaluated the different aspects of
hydroelectric development, not yet evaluated in detail the influence
of the development of every country on a change in the flow and
salinity intrusion in Mekong Delta. For that very reason, the
reliability of the results of calculation and evaluation of these
researches are still much limited. In addition, solutions adjusting to a
change in the upstream in Mekong Delta have not been cared
considerably.
The above-mentioned analyses show the sustainable
development of economy and society in Mekong Delta requires more
adequate researches on the upstream, especially on a change in the
flow by the impacts of agricultural and hydroelectric development as
a basis for proposing solutions adapting to changes. These are
reasons for the research of this thesis topic.
0.2. PURPOSE OF THESIS
The purpose of the thesis topic is to advance reliably scientific
evaluations on the capacity of water source in dry season and the
salinity intrusion change in Mekong Delta for the target of
sustainable agricultural development in the context of (hydroelectric
and agricultural) development in the upstream in the future.
0.3. OBJECT, SCOPE AND AIM OF RESEARCH
Research objects: Reservoirs, hydroelectric reservoirs on the
basin and irrigational system in the upstream of Mekong River. The
system of irrigational structures in Mekong Delta: salinity intrusion
prevention and irrigation culverts; the river systems, irrigating and
draining canals; the system of dike and embankment.
Scope: Regarding space: research topic on the basin of
Mekong River. Regarding research problems: impacts on the flow in
Footer Page 4 of 89.
Header Page 5 of 89.
-3-
dry season on Mekong Delta according to the scenarios of
development in the upstream which are limited to hydroelectric and
agricultural development including Chinese hydroelectricity and the
hydroelectricity of main tributaries in the downstream as proposed
plan. In Mekong Delta, restriction to the research is a change in the
flow into the plain and a change in the development of salinity
intrusion due to upstream development. The boundary of sea tide is
taken in the same condition as it was in 2005, this is considered as a
typical year near to the present conditions (which have been chosen
by many recent researches). Regarding adaptation solutions, the main
interest in this thesis is water resources solutions for preventing
salinity intrusion and guaranteeing the source of water.
The aim of research is to evaluate hydrological changes of
historical flow (past to present) and near future (by hydroelectric and
agricultural development in the upstream) and their impact, from that
point, orientation and adaptation (irrigational) solutions are proposed
for agricultural development production in Mekong Delta.
0.4. PRACTICAL AND SCIENTIFIC SIGNIFICANCE
Scientific significance
The scientific significance of the research is to solve the
outstanding problems scientifically for sustainable agricultural
development in the Mekong Delta. A set of tools is set up for
scientific research and water management supporting to agricultural
production, which help to forecast the flow of dry season and salinity
intrusion.
Practical significance
The thesis has practical significance for the work of planning,
research concerning water resources and environmental protection,
serving practically agricultural production (forecasting salinity
intrusion, seasonal arrangement, water management), helping to
make relevant decisions. A set of tools is applied to forecast salinity
intrusion in severe drought years 2010 and 2013.
Footer Page 5 of 89.
Header Page 6 of 89.
-4-
0.5. STRUCTURE OF THESIS
The thesis is presented in 140 pages including 28 figures, 34
tables and interpretational pages. The main contents of the thesis
include 3 main chapters and conclusion. Chapter1: Overview of
research problems: Mekong river basin, existed related researches
and identified the contents of the research; Chapter 2: Research on
the impacts of the abilities of the upstream development on the flow
regime into Mekong Delta; Chapter 3: Research on the impacts of
the abilities of the upstream development on the flow and salinity
intrusion in Mekong Delta and adaptation solutions; Conclusion and
recommendation of the thesis: Some main results have newness and
the recommendations of the thesis have been advanced.
CHAPTER 1
OVERVIEW OF RESEARCH PROBLEMS: MEKONG RIVER
BASIN, RELATED EXISTING RESEARCHES AND THE
IDENTIFIED CONTENTS OF THE RESEARCH.
1.1. OVERVIEW OF MEKONG RIVER BASIN
Mekong River basin has total area of 795,000 km2 and annual
total flow of approximately 475 billion m3, flowing through the
territories of 6 countries: China, Myanmar, Laos, Thailand,
Cambodia and Vietnam (see Table 1.1). The river has total length of
main stream of more than 4,800 km in which the part of river
through 2 upstream countries is about 2,100 km long. The upstream
of Mekong Delta is the basin from China and extended to Kratie (the
starting point of Mekong Delta). The upstream of Mekong Delta of
Vietnam is understood as the basin from China spreading to the
border of Vietnam and Cambodia.
Tonle Sap in Cambodia is considered as a natural lake which
plays a very important role in regulating the flow into the
downstream of the plain in both flood and dry season. Every year the
lake supplies to the downstream about 40-80 billion m3 water in
Footer Page 6 of 89.
Header Page 7 of 89.
-5-
which about 50% water discharge is obtained thanks to regulation
from the flood flow of Mekong River.
Table 1.1: Area and contribution of flow from countries
No
.
Name of
country
Area in
the basin
(Km2)
1
2
3
4
5
6
China
Myanmar
Laos
Thailand
Cambodia
Vietnam
Total area:
165,000
24,000
202,000
184,000
155,000
65,000
795,000
%
compared
with the
area of the
basin
21
3
25
22
20
9
100
% compared
with the area
of the
country
97
36
86
20
Total flow:
%
contribution
of flow
16
2
35
18
18
11
475 km3
(Source : International Mekong River Commission - MRC, 2003)
1.2.
STATUS QUO, DEVELOPMENT ABILITIES IN THE
MEKONG RIVER BASIN AND MAJOR CONCERN IN
MEKONG DELTA
There is a very huge potentiality of land which has ability to
adjust to agricultural development in the upstream with total area of
4 downstream countries of 29.8 million hectares which concentrate
mainly in Thailand (12.2 million hectares) Cambodia (11.2 million
hectares), Laos (2.7 million hectares) the remainder is in Vietnam. At
present the only a small part of land resources of the basin are
exploited, mainly in rainy season, accounting for about 11-17%
adjustable land in every country. In condition of the year 2000, the
irrigated area in dry season in Thailand only achieved about 160,000
hectares, Laos 130,000 hectares and Cambodia 250,000 hectares
(according to MRC, 2002). To increase the cultivated area in
upstream countries, the largest limitation is difficulties in water
source, investing and building an irrigational system is very costly
Footer Page 7 of 89.
Header Page 8 of 89.
-6-
due to difficulties in terrain and geology, the area is crumbled
because it is separated by terrain.
According to the development plan of the upstream countries
until 2020, agricultural area in Thailand can come to 3 million
hectares, the cultivated area in Cambodia is 2.5 million hectares and
in Laos is 0.5 million hectares. In near future, hydroelectric
development with total active volume of reservoirs comes to
approximately 50 billion m3.
In the present condition, there are few cultivated areas in the
upstream, however, salinity intrusion in Mekong Delta has happened
complexly, increasing development in the upstream and building
dams can cause unfavorable impacts on the delta and increase
salinity intrusion threatening stable development in the Mekong
Delta. This is considered as great interest in Mekong Delta in the
future.
1.3.
RELATED
EXISTING
RESEARCHES,
LITTLE
MENTIONED PROBLEMS AND THE IDENTIFIED
RESEARCH CONTENTS OF THE THESIS
The researches of international organizations, especially the
researches of MRC in the Basin Development Programme (BDP),
only advance a significant increase in discharge in the scenarios of
the upstream development [54], [55] and [77]. Few researches
mention or have not yet analyzed abnormal operation capacity at
hydroelectric works. One still pays little attention to the evaluation of
salinity intrusion change due to model limitation.
Domestic researchs on salinity intrusion in Mekong Delta and
development in the upstream have been mentioned [3], [4], [16] …
there were few specific or sketchy researches not including the
upstream [9], [13], [24]-[28], [33]. The majority of researches take
discharge at Kratie by design frequency standards or by typical
years. This leads to limitations which are (1) Impractical evaluation
of the influence of salinity intrusion by design probability standards;
(ii) Inadequate evaluation of impacts of upstream development on
Footer Page 8 of 89.
Header Page 9 of 89.
-7-
Mekong Delta ; (iii) Not paying much attention to adaptation
solutions to developments in the upstream ; (iv) Reliability of
calculated results is still a problem.
RESEARCH CONTENTS OF THE THESIS
1) Research on actual state and development abilities in the
Mekong River basin, research on flow regime into Mekong
Delta from historical data to indicate opportunities and
challenges due to hydrological change of water flow into
Mekong Delta ;
2) Research on the change in flow discharge of dry season on
Mekong River due to upstream development and its influence
on the flow and salinity intrusion on the Mekong Delta ;
3) Proposing water resources solutions in Mekong Delta to prevent
salinity intrusion and adaptation to development ability in the
upstream.
CHAPTER 2
RESEARCH ON THE IMPACT OF UPSTREAM
DEVELOPMENT ABILITIES ON FLOW REGIME INTO
MEKONG DELTA
This chapter presents the author’s researches on the basis of
inheriting a set of DSF tools with improvements of the existing
applications (of IQQM) and replacing ISIS model with MIKE 11
model, building models with data updated by scenarios to obtain
tools for the research of thesis topic. Research on hydrological
regime of historical flow into Mekong Delta to get evaluational
analyses of changes in the past due to the impact of developments in
the upstream by different periods (3 periods) as a basis for evaluating
changes due to development in the upstream in the future. Scenarios
of upstream development have been built on development levels in
the upstream (high or low), interest in influences by the field
(agriculture, hydroelectricity), by the space (area, country, territoty).
The development tool of the thesis has been applied to simulate,
analyze and evaluate the impact by developments in the upstream on
the change in the flow into Mekong Delta.
Footer Page 9 of 89.
Header Page 10 of 89.
-8-
2.1.
DEVELOPING TOOLS FOR THE RESEARCH OF THE
THESIS
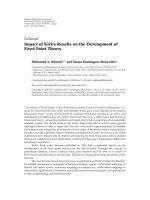
The research has inherited the Decision Support Framework
(DSF), a set of tools helping to make decisions of MRC, making
good the shortcomings of the existing models, replacing and building
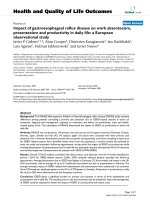
the models of more reliability. Diagram of tools for the research of
the thesis is advanced in Figure 2.1.
N
W
E
S
RESEARCH MODELLING TOOLS
Zoning models application
SWAT Model
MIKE11-DC
MIKE11-§B
China
Knowledge base
SWAT & IQQM-T
SWAT & IQQM-C
IQQM-DB
IQQM Model
Myanmar
Vietnam
â Hµ Néi
Lao PDR
MIKE11 Model
MIKE11-DC
Vientiane
â
MikeToGIS
SWAT & IQQM-T
Parac el Islands
QuÇn ®¶o Hoµng Sa
Thailands
Tools for analysis
Bangkok â
SWAT&IQQM-C
East sea
Cambodia
Times
series
Spatial
data
Phnom Penh â
MIKE11-§B
West sea
IQQM-§B
500
0
Parac el islands
QuÇn ®¶o Trêng Sa
500 Kilo m e ter s
Figure 2.1: Diagram of tools for the research of the thesis and
connections of models to simulate the upstream development
scenarios.
SWAT model simulates the flow from rain, applied in the
upstream of Mekong Delta of Vietnam, using the updated results of
MRC.
IQQM model simulates the water balance in the basin,
permitting to simulate irrigational developments for agriculture,
reservoirs, hydroelectric reservoirs, water supply … There are 3 sets
of models applied to 3 areas:
i) The model is applied to the upstream of Mekong Delta, its
symbol is IQQM-T, there are 7 models built, they are
IQQM-T.1 to IQQM-T.7;
Footer Page 10 of 89.
Header Page 11 of 89.
-9-
ii) The model is applied to the part of Mekong Delta of
Cambodia, its symbol is IQQM-C, there are 3 models built,
they are IQQM-C.1 to IQQM-C.3;
iii) The model in Mekong Delta of Vietnam, its symbol is
IQQM-ĐB, there are 5 models built, they are IQQM-ĐB.1
to IQQM-ĐB.5.
The limitations of IQQM models overcome by the author are:
cropping patern and cultivated area, dividing cultivated area to limit
partial concentration of water demand; agricultural and hydroelectric
data are updated according to construction scenarios. In addition, the
author has set up hydroelectric operation scenarios by abilities in
which operation can really happen (retaining water early, retaining
water late, retaining water abnormally due to construction,
maintenance and overcoming problem …operation to satisfy the
requirements for power load and day-night peak coverage
operation).
MIKE11 hydrodynamic model is substituted for IQQM model
on main stream to simulate by a movement process of water flow to
the downstream; simultaneously substituted for ISIS model on the
delta area to overcome some shortcomings of this model.
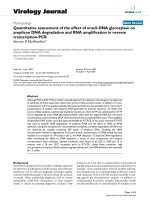
Specifically MIKE11-DC model is built by the author (Figure
2.5) to simulate day-night peak coverage operation of
hydroelectricity on the main stream to overcome limitations of
IQQM model. ISIS limit to salinity intrusion results is replaced by
MIKE11 model, MIKE11-ĐB model (Figure 2.6) at the Southern
Institute of Water Resources Research was applied in the past years,
the author improved, upgraded, calibrated and validated well, built
scenarios in the thesis topic.
Footer Page 11 of 89.
Header Page 12 of 89.
Ou
g
Na
Be
n
m
Saen
N
am
Chiang
ấ
U
%
U
%
m
Na
U
%
U
%
ấ
n
Se
g
MIKE11-DC Model
U
%
an
Nam Kh
m
gu
U
%
Huai Luang
ng
U
%
ai M
on g
u
He
L
Nam
Hu
oei
m
Na
U
%
U
%
ấ
U
%
U
%
U
%
Vientiane
U
%
U
%
Sane
N
S
Nam
Laos PDR
m
Na
E
Viet Nam
Nam Ma
ng
Nam Nhiep
U
%
Nam Poul
Na
mS
Na
mT
heu
n
ong %U
khra
m
Captured from MIKE11-DC
Nakhon Phanom
ấ
U
%
Nam Kam
U
%
Se
F
ng
Ba
ai
Mukdahan
ấ
Se Bang Hieng
U
%
Thailands
U
%
U
%
Legends
U
%
ấ
Fow boundaries
W. level boundaries
Calibration stations
MIKE-DC schematization
Inflow tributaries
MRB boundary
80
0
80
Cambodia
one
Pakse
Sekong-Sesan-Srepok
U
%
ấ
Stung Treng
ong River
$
D
Se
ấ
Chi
Mainstream Mek
M
Nam
Nam
un +
$ấ
Kratie
160 Kilom eter s
MIKE11-DC model:
Source: Built by the author
Upper boundary: Chiang Saen
Lower boundary: Kratie
Other
boundaries:
30
tributaries on the basin.
- Section: Data source from
MRCs navigation project.
- Calibration and validation: for
the
years
2000,
1998
guaranteeing reliability.
- Application:
Hydraulic
simulation on the main stream
of Mekong river; hydroelectric
operation scenarios.
-
Luang Prabang
N
W
- 10 -
Figure 2.5: MIKE11-DC model is applied to Mekong main stream
S.S. R
eap
MIKE11-B model :
- Source: SIWRR, the author is a
ng
S tu
key participant
Kratie flow boundary
init
Prek Te
g Ch
- Upper boundary: Kratie
Stun
Prek Chhlong
- Lower boundary: sea boundary
Stung Baribo
- Other
boundaries:
in
Cambodia;
Saigon,
Dongnai
Prek Thnot
Dầu Tiếng flow boundary
and Vaico river boundaries;
Trị An Q boundary
irrigation boundaries; basin
Tân Châu
Mộc Hóa
Châu Đốc
Bến Lức
entry boundary from rain.
Mỹ Thuận
- Terrain, section, works: are
updated continuously.
Cần Thơ
Rạch Giá
Calibration & validation: for
Đại Ngãi
the years 2000, 2001, 2005.
Legends
Guaranteeing reliability.
Cà Mau
- Application:
Hydraulic
simulation
and
salinity
intrusion in Mekong Delta
according
to
upstream
development scenarios.
Figure 2.6:MIKE11-B: Hydraulic and saline intrusion model in MD
U
%
MIKE11-ĐB Model
n
Se
N
U
%
W
$
%
U
$
St
un
g
U
%
U
%
St
un
g
re
ng
hi
K
S.
C
S.D
autr
i
U
%
Pu
rs
at
St
au
ng
U
%
U
%
Stu
ng
San
g ke
r
U
%
$
U
%
U
%
$
$
$
U
%
U
%
Q Vàm Cỏ Đông
$
U
%
U
%
$
U
%
U
%
$
U
%
U
%%
U
U
%
$
U
%
U
%
%
U
U
%
$
U
%
$
$
%U
U U
%
%%
U
U
%
U
%
%
U
U
%
U %
%
U
U
%
U
%
U
%
$
$
U
%
$
U
%%
U
U
%
%
U
U
%
U%
%
U
$
U
%
U
%
U
%
%
U
U
U%
%
$
U
%
U
U %
%
U
%
U
%
U
U %
%
%
U
$
$
$
$
30
$
$
U
U %
%
U
%
Captured
from
MIKE11-ĐB
0
30
60 Kilomete rs
Footer Page 12 of 89.
$
E
S
U
%
Flow boundaries
W. level boundaries
Rainfall, Q & H calibration stations
Calibration station forn MRC source
Rivers and canals in MIKE11-ĐB
Sub-basin zoning in Cambodia
Header Page 13 of 89.
2.2.
- 11 -
RESEARCH ON HYDROLOGICAL REGIME OF
FLOW INTO MEKONG DELTA BASED ON
HISTORICAL DATA
2.2.1. Data base, concepts and division of analytical periods
Data of water level and discharge at Kratie from 1924 to 2012
were gathered from the source of the Mekong River Commission.
Hydrological parameters were analyzed according to 3 development
periods in the basin: 1) Before 1960 (mainly agriculture); 2) From
1961 to 2000 (few more irrigation reservoirs, hydroelectric reservoirs
on the basin); 3) 2001 to 2012 (more hydroelectric reservoirs in
China, Laos and Central Highland of Vietnam).
2.2.2. Analysis of average annual flow change and according to
hydrological year
Average discharge of many years at Kratie was about 13,920
3
m /s. Average discharge according to hydrological year and calendar
year was quite stable, the averages of many years vary about
160m3/s.
2.2.3. Analysis of average flow change of dry season between
years and according to periods.
The research indicates that there has been a considerable
increase in average discharge of dry season from 2000 until now as
compared with previous periods and analysis of the influence of the
flow in flood season on the flow of next year. The average of dry
season in the period of 2001–2012 was about 505 m3/s higher as
compared with the period of 1961 to 2000. From 1924 to 2012
average different value of average discharge in dry season between
two years in succession was about 496 m3/s.
2.2.4. Analysis of flow change between months of dry season
according to periods
The research indicated that there was a considerable increase
in the flow in dry season by the periods after 1960 as compared with
previous periods due to regulation impact of reservoirs on the basin
(Table 2.6), there was an increase of 258-717 m3/s of the period after
2000 as compared with period before 1960.
Footer Page 13 of 89.
Header Page 14 of 89.
- 12 -
Table 2.6: Comparison of average discharge change of months of dry
season between periods
No
A change in average discharge of periods in
months (m3/s)
Period
.
After
19612000
Before
19241960
Dec.
Jan.
Feb.
Mar.
Apr.
May
-263
47
30
100
117
15
2
01-12
24-60
74
305
436
576
834
850
3
61-12
24-60
-185
106
123
210
282
208
4
01-12
61-00
337
258
406
477
717
835
1
2.2.5. Research on a change in average flow regime of months of
dry season according to periods
Analysis of flow ratio in dry season as compared with the
flow of hydrographical year
Using balanced calculation methods according to water rate
distributed in the year, take the rate of % the flow of every month of
dry season or the whole dry season as compared with average
discharge according to hydrological year in each year then take this
average rate by the period, the author has proved there is the
regulation of flow increase of rainy season to dry season (Table 2.7)
Table 2.7: Results of analysis and evaluation of regulation increase
of rainy season to dry season
No.
Period
Qmk/
Qntv
(%)
α , Average of flow ratio of every month of
dry season as compared with the flow of
hydrological year (%)
Dec.
Jan.
Feb.
March
April
May
1
1924-2012
12.2
3.57
2.24
1.65
1.34
1.31
2.14
2
1924-1960
11.6
3.53
2.13
1.55
1.22
1.16
1.99
3
1961-2000
12.5
3.62
2.33
1.69
1.38
1.33
2.16
4
2001-2012
13.4
3.51
2.28
1.80
1.56
1.68
2.54
5
1961-2012
12.7
3.60
2.32
1.71
1.42
1.41
2.25
Footer Page 14 of 89.
Header Page 15 of 89.
- 13 -
The flow of April in the period of 2001-2012 accounted for
1.68% of the flow of the year, much more increase as compared with
that in the period 1924-1960 (1.16%)
Analysis of flow change ratio of next month compared with
previous month in dry season
The research has proved that the flow of months of dry season
in recent periods, especially from 2001 until now, has tended to go
down slowly, horizontally and rise up slowly as compared with that
in the period before 1960 (going down quickly and rise up quickly).
The droughtiest month moved up March
2.2.6. Analysis and evaluation of hydrological change of dry
season by flow frequency
Discharge into Mekong Delta is corresponding to flow
probability of P50% as compared with P85% in months from January to
April, it only differs about 278 m3/s to 489 m3/s, which is smaller
considerably as compared with a possible impact due to an increase
in agricultural development or regulation of hydroelectricity. For that
very reason, calculating hydraulic design and water resources
planning by the standard of design flow probability has not yet
guaranteed reliability if one does not consider developments in the
upstream.
2.3. SETTING UP DEVELOPMENT SCENARIOS IN THE
UPSTREAM IN THE FUTURE
2.3.1. The factors of upstream affect hydrological flow into
Mekong Delta of Vietnam
The thesis has studied, analyzed and evaluated natural factors
and impacts by humans which affect the change in flow into the
Mekong Delta of Vietnam and define important factors: Building
reservoirs, developing agriculture and shifting water in the basin;
managing operation, and changing hydrometeorology.
2.3.2. Basis for setting up development scenarios in the upstream
On the basis of the analyzed important factors (2.3.1.), based
on actual conditions on the basin, hydroelectric and agricultural
Footer Page 15 of 89.
Header Page 16 of 89.
- 14 -
development plans in the Mekong basin countries are used as basis
for setting up scenarios with low and high development levels.
2.3.3. Development context in the upstream and building the
upstream scenarios
Development context in the future is considered as advanced in
Table 2.12 in which the symbols of basin development context such
as BL00 are corresponding to development conditions in 2000 and
considered as baseline scenario. On the basis of this upstream
development context, 11 upstream development scenarios are built to
evaluate impacts caused by hydroelectric development in China; by
hydroelectricity on the Mekong River basin; by agricultural
development in the upstream of the Mekong Delta of Vietnam; and
the upstream of the Mekong Delta; hydroelectric development in
combination with agriculture.
Table 2.12: Development context in the upstream until 2020
No
.
1
2
3
4
5
Development
conditions
Status quo of
development
in 2000
Chinese
hydroelectricit
y exists
Hydroelectrici
ty will exist in
near future
Low
Agriculture
development
High
Agriculture
development
Symbol
Active volume
of reservoirs
(106 m3)
Basin water
transfer
(106 m3)
Lower
basin
Outsi
de
Inside
3,262
2,200
China
BL00
3,400
13,680
-
TĐTQ
3,400
13,680
22,700
TLG
3,400
26,230
22,700
NNT
4,200
13,680
NNC
6,620
13,680
(Source: MRC, 2005)
Footer Page 16 of 89.
Irrigate
d area
(1000
ha)
Header Page 17 of 89.
2.4.
- 15 -
RESEARCH ON THE EVALUATION OF WATER
DEMAND CHANGE IN THE UPSTREAM AND THE
FLOW INTO MEKONG DELTA ACCORDING TO
UPSTREAM DEVELOPMENT SCENARIOS
2.4.1. Scenarios and simulated methods
9 scenarios of KBT0-KBT8 are simulated with the case of
normal operation of hydroelectricity. The case of abnormal water
retention operation at Chinese hydroelectricity is considered at KBT9 (water retention in a short period of 10 days/month). In addition,
there are still very many different scenarios which can happen to
hydroelectric operation analyzed and calculated such as:
- Water retention operation : retaining water early or late ;
- Peak coverage operation satisfies the requirements for
electrical load ;
- Day-night electrical peak coverage operation (simulated by
Mike11-DC).
Scenarios are simulated, corresponding to sequence of
hydrometeorological times series from 1985 to 2000, eliminating the
results of 1985 (eliminating the error of the first year).
2.4.2. Indicators and result evaluation methods
Analytical indicators are built to evaluate adequately the
impacts by a change in water demand and discharge into Mekong
Delta according to countries, according to many years; according to
months; the largest month; the droughtiest month; comparing the
allocation of water use between countries; the used water ratio as
compared with water potentiality; compared with baseline scenarios.
2.4.3. Results of simulation, analysis and evaluation
The research indicates that hydroelectric development in the
upstream in the case of normal operation increases the flow in dry
season, even highly agricultural development, the flow in dry season
can increase 300-800m3/s, the droughtiest month also achieves more
than 2,200 m3/s higher as compared with a necessary level to
maintain saline boundary reasonably. High agriculture scenarios with
no additional hydroelectricity, the flow of the droughtiest month only
Footer Page 17 of 89.
Header Page 18 of 89.
- 16 -
still has 1298 m3/s, therefore, agricultural development in the
upstream is anxiety.
Abnormal water retention operation (KBT-9) according to
periods of unfathomable impacts can change the flow in dry season
in these periods of the year of much water into droughty year and
vice versa (droughty year changing into the year of much water).
Early or late water retention operation makes the flow into the
Mekong Delta reduce at the beginning of rainy season or the
beginning of dry season, therefore, it can affect 2 main rice crops
Winter-Spring and Summer-Autumn. Peak coverage operation at
Chinese hydroelectricity satisfies the requirements for load at the
level of 60% capacity (VH60) which can make 30%-40% of the
number of years that reservoirs lose regulation ability because their
water lowers to dead water level (Table 2.21). Day-night peak
coverage operation can affect the downstream within a distance of
300-700km from dam site.
Table 2.21: Satisfaction ability of Nuozhadu hydropower dam
according to operation scenarios
No.
Operation
Scheme
The number of appearance years achieves in total
16 simulated years
60% 70% 80%
To
Overflow
NWL
Whi Whi Whi
DWL
exist
0
0
0
0
15
0
1
VH70
2
VH60
4
4
3
0
6
0
3
VH50
16
16
16
15
0
14
4
VH50CN
16
16
15
15
0
12
5
VH45
16
16
16
15
0
15
6
VH5045
16
16
16
16
0
15
7
VH5147
16
16
16
15
0
15
8
VH5147T
16
16
16
15
1
14
Where: Whi: Active volume; NWL: Normal water level; DWL:
Dead water level.
Footer Page 18 of 89.
Header Page 19 of 89.
- 17 -
2.5
CONCLUSION OF CHAPTER 2
The author has set up a set of tools for the research and applied
it to simulate the impacts of the upstream development scenarios on
the changes in the flow into Mekong Delta; and indicated
opportunities and challenges for the Mekong Delta of Vietnam in the
future, especially opportunities of the regulation of flow increase by
regulation operation of hydroelectric works as well as unfathomable
impacts which it can conduct (abnormal water retention, early water
retention, late water retention …) are clarified. Anxiety for an
increase in water use for agricultural development in the upstream
and especially in Cambodia is clarified. The laws of changes in the
flow in dry season are also clarified and have helped to forecast the
flow of dry season and salinity intrusion serving production
opportunely.
CHAPTER 3
RESEARCH ON THE IMPACTS OF UPSTREAM
DEVELOPMENT ABILITIES ON THE FLOW AND
SALINITY INTRUSION IN MEKONG DELTA OF VIETNAM
AND ADAPTATION SOLUTIONS
This chapter presents the established scenarios to evaluate the
impacts of upstream development abilities on the changes in the
flow and salinity intrusion in Mekong Delta in which changes in land
use in the Mekong Delta of Vietnam are considered : (i) Status quo
of land use in 2005; (ii) A change in land use in the future as
expected. Applying tools developed in Chapter 2 to simulate the
established scenarios; analyzing and evaluating the flow changes and
salinity intrusion in the Mekong Delta; evaluating satisfaction ability
of irrigational structures for salinity intrusion prevention, water
supply and proposing adaptation solutions in Mekong Delta.
Footer Page 19 of 89.
Header Page 20 of 89.
- 18 -
3.1.
SETTING UP SCENARIOS IN MEKONG DELTA IN
THE CONTEXT OF UPSTREAM DEVELOPMENT
The research has set up 10 scenarios for Mekong Delta (KBH0 to KBH-9) which are the combination of the corresponding
upstream scenarios (KBH-0 to KBH-9) associated with status quo of
land use in 2005 in Mekong Delta of Vietnam.
Similarly, the research has also set up 11 scenarios for Mekong
Delta which are the combination of upstream scenarios associated
with the expected land use in the future in Mekong Delta of
Vietnam, they are symbolized by KBHN-0 to KBHN-10. KBHN-10
is a scenario which intervenes in the Tonle Sap by a barrage at
Prekdam.
3.2. A CHANGE IN SALINITY INTRUSION ACCORDING
TO UPSTREAM DEVELOPMENT SCENARIOS AND
STATUS QUO OF LAND USE IN MEKONG DELTA
3.2.1. Scenarios and description of simulated scenarios
MIKE11-ĐB model is used and simulated for the established
scenarios from KBH-0 to KBH-9.
3.2.2. Indicators of analysis and evaluation of results
Many analytical details are considered: salinity intrusion by the
space (area, zone); influence time (early, late appearance, saline
concentration is maintained at a high level); by the distance from
river mouth; increase, decrease as compared with baseline scenarios.
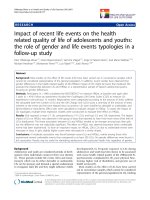
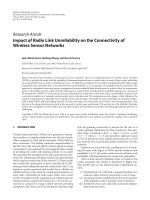
3.2.3. Results of simulation, analysis and evaluation
The map of salinity intrusion concentration and duration has
been set up, changes in salinity intrusion by the area and by the
distance on the main stream have been analyzed and quantified. The
results show positive impacts due to increase regulation of
hydroelectric reservoirs such as the area of saline influence of 4g/l
which decreases more than 57 thousand hectares according to KBH3 as compared with KBH-0. Salinity is pushed back 6.3km on Hau
River in KBH-6 (as compared with background scenarios).
Footer Page 20 of 89.
Header Page 21 of 89.
- 19 -
Table 3.4: The distance of salinity intrusion in some upstream
development scenarios
Scenario
Tien River
Hau River
L(km) + increase;–decrease L(km) + increase;–decrease
KBH-1
44.4
0.0
45.5
0.0
KBH-6
39.9
-4.5
39.2
-6.3
KBH-7
44.4
0.0
45.5
0.0
KBH-8
49.8
5.4
51.7
6.2
Unfathomable impacts cause a disadvantage for the flow
change and the development of salinity intrusion in Mekong Delta
evaluated such as (i) Reservoirs retaining water early can make longstanding salinity last 1 month and affect Summer-Autumn rice; (ii)
Reservoirs retaining water late can make salinity appear early (from
1 to 2 months), which affects Summer-Spring rice crop; (iii)
Reservoirs retaining water abnormally or operating according to the
requirements for load (an increase in capacity with a long time) can
make saline development change suddenly, which is very
unfavorable for taking fresh water.
Area affected by salinity intrusion with concentration in selected scenarios
1800
Area (1000ha)
1600
1400
1200
1000
800
600
400
200
> 4g/l
0
KBH-0
KBH-3
0.2-2g/l
KBH-6
KBH-8
KBH-9
0.2-2g/l
KBH-0
475.20
KBH-3
437.31
KBH-6
430.92
KBH-8
471.78
2-4g/l
704.22
619.36
607.70
714.03
KBH-9
447.19
640.44
> 4g/l
1587.88
1530.65
1515.10
1607.28
1556.00
Figure 3.6: A change in the area of salinity intrusion is corresponding
to salinity concentration according to some scenarios.
3.3. A CHANGE IN SALINITY INTRUSION ACCORDING
TO UPSTREAM DEVELOPMENT SCENARIOS AND A
CHANGE IN LAND USE ON MEKONG DELTA
Footer Page 21 of 89.
Header Page 22 of 89.
- 20 -
3.3.1. Scenarios and description of simulated scenarios
MIKE11-ĐB model is used and simulated for the established
scenarios of KBHN-0 to KBHN-10.
3.3.2. Indicators of analysis and evaluation of results
Table 3.5: Indicators of analysis and evaluation of impact rate
changing discharge into Mekong Delta by upstream
development scenarios.
Positive influence:
Discharge increase > a
change in discharge
levels (m3/s)
Very
Good Positive
good
(TT)
(T)
(TTT)
489
337
0
Negative influence:
discharge decrease >= a
change in discharge levels
(m3/s)
Very
Bad Negative
bad
(XX)
(X)
(XXX)
-489
-337
0
No.
Month
1
January
2
February
320
221
0
-320
-221
0
3
March
278
191
0
-278
-191
0
4
April
349
240
0
-349
-240
0
In which: the each following indicator means the difference
are higher or smaller the ‘threshold’
- ‘Very good’ indicator QP50% - QP85%; ‘Very bad’ ≤ QP85% QP50%;
- ‘Good’ indicator QP50% - QP75%; ‘Bad’ ≤ QP75% - QP50%;
- ‘Positive’ or ‘Negative’ indicator: Q increases or decreases
3.3.3. Results of simulation, analysis and evaluation
By advancing indicators to evaluate the impact rate which
changes the flow into Mekong Delta such as Table 3.5, limits of
boundary conditions have been eliminated and quantified reliably the
impact rate of upstream development scenarios. Results show that in
the case of hydroelectric increase with reasonable operation and
agricultural development increase, most water discharge into
Mekong Delta is still at ‘Very good’ level, so the existing irrigation
system can prevent salinity intrusion better as compared with
baseline scenario. However, increasing agricultural development,
Footer Page 22 of 89.
Header Page 23 of 89.
- 21 -
intervening in Tonle Sap or operating water retention … will have a
‘Very bad’ impact.
Salinity intrusion development according to upstream
development scenarios in combination with a change in land use in
the Mekong Delta of Vietnam is also similar to scenarios
corresponding to status quo of agricultural cultivation in 2005
analyzed in section 3.2, which means that this change in water use in
the Mekong Delta of Vietnam by land use change is not a main
solution.
The thesis has studied and made the relationship between
salinity concentration at 3 stations Dai Ngai (Hau river), Tra Vinh
(Co Chien river) and Son Doc (Ham Luong river) corresponding to
the discharge into Mekong Delta of Vietnam and indicated difference
between them.
3.4. SATIFACTION ABILITY OF THE EXISTING WATER
RESOURCES WORKS AND SOME MAIN SOLUTIONS
TO ADAPT WITH THE UPSTREAM DEVELOPMENT
SCENARIOS.
3.4.1. Evaluating the satisfaction ability of the existing water
resources works with the upstream development scenarios
The results of salinity intrusion simulation according to the
upstream development scenarios show in normal operation
conditions of hydroelectric works, salinity intrusion tends to decrease
significantly due to an increase in regulation discharge from
reservoirs. However, in the conditions of unfavorable hydrological
year (droughty year) an increase in water use for agricultural
development in the upstream makes salinity intrusion penetrate more
deeply as compared with it in the present. The irrigational systems of
Go Cong, North Ben Tre, South Mang Thit, Ca Mau peninsular
(QLPH and Soc Trang) and Western coast meet with difficulties in
water source because salinity intrusion affects water intake or
reduces ability to take water.
3.4.2. Some solutions in Mekong Delta of Vietnam to adapt with
the upstream development scenarios
Footer Page 23 of 89.
Header Page 24 of 89.
- 22 -
Structural solutions: The thesis has advanced some solutions
to every existing irrigational system combined with large sluices
solutions (Ham Luong, Vam Co, Cai Lon, Cai Be), dredging axis
canals or supplementing sluices for every system. Especially
proposing active solutions to water and operating the system
effectively such as combining small projects into larger systems to
guarantee water source (Go Cong+Bao Dinh, Ba Lai+Nam Ben Tre,
Tiep Nhat+QLPH …), building electric pump stations, the alternative
of active on-off operation of sluice gates (electric motor …) to
guarantee for water, water storage or drain to wash the system;
solutions to the establishment of automatic monitoring systems,
updating information on water to take initiative in operation.
Non-structural solutions: The thesis has advanced some
solutions such as strengthening the work of forecast, warning;
building the operation schedule of works; studying and setting up the
water management boards with a large scale not limited by
provincial boundary (institution, law); seasonal transfer and changing
land use to adapt with changes in salinity intrusion and water source.
3.5. CONCLUSION OF CHAPTER 3
Chapter 3 has quantified adequately the impacts according to
the upstream development scenarios on changes in the flow and the
development of salinity intrusion on the Mekong delta including both
positive impacts and negative impacts. Detail the impacts due to
hydroelectric development; due to agricultural development in the
upper countries or according to the area. Indicate opportunities for
increasing water source as well as unfathomable impacts and obtain
adaptation solutions to upstream developments.
CONCLUSION AND RECOMMENDATION
CONCLUSION
The thesis has solved some shortcomings discovered in
relevant researches such as indicating unreliability in planning and
design solutions according to design probability standard
4.1.
Footer Page 24 of 89.
Header Page 25 of 89.
- 23 -
corresponding to discharge into Mekong Delta at Kratie and
advancing adaptation solutions to the possible impacts due to
development in the upstream. At the same time, solving
shortcomings scientifically (reliability of calculation results) thanks
to tool improvement and approach methods has indicated
unfavorable impacts which previous researches have not yet had
such as (i) Discharge reduction at the beginning of rainy season and
at the end of dry season (due to early or late water retention) makes
salinity appear early or end late; (ii) Clarification such as the impact
of Chinese hydroelectricity which does not increase completely and
regularly the discharge into the downstream but it still has
unfavorable impacts when water is retained abnormally or capacity
increase is operated; (iii) The impact can be caused by an increase in
agricultural area in Cambodia … Analyzing a sequence of historical
data has helped to understand the law of the flow change in dry
season and changes in recent time have helped to forecast the longterm flow in dry season and salinity intrusion.
Some new main results which the thesis has achieved as
advanced below:
Regarding the development of tool set of the thesis topic
1) The thesis has inherited the DSF, a set of tools for making
decision by International Mekong River Commission, overcoming
shortcomings and developing newly as indicated in Chapter 2,
simultaneously building scenarios and simulation models. Apply this
tool set to simulate, analyze and indicate unfavorable impacts on the
flow change and salinity intrusion in Mekong Delta according to
development scenarios in the upstream. The results of the thesis and
the updated data base set have created a set of knowledge base (data
base and model tools) of Mekong River basin, which permits to
apply in scientific research and production service in Mekong Delta
such as annual salinity intrusion forecast; water resources protection,
management and planning, supporting to agricultural, irrigational
development, aquaculture and environmental protection.
Footer Page 25 of 89.