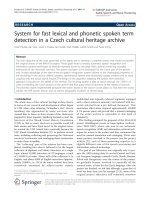
Climate change impacts: Challenges for food security and sustainable agricultural productivity growth in Vietnam
Bạn đang xem bản rút gọn của tài liệu. Xem và tải ngay bản đầy đủ của tài liệu tại đây (1.53 MB, 36 trang )
Climate change impacts: Challenges for
food security and sustainable agricultural
productivity growth in Vietnam
Geetha Mohan Ph.D.
Integrated Research System for Sustainability Science
IR3S, University of Tokyo
Contents
What is climate change, food security and
sustainability
How climate change impacts on food security
and agriculture production
Case study on Vietnam
Major Objectives
Review of Literature
Data and Methodology
Results
Conclusions
What is Climate Change?
Increase in Global mean temperature (0C)
Short-term:
Greater Climate
Variability
including
extreme events
(floods, drought
etc.,)
Long-term: Shifts
in mean climate
conditions
(changes in
expected
rainfall months
etc.,)
Source: FAO 2009
Impacts of natural disasters on agriculture
Number of flash flood over years
National Centre for Hydrometeorological Forecasting, MONRE 2010
Paddy & cultivation area loss due to natural
calamity (000 ha)
Central Committee for Flood and Storm Control, 2010
Food Security
FAO (2003) refers to the existence of food security
“when all people, at all times, have physical and economic access
to sufficient, safe, and nutritious food for a healthy and active life”.
FAO (2009) has also reported that while globally the impact of
climate change on food production may be small, at least until
2050.
The distribution of production will have severe consequences on
food security.
Due to result of global warming, most of the developing countries
may experience a decline of between 9% and 21% in overall
potential agricultural productivity.
Dimensions of food security
Dimensions
Impacts
Availability
Adequacy of food supply
loss in food production,
indirect environmental
feedbacks
Access
Accessibility to food or affordability
Infrastructure damage, asset
losses; loss of income and
employment opportunities
Stability
of supply, without seasonal fluctuations or
shortages
Utilization
quality and safety of food
FAO (2009)
Increased livelihood risks,
pressure on food prices;
Higher dependency on food
imports and food aid
Human health risks, nutrition
Challenges on food security
Food insecurity, food deficits or shortages are major concerns of
all countries.
However, it will vary from country to country, and much will
depend on the degree of investments on agriculture, food
distribution systems, early warning measures, transport and
communications. An overriding factor concerns appropriate
policies on food security.
For e.g. small farmers and medium farmers
nutritional and food insecurity problems.
Difficulties to minimize and ensure sustainable
consistent farm produce are major challenges for
small farmers.
Sustainability
Generally there is no accepted definition of sustainable
agriculture.
Swindale (1988) explained, “sustainability conveys the idea of a
balance between human needs and environmental concerns”
Rapidly rising population growth
and diminishing arable land,
particularly in the developing
countries, has increased the stress on
the natural resource base.
It is now incontestable that
sustainable agriculture is seen as an
important goal throughout the world.
Photo Courtesy: UNO
Food Availability
Per capita milled rice
Per capita foodgrain
Northern provinces
achieved food
sufficiency
Kg of milled rice equiv.
per capita in 2006
0 - 50
51 - 100
101 - 200
201 - 500
501 - 1500
1501 - 3000
3001 - 6763
Source: Nguyen Trung Kien, 2013
Southern provinces
produced surplus
food (rice) for
export
Food Affordability
Poverty Rate (%)
Domestic Food Price (VND/kg)
2006
Vietnam
2010
140
15.5
10.7
Urban
7.7
5.1
Rural
18
13.2
Red River Delta
10.1
6.5
North East
22.2
17.7
40
North West
39.4
32.7
20
North Central Coast
26.6
19.3
South Central Coast
17.2
14.7
Central Highlands
24
21
South East
4.6
3.7
13.3
11.4
By region
Mekong Delta
25.0
120
20.0
100
15.0
80
60
0
10.0
5.0
2002
2004
2006
2008
2010
Rice (1000 VND/kg)
Pork (1000 VND/kg)
Beef (1000 VND/kg)
Buffalo meat (1000 VND/kg)
Poultry (1000 VND/kg)
CPI (%)
Real income growth (%)
Source: VHLSS 2002 – 2012
0.0
Food Utilization Threat of Undernourished Children
Percentage of Under-5 Children Undernourished (weight for age)
Group/Region
Vietnam
VietNam - Kinh/Chinese
Percentage
20.2
18
VietNam - Other Minorities
29.7
Red River Delta
18.5
North East
22.3
North West
28.8
North Central Coast
21
South Central Coast
23.7
Central Highlands
23.2
South East
10.8
Mekong River Delta
20.4
Source: Nguyen Trung Kien, 2013
Households by Farm size (%)
70.0
60.0
50.0
40.0
30.0
20.0
10.0
0.0
Red River Delta
Northern midlands North Central and
and mountain
Central coastal
areas
areas
< 0.2 ha
0.2 ha - 0.5 ha
Source: agrocensus 2011
Source: Nguyen Trung Kien, 2013
Central Highlands
0.5 ha - 2 ha
South East
Mekong River Delta
>=2ha
Food Security Policies
Land policies for agricultural
production
Policies on water resources for
agriculture production
Policies on infrastructure for agriculture
Policies on rice price
Restrict export in emergency case
Policy to support directly to paddy
farmers
Case Study-Vietnam
Introduction
Agriculture is very important sector for Vietnamese economy.
However, improving agricultural output will leads to enhance
farmers livelihoods and their household incomes.
Agriculture sector contributes 16 percent of National GDP
(GoSF, Vietnam); and the annual agricultural exports are
around 30 percent in 2006 (WDI).
Around 70 percent of the population are living in rural areas;
and that fifty percent of the population are directly engaged
in agricultural activities (World Bank).
Introduction
Cntd….
50.0
45.0
40.0
35.0
30.0
25.0
20.0
15.0
10.0
5.0
0.0
1990
1991
1992
1993
1994
1995
1996
1997
1998
1999
2000
2001
2002
2003
2004
2005
2006
2007
2008
2009
2010
Percent
GDP at Constant 1994 prices, Vietnam-1990-2010
Agriculture, Forestry and Fishery
Service
Year
Industry and Construction
Land use pattern, Vietnam-2011
WHOLE
Mekong
Red
9.7
5.8 1.9
3.01.2
59.4
16.5
24.7
37.0
Forestry Land
Source: General Statistics Office of Vietnam
Specially used Land
3.2
8.0
3.71.0 7.2
57.4
19.3
15.4
18.5
3.0
52.4
35.7
Agricultural Land
6.3
21.7
57.4
Central
Northern
7.7
64.5
South
North
5.5 2.1
46.4
30.6
14.5
Homestead Land
6.6
Others
15.7
19.9
17.3
Cropping Pattern in Vietnam
60.0
2005
2006
2007
2008
2009
2010
50.0
Percent
40.0
30.0
20.0
10.0
0.0
Paddy
Maize
Sugar-cane
Cotton
Crop
Source: General Statistics Office of Vietnam
Peanut
Soya-bean
Perennial
Industrial, Fruit
Crop and
Others
Climate change and impact on crop yield
Impact of climate change in Vietnam, 2020 - 2100
2020
2060
2100
Annual average temperature change relative to 1980-99 (C0)
0.4
1.4
2.3
Annual average rainfall change relative to 1980-99 (%)
1.2
3.7
5.8
Sea-level rise (cm)
12
37
75
Source: MONRE, 2009
Commodity
Rice
Maize
Cassava
Sugarcane
Coffee
Vegetables
Yield change (%) relative to
baseline
Pessimistic
Optimistic
-12.5
-1.7
-10.27
1.7
-0.21
2.34
-6.4
7.2
-18.89
4.38
-5.8
-3.77
-19.81
4.34
-18.93
4.23
-18.95
3.61
-20.83
5.33
Source: Van Dijk et al., 2013
Horizon
1990-2050
2000-2030
2000-2050
1990-2050
2000-2030
2000-2050
2000-2030
2000-2030
2000-2030
2000-2030
Objectives
To analyze the trends in agricultural total factor productivity
growth using Malmquist Index by regional-wise in Vietnam
To evaluate the relationship between climate variables and
agriculture total factor productivity
To examine the determinants of total factor productivity
growth in Vietnam agriculture
To conclude the major findings of the study
Review of Literature
Cross-Country
Fulginiti and Perrin (1997)
18 LDC in 1961-85
Lusigi & Thirtle (1997)
47 Africa Countries in 1961-91
Rao & Coelli (1998)
97 countries in 1980-95
Trueblood & Coggins (2003)
115 countries in 1961-91
Coelli & Rao (2003)
93 countries in 1980-2000
With in the Country
Mao and Koo (1997)
29 Provinces, 1984-1993
Conradie, Piesse & Thirtle (2009)
31 Magisterial Districts, Western Cape,1952 to 2002
Armagan, Ozden & Bekcioglu (2010)
Region-wise, Turkey in 1994-2003
Nicholas, Buccola & Fuglie (2011)
Provincial-wise, Indonesia, 1985-2005
Shilpa (2012)
State-wise, India, 1983-84 to 2005-06
Fantu N B (2012)
Zone-wise, Ethiopia, 2003-04 to 2008-09
Mohan Geetha & Hirotaka Matsuda
(2013)
10 Regions, Ghana, 2000-09
Data and Methodology
Particular
Source
Period
Extra/Interpolation
1. Agriculture Output in
(Bill. VND)
2. Livestock includes
Buffalo, Cattle, and
Pigs* (000’ head)
3. Machinery includes
Agricultural Tractors,
Threshing Machines
(no. of pieces)
4. Agricultural Land in
000’ ha.
5. Agricultural Labor
(000’ persons)
1. Statistics of
Agriculture, Forestry
and Machinery,
Published by
Government Statistics
of Vietnam, 2000.
2. General Statistics
Office of Vietnam
Online Database.
1985-2007**
1.
1.
1.
1985-2007
Station wise
Precipitation(mm)
and Air
Temperature mean
(2m- Degree
Celsius)
Canadian Climate
Change Scenarios
Network, Canada
2.
3.
Agricultural Labour
(2004-2007)
Agricultural Land
(1988, 1989 and
1999 to 2004)
Machinery (2000,
2007)
* Livestock calculations based on Hayami and Ruttan (1970)
** For analysis purpose, we considered only 61 provinces instead of 64 provinces because the
new 3 provinces are formed after 2004. They are Dien Bien from Lai Chau; Dak Lak from Dak
Nong; Hau Giay from Can Tho.
Methodology
The Malmquist Index measures the TFP changes between two
data points (for e.g. those of a particular regions in two adjacent
time periods)
TFP growths and decomposition components (Efficiency and
Technical Change).
Following Färe et al. (1994) the Malmquist TFP index between
period t and t+1 is given by
The Malmquist index could be decomposed into an efficiency
change component and a technical change component
M0 >1 indicates positive TFP growth from period t+1 to period t, while M0 <1indicates a TFP
decline.
Methodology
Cntd……
Impacts of causal factors on Total Factor Productivity Growth.
The Cobb-Douglas Production function
Methodology
Cntd.....
Explanatory Variable
Description of Variable
Yit
Agricultural Output (VND Dongs)
X1,it
Agricultural Land (ha)
X2,it
Agricultural Labour (no/ha.)
X3,it
Livestock (no./ha.)
X4,it
Machinery-Tractors & Threshers (no./1000ha)
X5,it;
Temperature (C0)
X6,it
Precipitation (mm)
R2
Regional Dummy- Mekong River Delta
R3
Regional Dummy- Central Coast
R4
Regional Dummy- Northern Midlands
R5
Regional Dummy- Red River Delta
R6
Regional Dummy- South East
β1,… β6
The coefficients for the endogenous variables
γ2 , γ3 , γ4 , γ5 , and γ6
The coefficients for the binary regressors
Uit
The error term
Efficiency change, Technical and Total factor productivity growth in Vietnam
Agriculture
1.25
1.15
Growth Index
1.05
0.95
0.85
0.75
0.65
1986 1987 1988 1989 1990 1991 1992 1993 1994 1995 1996 1997 1998 1999 2000 2001 2002 2003 2004 2005 2006 2007
Year
Efficiency Change
Technical Change
Total Factor Productivity