Computational color imaging
Bạn đang xem bản rút gọn của tài liệu. Xem và tải ngay bản đầy đủ của tài liệu tại đây (8.78 MB, 244 trang )
Lecture Notes in Computer Science
Commenced Publication in 1973
Founding and Former Series Editors:
Gerhard Goos, Juris Hartmanis, and Jan van Leeuwen
Editorial Board
David Hutchison
Lancaster University, UK
Takeo Kanade
Carnegie Mellon University, Pittsburgh, PA, USA
Josef Kittler
University of Surrey, Guildford, UK
Jon M. Kleinberg
Cornell University, Ithaca, NY, USA
Alfred Kobsa
University of California, Irvine, CA, USA
Friedemann Mattern
ETH Zurich, Switzerland
John C. Mitchell
Stanford University, CA, USA
Moni Naor
Weizmann Institute of Science, Rehovot, Israel
Oscar Nierstrasz
University of Bern, Switzerland
C. Pandu Rangan
Indian Institute of Technology, Madras, India
Bernhard Steffen
University of Dortmund, Germany
Madhu Sudan
Microsoft Research, Cambridge, MA, USA
Demetri Terzopoulos
University of California, Los Angeles, CA, USA
Doug Tygar
University of California, Berkeley, CA, USA
Gerhard Weikum
Max-Planck Institute of Computer Science, Saarbruecken, Germany
5646
Alain Trémeau Raimondo Schettini
Shoji Tominaga (Eds.)
Computational
Color Imaging
Second International Workshop, CCIW 2009
Saint-Etienne, France, March 26-27, 2009
Revised Selected Papers
Including 114 colored figures
13
Volume Editors
Alain Trémeau
Université Jean Monnet
Laboratoire Hubert Curien UMR CNRS 5516
18 rue Benoit Lauras, 42000 Saint-Etienne, France
E-mail:
Raimondo Schettini
Università degli Studi di Milano-Bicocca
Piazza dell’Ateneo Nuovo 1, 20126 Milano, Italy
E-mail:
Shoji Tominaga
Chiba University
1-33, Yayoi-cho, Inage-ku, Chiba-shi, Chiba, 263-8522, Japan
E-mail:
Library of Congress Control Number: 2009930845
CR Subject Classification (1998): I.4, I.3, I.5, I.2.10, F.2.2
LNCS Sublibrary: SL 6 – Image Processing, Computer Vision, Pattern Recognition,
and Graphics
ISSN
ISBN-10
ISBN-13
0302-9743
3-642-03264-8 Springer Berlin Heidelberg New York
978-3-642-03264-6 Springer Berlin Heidelberg New York
This work is subject to copyright. All rights are reserved, whether the whole or part of the material is
concerned, specifically the rights of translation, reprinting, re-use of illustrations, recitation, broadcasting,
reproduction on microfilms or in any other way, and storage in data banks. Duplication of this publication
or parts thereof is permitted only under the provisions of the German Copyright Law of September 9, 1965,
in its current version, and permission for use must always be obtained from Springer. Violations are liable
to prosecution under the German Copyright Law.
springer.com
© Springer-Verlag Berlin Heidelberg 2009
Printed in Germany
Typesetting: Camera-ready by author, data conversion by Scientific Publishing Services, Chennai, India
Printed on acid-free paper
SPIN: 12701643
06/3180
543210
Preface
We would like to welcome you to the proceedings of CCIW 2009, the Computational
Color Imaging Workshop, held in Saint-Etienne, France, March 26–27, 2009.
This, the second CCIW, was organized by the University Jean Monnet and the Laboratoire Hubert Curien UMR 5516 (Saint-Etienne, France) with the endorsement of
the International Association for Pattern Recognition (IAPR), the French Association
for Pattern Recognition and Interpretation (AFRIF) affiliated with IAPR, and the
"Groupe Français de l'Imagerie Numérique Couleur" (GFINC).
The first CCIW was organized in 2007 in Modena, Italy, with the endorsement of
IAPR. This workshop was held along with the International Conference on Image
Analysis and Processing (ICIAP), the main conference on image processing and
pattern recognition organized every two years by the Group of Italian Researchers on
Pattern Recognition (GIRPR) affiliated with the International Association for Pattern
Recognition (IAPR).
Our first goal, since we began the planning of the workshop, was to bring together
engineers and scientists from various imaging companies and from technical communities all over the world to discuss diverse aspects of their latest work, ranging from
theoretical developments to practical applications in the field of color imaging, color
image processing and analysis. The workshop was therefore intended for researchers
and practitioners in the digital imaging, multimedia, visual communications, computer
vision, and consumer electronic industry, who are interested in the fundamentals of
color image processing and its emerging applications.
We received many excellent submissions. Each paper was reviewed by three reviewers, and then the general chairs carefully selected only 23 papers in order to
achieve a high scientific level at the workshop. The final decisions were based on the
criticisms and recommendations of the reviewers and the relevance of papers to the
goal of the workshop. Only 58% of the papers submitted were accepted for inclusion
in the program.
In order to have an overview of current research directions in computational color
imaging six different sessions were organized:
•
•
•
•
•
•
Computational color vision models
Color constancy
Color image/video indexing and retrieval
Color image filtering and enhancement
Color reproduction (printing, scanning, and displays)
Multi-spectral, high-resolution and high dynamic range imaging
In addition to the contributed papers, four distinguished researchers were invited
to this second CCIW to deliver keynote speeches on current research directions in hot
topics on computational color imaging:
VI
Preface
• Hidehiko Komatsu, on Information Processing in Higher Brain Areas
• Qasim Zaidi, on General and Specific Color Strategies for Object
Identification
• Theo Gevers, on Color Descriptors for Object Recognition
• Gunther Heidemann, on Visual Attention Models and Color Image Retrieval
There are many organizations and people to thank for their various contributions to
the planning of this meeting. We are pleased to acknowledge the generous support of
Chiba University, the Dipartimento di Informatica Sistemistica e Comunicazione di
Università degli Studi di Milano-Bicocca, the Région Rhones-Alpes and Saint-Etienne
Métropole. Special thanks also go to all our colleagues on the Conference Committee
for their dedication and work, without which this workshop would not have been
possible.
Finally, we envision the continuation of this unique event, and we are already making plans for organizing the next CCIW workshop in Milan in 2011.
April 2009
Alain Trémeau
Raimondo Schettini
Shoji Tominaga
Organization
Organizing Committee
General Chairs
Alain Trémeau (Université Jean Monnet,
Saint-Etienne, France)
Raimondo Schettini (Università di Milano-Bicocca,
Milan, Italy)
Shoji Tominaga (Chiba University, Chiba, Japan)
Program Committee
Jesus Angulo
James K. Archibald
Sebastiano Battiato
Marco Bressan
Majeb Chambah
Cheng-Chin Chiang
Bibhas Chandra Dhara
Francesca Gasparini
Takahiko Horiuchi
Hubert Konik
Patrick Lambert
J. Lee
Jianliang Li
Peihua Li
Chiunhsiun Lin
Ludovic Macaire
Lindsay MacDonald
Massimo Mancuso
Jussi Parkkinen
Steve Sangwine
Gerald Schaefer
Ishwar K. Sethi
Xiangyang Xue
Rong Zhao
Silvia Zuffi
Ecole des Mines de Paris, France
Brigham Young University, USA
Università di Catania, Italy
Xerox, France
Université de Reims, France
National Dong Hwa University, Taiwan
Jadavpur University, India
Università di Milano-Bicocca, Italy
Chiba University, Japan
Université de Saint-Etienne, France
Université de Savoie, France
Brigham Young University, USA
Nanjing University, P.R. China
Heilongjiang University, China
National Taipei University, Taiwan
Université de Lille, France
London College of Communication, UK
STMicroelectronics, France
University of Joensuu, Finland
University of Essexs, UK
Aston University, UK
Oakland University, Rochester, USA
Fudan University, China
Stony Brook University, USA
CNR, Italy
Local Committee
Eric Dinet
Damien Muselet
Laboratoire Hubert Curien, Saint-Etienne, France
Laboratoire Hubert Curien, Saint-Etienne, France
VIII
Organization
Frédérique Robert
Dro Désiré Sibidé
Xiaohu Song
IM2NP UMR CNRS 6242, Toulon, France
Laboratoire Hubert Curien, Saint-Etienne, France
Laboratoire Hubert Curien, Saint-Etienne, France
Sponsoring Institutions
Laboratoire Hubert Curien, Saint-Etienne, France
Université Jean Monnet, Saint-Etienne, France
Région Rhône-Alpes, France
Saint-Etienne Métropole, France
Università di Milano-Bicocca, Milan, Italy
Chiba University, Japan
Table of Contents
Invited Talk
Color Information Processing in Higher Brain Areas . . . . . . . . . . . . . . . . . .
Hidehiko Komatsu and Naokazu Goda
1
Computational Color Vision Models
Spatio-temporal Tone Mapping Operator Based on a Retina Model . . . . .
Alexandre Benoit, David Alleysson, Jeanny Herault, and
Patrick Le Callet
Colour Representation in Lateral Geniculate Nucleus and Natural
Colour Distributions . . . . . . . . . . . . . . . . . . . . . . . . . . . . . . . . . . . . . . . . . . . . .
Naokazu Goda, Kowa Koida, and Hidehiko Komatsu
12
23
Color Constancy
Color Constancy Algorithm Selection Using CART . . . . . . . . . . . . . . . . . . .
Simone Bianco, Gianluigi Ciocca, and Claudio Cusano
31
Illuminant Change Estimation via Minimization of Color Histogram
Divergence . . . . . . . . . . . . . . . . . . . . . . . . . . . . . . . . . . . . . . . . . . . . . . . . . . . . . .
Michela Lecca and Stefano Messelodi
41
Illumination Chromaticity Estimation Based on Dichromatic Reflection
Model and Imperfect Segmentation . . . . . . . . . . . . . . . . . . . . . . . . . . . . . . . . .
Johji Tajima
51
Color Image/Video Indexing and Retrieval
An Improved Image Re-indexing Technique by Self Organizing Motor
Maps . . . . . . . . . . . . . . . . . . . . . . . . . . . . . . . . . . . . . . . . . . . . . . . . . . . . . . . . . . .
Sebastiano Battiato, Francesco Rundo, and Filippo Stanco
62
KANSEI Based Clothing Fabric Image Retrieval . . . . . . . . . . . . . . . . . . . . .
Yen-Wei Chen, Shota Sobue, and Xinyin Huang
71
A New Spatial Hue Angle Metric for Perceptual Image Difference . . . . . .
Marius Pedersen and Jon Yngve Hardeberg
81
Structure Tensor of Colour Quaternion Image Representations for
Invariant Feature Extraction . . . . . . . . . . . . . . . . . . . . . . . . . . . . . . . . . . . . . .
Jes´
us Angulo
91
X
Table of Contents
Color Image Filtering and Enhancement
Non-linear Filter Response Distributions of Natural Colour Images . . . . .
Alexander Balinsky and Nassir Mohammad
101
Perceptual Color Correction: A Variational Perspective . . . . . . . . . . . . . . .
Edoardo Provenzi
109
A Computationally Efficient Technique for Image Colorization . . . . . . . . .
Adrian Pipirigeanu, Vladimir Bochko, and Jussi Parkkinen
120
Texture Sensitive Denoising for Single Sensor Color Imaging Devices . . .
Angelo Bosco, Sebastiano Battiato, Arcangelo Bruna, and
Rosetta Rizzo
130
Color Reproduction (Printing, Scanning, Displays)
Color Reproduction Using Riemann Normal Coordinates . . . . . . . . . . . . . .
Satoshi Ohshima, Rika Mochizuki, Jinhui Chao, and Reiner Lenz
Classification of Paper Images to Predict Substrate Parameters Prior
to Print . . . . . . . . . . . . . . . . . . . . . . . . . . . . . . . . . . . . . . . . . . . . . . . . . . . . . . . . .
Matthias Scheller Lichtenauer, Safer Mourad, Peter Zolliker, and
Klaus Simon
140
150
A Colorimetric Study of Spatial Uniformity in Projection Displays . . . . .
Jean-Baptiste Thomas and Arne Magnus Bakke
160
Color Stereo Matching Cost Applied to CFA Images . . . . . . . . . . . . . . . . . .
Hachem Halawana, Ludovic Macaire, and Fran¸cois Cabestaing
170
JBIG for Printer Pipelines: A Compression Test . . . . . . . . . . . . . . . . . . . . .
Daniele Rav`ı, Tony Meccio, Giuseppe Messina, and Mirko Guarnera
180
Synthesis of Facial Images with Foundation Make-Up . . . . . . . . . . . . . . . . .
Motonori Doi, Rie Ohtsuki, Rie Hikima, Osamu Tanno, and
Shoji Tominaga
188
Multi-spectral, High-Resolution and High Dynamic
Range Imaging
Polynomial Regression Spectra Reconstruction of Arctic Charr’s
RGB . . . . . . . . . . . . . . . . . . . . . . . . . . . . . . . . . . . . . . . . . . . . . . . . . . . . . . . . . . .
J. Birgitta Martinkauppi, Yevgeniya Shatilova,
Jukka Kek¨
al¨
ainen, and Jussi Parkkinen
An Adaptive Tone Mapping Algorithm for High Dynamic Range
Images . . . . . . . . . . . . . . . . . . . . . . . . . . . . . . . . . . . . . . . . . . . . . . . . . . . . . . . . .
Jian Zhang and Sei-ichro Kamata
198
207
Table of Contents
XI
Material Classification for Printed Circuit Boards by Spectral Imaging
System . . . . . . . . . . . . . . . . . . . . . . . . . . . . . . . . . . . . . . . . . . . . . . . . . . . . . . . . .
Abdelhameed Ibrahim, Shoji Tominaga, and Takahiko Horiuchi
216
Supervised Local Subspace Learning for Region Segmentation and
Categorization in High-Resolution Satellite Images . . . . . . . . . . . . . . . . . . .
Yen-wei Chen and Xian-hua Han
226
Author Index . . . . . . . . . . . . . . . . . . . . . . . . . . . . . . . . . . . . . . . . . . . . . . . . . .
235
Color Information Processing in Higher Brain Areas∗
Hidehiko Komatsu1,2 and Naokazu Goda1,2
1
2
National Institute for Physiological Sciences, Okazaki, Japan
The Graduate University for Advanced Studies (SOKENDAI), Okazaki, Japan
Abstract. Significant color signal transformation occurs in the primary visual
cortex and neurons tuned to various direction in the color space are generated.
The resulting multi-axes color representation appears to be the basic principle
of color representation throughout the visual cortex. Color signal is conveyed
through the ventral stream of cortical visual pathway and finally reaches to the
inferior temporal (IT) cortex. Lesion studies have shown that IT cortex plays
critical role in color vision. Color discrimination is accomplished by using the
activities of a large number of color selective IT neurons with various
properties. Both discrimination and categorization are important aspects of our
color vision, and we can switch between these two modes depending on the task
demand. IT cortex receives top-down signal coding the task and this signal
adaptively modulates the color selective responses in IT cortex such that neural
signals useful for the ongoing task is efficiently selected.
1 Neural Pathway for Color Vision
Visual systems in the human and monkey brains have functional differentiation and
consists of multiple parallel pathways [1]. Color information is carried by specific
types of retinal cells and transmitted along specific fibers in the optic nerve [2][3].
Visual signals leaving the eye are relayed at the lateral geniculate nucleus (LGN) and
then reach to the primary visual cortex (or V1) situated at the most posterior part of
the cerebral cortex. LGN has multi-layered organization, and color information is
coded only at specific layers. Cerebral cortex contains a number of visual areas, and
these areas consist of two major streams of visual signals. Of these, color information
is carried by the ventral visual stream that is thought to be involved in visual
recognition of objects. Ventral visual stream starts from sub-regions in V1, include
sub-regions of area V2, area V4 and finally reaches to the inferior temporal cortex (or
IT cortex) (Fig. 1).
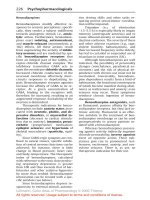
In humans, damage in the ventral cortical area around fusiform gyrus results in the
loss of color sensation (achromatopsia), so this area should play a critical role in color
vision. In the macaque monkey, a very good animal model of human color vision, IT
cortex plays a very important role in color vision because selective damage in the IT
∗
This work is supported by a Japanese Grant-in-Aid for Scientific Research (B) and a grant for
Scientific Research on Priority Areas from MEXT of Japan.
A. Trémeau, R. Schettini, and S. Tominaga (Eds.): CCIW 2009, LNCS 5646, pp. 1–11, 2009.
© Springer-Verlag Berlin Heidelberg 2009
2
H. Komatsu and N. Goda
Fig. 1. Visual pathway in the monkey brain related to color vision. V1: primary visual cortex,
V2: area V2, V4: area V4, IT: inferior temporal cortex. TE and TEO correspond to the anterior
and posterior part of IT.
cortex results in severe deficit in color discrimination [4-6]. In this paper, we will
describe our researches on how the color information is represented and transformed
at different stages of the visual pathway, and how the neuron activities in the IT
cortex are related to the behavior using color signals.
2 Representation of Color Information
Color vision originates from the comparison of signals of photoreceptors with
different spectral sensitivity functions. Humans and macaque monkeys have three
types of cone photoreceptors that are maximally sensitive to long (L), middle (M) and
short (S) wavelengths, and they are called L cone, M cone and S cone, respectively.
Comparison of signals from different types of cones occurs in the retinal circuit, and
the resulting difference signals are sent to LGN through the optic nerve. At this stage,
it has been known that color information is carried by two types of color selective
neurons, namely, red-green (R/G) color opponent neuron, and blue-yellow (B/Y)
color opponent neuron. The former type of cells code the difference between L-cone
and M-cone signals (either L-M or M-L). On the other hand, the latter type of cells
code the difference between S-cone signal and the sum of the signals from the
remaining two types of cones (S-(L+M)).
Different laboratories have used different color stimuli to characterize the color
selectivity of neurons. In our laboratory, we have used color stimuli based on the CIExy chromaticity diagram [7][8]. To study the color selectivity of a neuron, we used a
set of color stimuli that were systematically distributed on the chromaticity diagram
and mapped the responses on the diagram (Fig.2). Each color stimulus had the same
luminance, shape and area. Color stimuli were presented on the computer display one
by one at the same position in the receptive field of the recorded neuron. We
employed CIE-xy chromaticity diagram because of the general familiarity of this
Color Information Processing in Higher Brain Areas
3
Fig. 2. Color stimuli used in our laboratory that were systematically distributed in the
chromaticity diagram. A: Colors plotted on the CIE-xy chromaticity diagram. B: Colors
replotted on the MacLeod-Boynton (MB) chromaticity diagram. In both A and B, + indicates
the chromaticity coordinates of color stimuli distributed regularly on the CIE-xy chromaticity
diagram,
those of color stimuli distributed regularly on the MB chromaticity diagram, and
Δ the equal-energy white point. Cardinal axes in the MB diagram [L-M and S-(L+M)] are also
shown. From [8] with modification.
○
diagram, and because we can easily describe the color selectivity in terms of the
combination of cone signals because XYZ space on which CIE-xy diagram is based
and LMS space representing cone signals are connected by linear transformation. By
using this method, comparison of the color selectivity of neurons in LGN and V1 was
conducted [8]. Figure 3 left shows typical examples of color selectivity of LGN
neurons. Response magnitude to each color stimulus is expressed as the diameter of
the circle and plotted at the position in the chromaticity diagram that corresponds to
the chromaticity coordinates of the color. Open circle represents excitatory response
and filled circle represents inhibitory response. Cell 1 showed strong response to red
colors and exhibited no response to cyan to green colors. This is an example of R/G
color opponent neuron. Cell 2 showed strong excitatory responses to blue colors and
strong inhibitory responses to colors around yellow. This is an example of B/Y color
opponent neurons. In these diagrams, contour lines of the equal-magnitude responses
are also plotted. Like these example neurons, LGN neurons generally had straight
response contours.
To examine how the cone signals are combined to generate these neural responses,
response contours were re-plotted on the MacLeod-Boynton (MB) chromaticity
diagram [9] by using the cone spectral sensitivities as a transformation matrix [10],
and the direction in which the response magnitude most steeply changes (tuning
direction) was determined. Lower half of Figure 3 left shows the tuning directions of
38 LGN neurons recorded. They were concentrated only at very limited directions in
color space: two large peaks were observed at 0 deg and 180 deg. These correspond to
the difference signal between L and M cones: 0 deg corresponds to L-M signal, and
180 deg to M-L signal. Altogether, these peaks correspond to the R/G color opponent
4
H. Komatsu and N. Goda
Fig. 3. Left: Color selectivity of two example LGN neurons (top) and distribution of the tuning
directions of LGN neurons (bottom). Right: Color selectivity of two example V1 neurons (top)
and distribution of the tuning directions of V1 neurons (bottom). See text for the detail. From
[8] with modification.
neurons. There was a smaller peak at around 90 deg. This corresponds to the
difference signal between S cone signal and the sum of L and M cone signals, namely
S-(L+M) signal, and represent the B/Y color opponent neurons. We can think that, at
this stage, color is decomposed along two axes that consists of MB chromaticity
diagram, namely L-M and S-(L+M) axes. Different colors correspond to different
weighs on each of these axes.
Color is represented in V1 in a way quite different from that in LGN. Right half of
Figure 3 shows the color selectivity of two example neurons in V1. Compared with
LGN neurons, there were two major differences. First, tuning directions of V1
neurons widely vary and are not restricted in certain directions as observed in LGN.
The response contours of cell 3, for example, have orientation that is never observed
in LGN. Figure 3 right bottom shows tuning directions of 73 V1 neurons. They are
widely distributed across many directions in the color space. This indicates that
different hues are represented by different neurons in V1. These results indicate that
there is dramatic change in the way hue is represented between LGN and V1.
Secondly, many color selective V1 neurons had clearly curved response contours
(e.g. cell 4) that were unusual in LGN where neurons in principle had straight
response contours. Filled parts of bar graphs in Figure 3 indicate neurons in which a
model yielding curved response contours make the data fitting significantly better
than any model having only straight response contours. The curved response contours
enable to restrict the responses in any region in the chromaticity diagram, and can
generate sharp tuning to any hue. Therefore, the neural process involved in forming
the curved response contour must be closely related to the process of generating
selectivity to various hues in the cerebral cortex. We can also think about the
difference in color representation between LGN and V1 in the following way. The
Color Information Processing in Higher Brain Areas
5
neural pathway connecting the eye and V1 through LGN consists of only a limited
number of nerve fibers compared with the number of photoreceptors. In order to
transmit visual information efficiently under such constraint, color information is
encoded in a compressed form to reduce redundancy. In contrast, in the cerebral
cortex, the constraint of capacity is less severe because of the large volume of the
cortex, and different computational principle may dominate. It appears that visual
cortex took a strategy to explicitly represent different hues with different neurons.
Presumably, there is some biological advantage of representing hue independently by
different set of neurons.
3 Transformation of Color Signals in Early Visual Areas
Difference in color selectivities of neurons between LGN and V1 indicates that
significant transformation of color signal takes place in V1. Although actual neural
processing for the transformation is not known, two-stages model shown in Figure 4A
can explain the properties of V1 neurons quite well. At the first stage of the model,
signals from R/G color opponent neuron and B/Y color opponent neuron are linearly
summed with various combination of weights and then the resulting signal is rectified.
As the result of this first stage, neurons with straight response contours tuned to
various directions in the color space are formed. At the second stage, the signals from
multiple cells at the first stage are linearly summed and then rectified. As the results
of linear summation and rectification repeating twice, color selective neuron with
curved response contours sharply tuned to specific hue are formed. Figure 4B
Fig. 4. A: Two-stage model to explain the transformation of color selectivity in V1. B:
Responses of an example V1 neuron tuned to yellow (left), the outputs of the best model with a
single stage (middle), and the outputs of the best model with double stages (right).
6
H. Komatsu and N. Goda
illustrates the responses of an example V1 neuron tuned to yellow (real response), the
outputs of the best model with a single stage, and the outputs of the best model with
double stages.
4 Relationship between Neural Responses and Behavior in the
Inferior Temporal Cortex
Color selectivity tuned to specific hue is commonly observed in each stage of the
cortical visual pathway [11-15], and we believe this is the fundamental principle for
color representation in the cerebral cortex. Inferior temporal cortex (IT cortex), the
highest stage of the ventral stream, is thought to play a critical role in color vision
because its lesion cause severe deficits in color discrimination. Color selective
neurons tuned to specific hues are also found in IT cortex [7] (Fig. 5). To study how
color selective IT neurons contribute to color discrimination, the quantitative
relationship between color judgment in monkeys and the responses of color selective
IT neurons were examined [16]. Neuronal activities and behavior recorded
simultaneously while the monkeys performed a color judgment task were compared.
Color discrimination threshold was computed based on the responses of each color
selective IT neuron. To do this, we first computed the probability distribution function
of the response magnitudes for each color, and receiver-operating-characteristic
(ROC) analysis was conducted to compute the probability that an ideal observer can
discriminate two different colors separated at a certain distance in the color space.
Then, color discrimination threshold of individual neuron was computed based on the
relationship between the color difference and the probability of the correct response.
When the color discrimination thresholds based on the neuron activities and those
Fig. 5. Color selectivity of six examples neurons recorded from the IT cortex tuned to different
hues. Color selectivity of each neuron is represented as the response contours within the region
in the CIE-xy chromatcity diagram examined (broken line). In each panel, the thicker (thinner)
response contour indicates the locations where the responses are 75% (50%) of the maximum
response. From [7] with modification.
Color Information Processing in Higher Brain Areas
7
based on the monkey's behavior were compared, neural color discrimination threshold
was on average 1.5 times larger than that of the monkey, indicating that neural
sensitivity tended to be somewhat lower than the behavioral sensitivity.
On the other hand, it was found that there was a strong positive correlation
between neuron activity and monkey's behavior with regard to the way discrimination
threshold depends on color. CIE-xy chromaticity diagram is not a uniform color
space; in other words, even if two pairs of color had the same distance on the CIE-xy
chromaticity diagram, their differences may not be the same perceptually [17]. As the
result, discrimination threshold obtained by the monkey's behavior changes depending
on the position in the chromaticity diagram. It was examined how the neural color
discrimination threshold depends on the position in the chromaticity diagram and how
it is related to the behavioral threshold. To do this, the chromaticity diagram was
divided into 10 areas and the average discrimination thresholds in each area was
computed for both neuron and behavior. Relationship between the mean neural and
behavioral thresholds across different areas of the chromaticity diagram for one
monkey is shown in Figure 6. There was a strong positive correlation between these
two values and this clearly indicates that activities of color selective IT neurons are
closely correlated with the color discrimination behavior of the monkeys. To study
how individual IT neurons contribute to the monkey's color judgment, the correlation
between the trial-to-trial fluctuation of the neural responses and the color judgment of
the monkey was examined by the ideal-observer analysis [16]. It was found that
contribution of individual neuron is relatively small and that there is no systematic
relationship between the sensitivity to color difference or the sharpness of the color
selectivity of the neurons and the degree to which each neuron contribute to the color
judgment. These results suggest that signals from a large population of color selective
neurons with various properties, rather than a small subset of neurons with especially
high sensitivity, contribute to color perception and color discrimination behavior.
Fig. 6. Relationship between the mean neural and behavioral thresholds across different areas
of the chromaticity diagram for one monkey. Each symbol corresponds to different region in
the CIE-xy chromaticity diagram. See text for more detail. From [16] with modification.
8
H. Komatsu and N. Goda
5 Cognitive Control of Color-Related Behavior
In our daily life, we often treat similar though perceptually distinguishable colors in
the same way as a group and give the same name (e.g. green, red). Such categorical
perception is an important cognitive function and it enables to efficiently manage the
infinitely variable objects and events in the environment by our cognitive system with
finite resource for information processing. Such categorical perception is an important
aspect of our color perception. On the other hand, we make fine discrimination of
similar colors in certain situations such as when we scrutinize the food or clothes at
the shop. We can switch between these two functions, namely categorization and fine
discrimination, depending on the situation or the task demands. It is believed that the
prefrontal cortex plays central role in such cognitive control of visual behaviors [18].
However, it is not well understood how the neural responses in the visual cortical
areas are affected by the top-down signal from the prefrontal cortex coding the current
situation and how they are modulated depending on the task demands.
In order to understand how the cognitive control of color-related behavior using
color stimuli involves neurons in the visual cortex, the activities of the color selective
IT neurons of monkeys trained to perform a color categorization task and a fine
discrimination task were analyzed [19]. While a single IT neuron was recorded, above
two tasks were switched and it was examined how the neural responses change. In
each task, 11 color stimuli that were separated in a constant interval between red and
green on the CIE-xy chromaticity diagram were used. In the categorization task, one
of the 11 colors was presented as the sample, and the monkey judged whether the
sample was red or green. In the discrimination task, one of the 11 colors was
presented as the sample and that was followed by two similar colors (choice colors),
and the monkey had to select one of these choice colors that was the same as the
sample. In this latter task, the monkey had to discriminate colors even though both
were within the same color category (red or green). A majority of neurons (64%)
exhibited significant change in their responses to the sample color depending on the
ongoing task. Responses of four example neurons to the 11 sample colors are shown
in Figure 7. A large majority of these neurons (77%) showed stronger responses in the
categorization task, and the responses during passive viewing were similar to those
during the categorization task. These results suggest that the default of the cognitive
control is categorical judgment, and that IT neurons are in general more active in this
condition. It was also shown that, as the results of response change, neural signals
differentiating red category vs green category is enhanced during the categorization
task and suppressed during the discrimination task. Thus, the top-down signal
adaptively modulates the gain of the neural responses in IT cortex such that neural
signals useful for the ongoing task is efficiently selected. Interestingly, the color
selectivity of the neuron itself does not change despite the change in the response
amplitude, so these neurons can transmit precise color information regardless of the
task. This is in marked contrast from the prefrontal cortex where neurons exhibits
selectivity corresponding to the categorical judgment [20]. These results suggest that
cognitive control of visual behavior by the top-down signal from the prefrontal cortex
coding the current situation or ongoing task demand involves the adaptive modulation
of neuron activities in the visual cortex that carry precise sensory information.
Color Information Processing in Higher Brain Areas
9
Fig. 7. Responses of four example IT neurons that were modulated by the ongoing task.
Responses to the 11 sample colors recorded during the categorization task (solid line) and those
during the discrimination task (broken line) are indicated. Cells in a and b exhibited stronger
responses during the categorization task, and those in c and d during the discrimination task.
See text for more detail. From [19] with modification.
Figure 8 schematically illustrates how the color signals originating from the three
types of cones are transformed in the visual system, and how the cognitive control of
behavior using color stimuli are executed by the top-down signal from the prefrontal
Fig. 8. Schematic illustration of the color signal transformation and cognitive control of color
signals in the brain. IT: inferior temporal cortex, PFC: prefrontal cortex, PP: posterior parietal
cortex. See text for more detail.
10
H. Komatsu and N. Goda
cortex to the IT cortex. This schema is a hypothetical one based on incomplete
experimental data and it lacks several important aspects of color processing such as
the spatial processing of color signals. Nevertheless, color information can be
basically described in the three dimensional space because it stems from the activities
of three types of cones, and because of this, understanding of the neural processing of
color vision is probably the most advanced field across the entire visual neuroscience.
In this schema, we aimed to provide what we think is the essence of the neural
processing of color itself or hue, and hope this will be a useful schema to guide
further development of the research in color vision.
References
1. Maunsell, J.H., Newsome, W.T.: Visual processing in monkey extrastriate cortex. Annu.
Rev. Neurosci. 10, 363–401 (1987)
2. Komatsu, H.: Mechanisms of central color vision. Curr. Opin. Neurobiol. 8, 503–508
(1998)
3. Solomon, S.G., Lennie, P.: The machinery of colour vision. Nat. Rev. Neurosci. 8, 276–
286 (2007)
4. Heywood, C.A., Gaffan, D., Cowey, A.: Cerebral achromatopsia in monkeys. Eur. J.
Neurosci. 7, 1064–1073 (1995)
5. Buckley, M.J., Gaffan, D., Murray, E.A.: Functional double dissociation between two
inferior temporal cortical areas: perirhinal cortex versus middle temporal gyrus. J.
Neurophysiol. 77, 587–598 (1997)
6. Huxlin, K.R., Saunders, R.C., Marchionini, D., Pham, H.A., Merigan, W.H.: Perceptual
deficits after lesions of inferotemporal cortex in macaques. Cereb. Cortex 10, 671–683
(2000)
7. Komatsu, H., Ideura, Y., Kaji, S., Yamane, S.: Color selectivity of neurons in the inferior
temporal cortex of the awake macaque monkey. J. Neurosci. 12, 408–424 (1992)
8. Hanazawa, A., Komatsu, H., Murakami, I.: Neural selectivity for hue and saturation of
colour in the primary visual cortex of the monkey. Eur. J. Neurosci. 12, 1753–1763 (2000)
9. MacLeod, D.I., Boynton, R.M.: Chromaticity diagram showing cone excitation by stimuli
of equal luminance. J. Opt. Soc. Am. 69, 1183–1186 (1979)
10. Smith, V.C., Pokorny, J.: Spectral sensitivity of the foveal cone photopigments between
400 and 500 nm. Vision Res. 15, 161–171 (1975)
11. Lennie, P., Krauskopf, J., Sclar, G.: Chromatic mechanisms in striate cortex of macaque. J.
Neurosci. 10, 649–669 (1990)
12. Wachtler, T., Sejnowski, T.J., Albright, T.D.: Representation of color stimuli in awake
macaque primary visual cortex. Neuron 37, 681–691 (2003)
13. Kiper, D.C., Fenstemaker, S.B., Gegenfurtner, K.R.: Chromatic properties of neurons in
macaque area V2. Vis. Neurosci. 14, 1061–1072 (1997)
14. Zeki, S.: The representation of colours in the cerebral cortex. Nature 284, 412–418 (1980)
15. Conway, B.R., Moeller, S., Tsao, D.Y.: Specialized color modules in macaque extrastriate
cortex. Neuron 56, 560–573 (2007)
16. Matsumora, T., Koida, K., Komatsu, H.: Relationship between color discrimination and
neural responses in the inferior temporal cortex of the monkey. J. Neurophysiol. 100,
3361–3374 (2008)
Color Information Processing in Higher Brain Areas
11
17. MacAdam, D.L.: Visual sensitivities to color differences in daylight. J. Opt. Soc. Am. 32,
247–274 (1942)
18. Miller, E.K., Cohen, J.D.: An integrative theory of prefrontal cortex function. Annu. Rev.
Neurosci. 24, 167–202 (2001)
19. Koida, K., Komatsu, H.: Effects of task demands on the responses of color-selective
neurons in the inferior temporal cortex. Nat. Neurosci. 10, 108–116 (2007)
20. Freedman, D.J., Riesenhuber, M., Poggio, T., Miller, E.K.: A comparison of primate
prefrontal and inferior temporal cortices during visual categorization. J. Neurosci. 23,
5235–5246 (2003)
Spatio-temporal Tone Mapping Operator Based on a
Retina Model
Alexandre Benoit1, David Alleysson2, Jeanny Herault3, and Patrick Le Callet4
1
LISTIC 74940 Annecy le Vieux, 2 LPNC 38040 Grenoble, 3 Gipsa Lab 38402 Grenoble,
4
IRCCyN 44321 Nantes, France
Abstract. From moonlight to bright sun shine, real world visual scenes contain
a very wide range of luminance; they are said to be High Dynamic Range
(HDR). Our visual system is well adapted to explore and analyze such a
variable visual content. It is now possible to acquire such HDR contents with
digital cameras; however it is not possible to render them all on standard
displays, which have only Low Dynamic Range (LDR) capabilities. This
rendering usually generates bad exposure or loss of information. It is necessary
to develop locally adaptive Tone Mapping Operators (TMO) to compress a
HDR content to a LDR one and keep as much information as possible. The
human retina is known to perform such a task to overcome the limited range of
values which can be coded by neurons. The purpose of this paper is to present a
TMO inspired from the retina properties. The presented biological model allows
reliable dynamic range compression with natural color constancy properties.
Moreover, its non-separable spatio-temporal filter enhances HDR video content
processing with an added temporal constancy.
Keywords: High Dynamic Range compression, tone mapping, retina model,
color constancy, video sequence tone mapping.
1 Introduction
In this paper, we propose a method to compress High Dynamic Range images in order
to make visual data perceptible on display media with lower dynamic range
capabilities. HDR images are our real life visual world; our eyes perceive everyday a
wide variety of visual scenes with really different luminance values. Our visual
system is able to cope with such a wide variety of input signals and extract salient
information. However, we can notice that, as discussed in [1], neurons cannot code a
wide range of input values. Thus, at the retina level a compression process occurs in
order to preserve all relevant information in the coding process, including color.
A similar idea has been recently introduced with digital High Dynamic Range
imaging. It is now possible to create HDR images even with standard digital cameras
[2] or light simulation [3], nevertheless the development of HDR displays, which
would be able to render all the acquired data is still under development [4]. Current
displays are Low Dynamic Range and direct HDR image visualization would hide a
A. Trémeau, R. Schettini, and S. Tominaga (Eds.): CCIW 2009, LNCS 5646, pp. 12–22, 2009.
© Springer-Verlag Berlin Heidelberg 2009
Spatio-temporal Tone Mapping Operator Based on a Retina Model
13
large part of the information. An alternative is the development of Tone Mapping
Operators [5, 6] which allow HDR images to be rendered on standard LDR displays
and preserve most of the information to be seen. Nevertheless, as discussed in [7] a
HDR image cannot be perceived similarly to its LDR version. Human factors related
to this problem are not already known but some artifacts created by the tone mapping
conversion can already be measured [8]. They are related to halo effects and color
distortions and lead to naturalness corruption. Nevertheless, studies on the quality
perception [5, 6, 9] are the only current assessment solutions.
The current challenge is to design a TMO able to limit artifacts and preserve the
general ambiance of the original HDR visual scene. Several operators have already
been proposed and compared [6, 9] and lead to a wide variety of approaches. From
computer vision methods to the one inspired by the visual system, each TMO presents
a different approach and requires specific parameters set for each processed image. In
addition, a new challenge is related to video sequence processing and has not yet been
explored. The aim is to generate successive tone mapped images which allow a
natural perception sensation without temporal instabilities created by frame-by-frame
image optimization.
In this paper, we propose a new TMO based on a retina model. The approach
models retina local adaptation properties, as described in Meylan et al. work [10] and
is completed by specific spatio-temporal filters of the retina. The added contribution
involves retina processes which enable spatio-temporal noise removal, temporal
stability introduction and spectral whitening. The paper is presented as follows:
section 2 describes the proposed retina model and its properties for HDR
compression. Section 3 illustrates the effect of such a filter in the case of static and
dynamic content processing.
2 Retina Biological Model
The human retina architecture is based on cellular layers which process the visual
information from the photoreceptors visual data entry point to the ganglion cells
output. The input signals are locally processed step by step so that details, motion and
color information are enhanced and conditioned for high level analysis at the visual
cortex level. Here, we focus on the known parts of the human retina, which are
suitable for a Tone Mapping Operator design. The aim is to show that tone mapping is
already performed in low level vision so that higher level visual tasks are facilitated.
Furthermore, modeling these early vision properties leads to a fast and efficient TMO.
We choose to work with the model described in [1], which takes into account the
different low level processes occurring in the retina. We particularly focus on the
foveal vision area and its output called Parvocellular channel, which brings the details
and color information to the central nervous system. The aspects taken into account
are detailed in the following:
• Local luminance and local contrast adaptation at the photoreceptor and ganglion
cells levels. This biological property is directly linked to our dynamic range
compression topic.
14
A. Benoit et al.
• The spatio-temporal filtering occurring at the Outer Plexiform Layer level (OPL).
This filtering allows input image frequency spectrum to be whiten and enhances
image details. Moreover, its temporal properties allow noise reduction and
temporal stability.
• Color sampling: the input image is spatially sampled by sensors with different
color sensitivities. Our TMO allows gray scale and color images to be processed
in the same way and introduces color constancy properties.
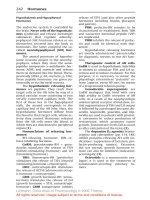
The architecture of the proposed model follows the biological model architecture and
is depicted on figure 1.
Fig. 1. Simplified model of the proposed retina model. Color processing is an additional
processing, which requires preliminary input image multiplexing and output picture
demultiplexing.
The input image can be either a raw gray image or a multiplexed color one. Then,
color processing appears as an additional processing, which consists of preliminarily
multiplexed color information followed by a filtering stage, then a demultiplexing
stage. The key-point of the model is actually the two local adaptation steps,
corresponding respectively to photoreceptors and ganglion cells, and the OPL filter
placed between them. As discussed in [1], the photoreceptor's local adaptation is
modulated by the OPL filter.
2.1 Local Adaptation
Photoreceptors are able to adjust their sensitivity with respect to the luminance of
their spatio-temporal neighborhood. This is modeled by the Michaelis-Menten [1]
relation, which is normalized for a luminance range of [0, Vmax] (Eq. 1). Vmax
represents the maximum pixel value in the image-255 in the case of standard 8 bits
images. It may vary greatly in case of High Dynamic Range images.
(1)
(2)
In this relation, the response C(p) of photoreceptor p depends on the current excitation
R(p) and on a compression parameter R0 (p) which is linearly linked to the local
Spatio-temporal Tone Mapping Operator Based on a Retina Model
15
Fig. 2. Photoreceptors local luminance adaptation. Left: output response with regard to the local
R0 (p) value. Right: effect on a HDR image (from: www.openexr.org).
luminance L(p) (cf. Eq.2) of the neighborhood of the photoreceptor p. This local
luminance L(p) is computed by applying a spatial low pass filter to the input image.
This low pass filtering is actually achieved by the horizontal cells network as
presented later on. Moreover, in order to increase flexibility and make the system
more accurate, we add in R0 (p) the contribution of a static compression parameter V0
of value range [0;1]. Compression effect is reinforced when V0 tends to 1 or is
attenuated when reaching 0. Photoreceptors V0 value is set to 0.7 as a generic
experimental value.
Figure 2 shows the evolution of sensitivity with respect to R0 (p) and illustrates the
effect of such a compression on a back-lit picture. Sensitivity is reinforced for low
values of R0 (p) and is kept linear for high values. As a result, this model enhances
contrast visibility in dark areas while maintaining it in bright areas.
2.2 OPL: Spatio-temporal Filtering and Contour Enhancement
The cellular interactions of the OPL layer can be modeled with a non-separable spatiotemporal filter [1] whose transfer function for 1D signal is defined in eq. (3) where fs
and ft denote respectively spatial and temporal frequency. Its transfer function is drawn
on figure 3.a. This filter can be considered as a difference between two low-pass spatiotemporal filters which model the photoreceptor network ph and the horizontal cell
network h of the retina. As discussed in [10, 1], the output of the horizontal cells
network (Fh) is very low spatial frequency limited and can be interpreted as the local
luminance L(p) required by the photoreceptors local adaptation step (eq. 2). Moreover,
Fh filter’s temporal low pass effect allows local luminance computation to be temporally
smoothed. Finally, as a general rule, global FOPL filter has a spatio-temporal high-pass
effect in low frequencies which results in a spectral whitening of the input. Its highfrequency low-pass effect enables the removal of the structural noise.
FOPL ( fs , ft ) = Fph ( fs , ft ) ⋅ (1 − Fh ( fs , ft ))
with Fi ( fs , ft ) =
with subscript i=ph or i=h.
1
1+ βi + 2α i (1 − cos(2π fs ))+ j2πτ i ft
(3)