102 185 1 PB
Bạn đang xem bản rút gọn của tài liệu. Xem và tải ngay bản đầy đủ của tài liệu tại đây (396.29 KB, 10 trang )
International Energy Journal: Vol. 6, No. 1, Part 3, June 2005
3-57
Environmental Assessment of Power
Generation From Bagasse at
a Sugar Factory in Thailand
D. Janghathaikul and Shabbir H. Gheewala
www.serd.ait.ac.th/reric
The Joint Graduate School of Energy and Environment
King Mongkut’s University of Technology Thonburi
91 Pracha Uthit Road, Bangmod, Tungkru, Bangkok 10140
THAILAND
ABSTRACT
Bagasse, the waste from sugar processing, is one of the biomass residues used as fuel. It can
thus be a useful renewable resource for energy which also promises to avoid the environmental
emissions of power generation from fossil fuels. Nevertheless, it should be confirmed that power
production from bagasse is friendly for the environment. Life Cycle Assessment (LCA) is a very useful
tool for such an evaluation. In this study, the LCA methodology is used for the environmental
assessment of energy production from bagasse at Ratchasima Sugar Mill, Thailand. The sugar mill
processes 30,000 tons of sugarcane per day. The power plant, attached to the sugar mill, is of
cogeneration type. The energy and water balance show that 272 tons of bagasse can produce 342
tons of steam at 420 C used in the sugar process and about 25.5 MWh of electricity. Since the carbon
in bagasse is part of the global carbon cycle, the CO2 emission from the combustion of bagasse does
not contribute to global warming. Therefore, the study focuses on the acidifying gases, NOx and SOx,
which are also of concern in fossil-based power generation. A low amount of nitrogen (1.82%) and
sulphur (<1%) in bagasse and low combustion temperatures contribute to low NOx and SO2 formation.
Consequently, bagasse can be an environmentally-friendly raw material for power generation and
has high potential as an alternate, renewable source of energy.
1.
INTRODUCTION
Environmental issues are becoming more significant than in the past especially in the energy
sector since it is a large emitter of pollutants [1]. The environmental constraints are leading to a rising
interest in methods of improving efficiency of the energy sector [2]. Thailand’s government has been
concerned the management and development of indigenous resources and environment. The Electricity
Generating Authority of Thailand (EGAT) has adjusted its strategic planning and implementation to
enhance sustainable development by efficient use of natural energy resource, adopting advanced,
cleaner and more efficient technologies for power plants, and also maximizing non-utility generation
by encouraging small power producers (SPPs) to supply the power system with electricity fuelled with
agricultural and industrial wastes [3].
Alternative energy is expected to reduce the import of conventional energy resources.
Renewable energy is an option which may be indigenous as well as environmentally sound. Solar
energy has been developed in Thailand but the application processes are limited, primarily due to the
high initial cost. Nevertheless, research, development and demonstration of solar thermal equipment
and systems should be supported. Wind energy in Thailand is used mainly for water pumping, roof
ventilation and generating electricity. Unfortunately, wind energy for electricity generation is limited
to some coastal areas and the central plain of Thailand [4]. Biomass energy is defined as energy from
crops, agricultural residues and municipal solid waste. Thailand has high potential to utilize agricultural
waste for electricity generation. Biomass is as important renewable source of energy for the region and
3-58
International Energy Journal: Vol. 6, No. 1, Part 3, June 2005
since its combustion practically generates no net carbon dioxide emission, its development and
utilization has been more rigorously promoted in the region. The preferably residue types identified
are bagasse, rice husk, waste wood, etc.
Bagasse is one of the most viable biomass fuels. Thailand has about 50 sugar factories which
are the resource of this material. Bagasse is utilized presently by sugar mills as boiler fuel or as fiber
material for attached medium density fiberboard (MDF) and particleboard factories [5]. Although,
biomass energy is reported to be better for the environment when compared with fossil fuels,
environmental assessment should conducted for verification. The objectives of this study are to
calculate the energy and water balance and analyze the environmental impact of power generation
from bagasse by using life cycle methodology.
2.
SUGARCANE PRODUCTION IN THAILAND
Thailand has a climate suitable for cane cultivation. However, sugar cane cultivation, and
thus processing, is seasonal. The season lasts about 5 months per year, and the rest of the year the
sugar mills are closed for maintenance. According to the Office of Agricultural Economics, agricultural
production increased about 1.9 percent in 2000. The primary factors responsible were the weather, the
global recession and the relatively lower increase in the agricultural price index than in the consumer
price index [6]. Table 1 shows sugarcanes area and production by region of Thailand in the years 19982000. Thailand is the worlds sixth largest sugar producer and the twelfth largest consumer. Thai sugar
production in 1999/2000 was a record 5.72 million tons. Moreover, as per the 5-year strategic plan
(2004/08) for the sugar industry, developed recently to strengthen industrial competitiveness, the
production target aims to improve cane yield from the current 60 tons per hectare to 88 tons per hectare
[7].
Table 1 Sugar cane: Area and production by regions of Thailand, 1998 2000
Region
*
Northern
North-Eastern
Central Plain
Thailand (total)
Planted area (1,000 rai*)
1998
1999
2000
1,322 1,288
1,181
2,068 2,064
1,994
2,344 2,292
2,245
5,735 5,645
5,421
Production (1,000 tons)
1998
1999
2000
11,391
12,097 10,392
18,8596
20,342 18,153
20,081
21,054 20,525
50,332
53,494 49,070
6.25 rai = 1 ha
Note: Adapted from Thailand, Office of Agricultural Economics, Food and Agriculture Organization
of the United Nations)
3.
BAGASSE
Bagasse is the solid fibrous material which leaves the delivery opening of the last mill of the
tandem, after extraction of the juice. It is the residue from the milling of cane. Physical composition of
bagasse varies between rather narrow limits. Its moisture content most frequently is 45 to 50% and
around 50% of fibre content. The quantity of the bagasse varies between 24 and 30% by weight of
cane [8]. Bagasse is usually used as a combustible material in furnaces to produce steam, which in turn
is used to generate power. It is also used as the raw material for production of paper and as feed stock
for cattle.
3-59
International Energy Journal: Vol. 6, No. 1, Part 3, June 2005
Composition of bagasse from the Ratchasima Sugar Factory has been analyzed by using
CHONS analyzer. The physical properties such as moisture content and calorific value have also mean
measured and are shown in Table 2.
Table 2 Ultimate analysis of bagasse sample of Ratchasima Sugar Factorys power plant
4.
Component Name
Value
Carbon, C (%)
41.54
Hydrogen, H (%)
5.40
Oxygen, O (%)
33.14
Nitrogen, N (%)
1.83
Sulphur, S (%)
<1
Moisture content, m (%)
Calorific value,(GJ/t)
53
7.32
SITE STUDY
Based on the data available for the Ratchasima Sugar Factory in Nakorn Ratchasima, Thailand,
the mill capacity is 30,000 tons of sugarcane per day every day during the crushing season. The power
plant is cogeneration type with 2 water-tube boilers (each of capacity 300 ton/hour) and 2 steam
turbines (each of capacity 15 MW). The power plant stores bagasse from the milling process for
utilization in power processes appropriate for the 8 months and for the remaining 4 months they buy
other residues such as rice husk, wood waste to generate electricity.
Demineralized water is used in the boilers at start-up operation and condensate water from
sugar processes is reused thereafter. Therefore, water consumption for this power plant is closedloop, recycling water. Normally, the factory has to make-up water less than one time per year. Steam
generated in the boilers is used in the sugar processes and steam turbines. This power plant generally
operates at 24 MW, utilizing 16 MW for the sugar factory and power plant itself and selling the excess
8 MW to the grid under the SPP scheme.
Wastewater from the power plant is only the blow down water, which is about 5% of feed
water, is sent to wastewater pond. Oxidation pond is used to manage all of wastewater of the factory.
Heat from the flue gas is utilized in air-preheater and economizer. A multi-cyclone collects dust and fly
ash from the final flue gas before releasing it from the stack. Bottom and fly ash from combustion goes
to the landfill.
5.
RESULTS AND DISCUSSION
An LCA includes four phases, viz., (1) goal & scope definition, (2) inventory analysis, (3)
impact assessment, and (4) interpretation. The results follow the format of the life cycle methodology.
However, the impact assessment stage is not considered in this paper since useful interpretation can
be drawn directly by analyzing the inventory results.
3-60
5.1
International Energy Journal: Vol. 6, No. 1, Part 3, June 2005
Goal and Scope Definition
The goal of the study is to evaluate the environmental impact of power generation from
bagasse of Ratchasima Sugar Factorys power plant in the crushing season (180 days). Energy and
material balances are carried out to check the consistency of the collected data and also to compute
the efficiency of the power plant. The overall power production scheme is shown in Fig. 1. The
materials requirement for water treatment for using in boilers and wastes treatment; including air,
wastewater and solid waste management, are not included in the system boundaries as they are
anticipated to be quite less. Energy requirement for these processes is however included as part of the
demand for the power plant.
Flue gas
Che-river
water
Water treatment
Multi-cyclone
Bagasse
Power plant
Air
Electricity
Blow down water
Ash
Wastewater
treatment
Landfill
Fig. 1 System boundaries of the study
5.2
Functional Unit (FU)
The functional unit is defined for quantifying the function of the product, process or service
under consideration, which will be used for normalising the data in the inventory. Since this study
concerns energy generation from bagasse, the products are steam and electricity. To normalize the
data the functional unit has been set as 1 MWh of electricity.
5.3
Inventory Analysis
Data was collected from the Ratchasima Sugar Factorys power plant for computing the
energy balance, water balance, and emissions. The power plant is cogeneration system comprising 2
water-tube boilers and 2 steam turbines having capacity 300 ton/hr and 15 MW each, respectively.
Flow diagram of the studied power plant is shown in Fig. 2.
3-61
International Energy Journal: Vol. 6, No. 1, Part 3, June 2005
Flue gas
Bagasse
Ash
Boilers
Air Preheater
Economizer
Air
Deaerator
Blow down
Steam Header
Turbine in sugar process
Sugar
Process
Turbine generator
~
Bagasse and
ash line
Induced Draft Fan
&Feed water pump
IDF
Water line
Steam line
De-superheat
Air and flue
gas line
Electricity
Pressure Reduce Valve
PRV
Fig. 2 Flow diagram of Ratchasima Sugar Factorys power plant
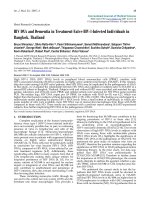
Energy and water balances are shown in Fig. 3. Bagasse combustion at the rate of 272 ton/h
results in energy production of 1991.05 GJ/h. This energy is utilized in the boilers to produce 605 ton/
h steam at 420ºC. 342 ton/h steam at 420ºC goes to the process in the sugar mill and 263 ton/h goes for
power generation (turbine generator and induced draft fan). 637 ton/h of condensate water from sugar
processes is returned to the power plant.
3-62
International Energy Journal: Vol. 6, No. 1, Part 3, June 2005
Flue gas
286.65 GJ/h (637 ton/h)
133.11 GJ/h
1,991.04 GJ/h
Steam to
sugar
process
1,114.92 GJ/h
Bagasse
Power plant
Radiation
loss
(342 ton/h)
9.96 GJ/h
857.38 GJ/h
Electricity
(263 ton/h)
36.13 GJ/h (32 ton/h)
Blow down water
29.87 GJ/h
Ash
energy (water)
Fig. 3 Energy and water balance in Ratchasima sugar factorys power plant
Energy balance calculation followed the first law of thermodynamics. From Fig. 3, the total
input energy is 1,972.3 GJ/h and the total output energy (excluding estimated losses) is 2,181.37 GJ/h.
Estimated energy losses from the power plant are about 209.07 GJ/h or about 9.2 % with blow down
water, flue gas, ash and radiation. The remaining 96.32 GJ/h, which is about 4% of the total input
energy, is unaccounted loss. The power plant efficiency is about 86-92% as calculated below.
The boiler efficiency has been calculated below by two methods (1) Input-output and (2)
Heat loss. The boiler efficiency is calculated in two ways as shows below. Further details are presented
in the Appendix.
1.
Efficiency by Input-output method
( M s × H s ) + ( M bw × H bw ) − ( M w × H w )
× 100 = % Efficiency
( M b × Hb )
where, Ms
Hs
Mbw
Hbw
Mw
Hw
Mb
Hb
=
=
=
=
=
=
=
=
Mass of steam generated = 605 t/h,
Enthalpy of steam generated at pressure 38 kg/cm2 and
temperature 420ºC = 3.26 GJ/t,
Mass of blow down water = 32 t/h,
Enthalpy of blow down water at 258ºC = 1.13 GJ/t,
Mass of feed water = 637 t/h,
Enthalpy of feed water at 108ºC = 0.45 GJ/t,
Quantity of bagasse consumption = 272 t/h, and
Low heating value of bagasse = 7.32 GJ/t.
Therefore, boiler efficiency works out to 86.48 %.
3-63
International Energy Journal: Vol. 6, No. 1, Part 3, June 2005
2.
Efficiency by Heat loss method
Concerning percentage of energy loss from flue gas, radiation and ash based on working
experience of plant engineer,
E0 Lfl Lr Lash = % Efficiency
where, E0
Lfl
Lr
Lash
=
=
=
=
Percentage of boiler efficiency without loss,
Percentage of loss from flue gas,
Percentage of loss from radiation, and
Percentage of loss from ash.
Therefore, boiler efficiency is;
100 6.69 - 0.5 - 1.5 = 91.31 %
Flue gas emissions from this power plant comprise of CO2, CO, NO2, SO2 and TSP at 141.5 °C
at flow rate of 833,981.1 m3/h. Since this power plant generates steam which is used both in the sugar
processes as well as for electricity production, the emissions due the flue gas must be allocated
according to the steam usage for the two cases. Steam consumption of electricity production of power
plant is 263 ton/h from the total steam generated, 605 tons/h. Therefore, only 43.5 % of the emissions
associated with the flue gas are allocated to electricity production.
The collected data of emissions is shown in Table 3. The table shows that the emissions of
SO2 and NO2 are very small amount, as anticipated from the low amount of nitrogen and sulphur in the
biomass and low combustion temperatures. Carbon dioxide emission from the power plant is not
considered since the carbon in the sugar cane (and hence, bagasse) is a part of global carbon cycle
and hence, does not contribute to global warming. Table 4 shows the emission intensities (in kg/
MWh) of CO2, CO, NO2, SO2, and TSP from coal-fired, oil-fired and natural gas power plants. The
overall emissions per MWh of electricity produced from all the three types of power plant are also
computed. The comparison of the selected emissions from fossil-based power plant and bagassebased electricity production from Ratchasima sugar factorys power plant are shown in Table 5.
Table 3 Emission data from the stack of Ratchasima sugar factorys power plant
Parameter
Amount
0.615 mg/m3
5.13 mg/m3
Mass flow rate
(kg/h)
0.22
1.86
Mass per FU
(kg/MWh)
0.009
0.07
SO2
NO2
CO
TSP
564.25 ppmv
306.12 mg/m3
255.7
110.98
10.03
4.35
Note: Stack property : Diameter 5.2 m., temperature 141.5ºC, velocity 5.44 m/s,
density 1.1798 kg/m 3, and flow rate is 833,981.1 m 3/h Only 43.5 % of the
emissions associated with the flue gas are allocated to electricity production.
3-64
International Energy Journal: Vol. 6, No. 1, Part 3, June 2005
Table 4 Emission intensities of each substance from power stations in Thailand in
fiscal year 2001 [10]
Types
Coal
Oil
Gas
Combined*
Electricity production,
MWh
17,338,580
12,947.2
56,247,083.1
73,598,610
SO2
Types
Tons
48,005
16.6
19
48,041
Coal
Oil
Gas
Combined*
*
CO2
Tons
Kg/MWh
22,011,748
1,269.52
10,521
812.61
31,997,720
568.88
54,019,989
733.98
Tons
3,421
3.52
11,070
14,495
NO2
Kg/MWh
2.77
1.28
0.0003
0.65
Tons
101,212
37
76,634
177,883
CO
Kg/MWh
0.197
0.27
0.197
0.197
TSP
Kg/MWh
5.84
2.86
1.36
2.42
Tons
633
12
2042
2686
Kg/MWh
0.037
0.927
0.036
0.036
Weighted average of Coal, oil and gas-fired power plants
Table 5 Comparison of selected emissions
Parameter
RSFPP 1
(kg/MWh)
SO2
NO2
CO2
CO
TSP
0.009
0.07
(non-fossil)
10.03
4.35
1
5.4
Coal
Power Plant
(kg/MWh)[10]
2.77
5.84
1,269.52
0.197
0.037
Oil
Combined
Natural gas Power Plant
Power Plant
(kg/MWh)
(kg/MWh)[10]
(kg/MWh)[10]
[10]
1.28
0.0003
0.65
2.86
1.36
2.42
812.61
568.88
733.98
0.27
0.197
0.196
0.927
0.036
0.036
RSFPP: Ratchasima Sugar Factorys Power Plant
Interpretation
Main part of bagasse is carbon and oxygen. There are small amounts of nitrogen (1.82%) and
sulphur (less than 1%) in bagasse. This combined with the fact that combustion temperatures are low,
results in low SO2 and NO2 formation. Thus, the SO2 emissions of the bagasse power plant are much
lesser than coal and oil-fired power plants. They are higher than natural gas power plants. However,
even though about 76% of the electricity is produced from natural gas, the SO2 emissions from the
bagasse power plant are lesser than the combined electricity production from all three types of
conventional fuels. For the case of NO2, the emissions from the bagasse power plant are much lesser
than all three types of conventional fuel plants. It must also be pointed out that even though the
conventional fuel power plants have facilities for SOX and NOX removal whereas the bagasse power
plant does not, the emissions of these gases are lower for the latter. Since both SO2 and NO2 contribute
to acidification and NO2 also contributes to photochemical ozone formation, these impacts will be
mitigated.
International Energy Journal: Vol. 6, No. 1, Part 3, June 2005
3-65
As stated earlier, since the CO2 from biomass combustion can be recycled in photosynthesis
during the growth of sugar cane, this emission does not contribute to global warming. This is a clear
advantage of the bagasse power plant since there are substantial emissions of CO2 from all the three
types of conventional fuel plants.
The CO emissions from the bagasse power plant are very high compared to the conventional
power plants. This may partly be due to incomplete combustion. Also, upsets in combustion conditions
can cause increases in emission of CO. This may also imply a need for improving the combustion
technology for biomass. However, since these are primary data, these values should be checked again.
Total suspended particulates (TSP) are also emitted in much higher amounts as compared to
the conventional power plants. Particulate matter in bagasse-fired boilers is caused by the turbulent
movement of combustion gases with respect to the burning bagasse and resultant ash. Soil (from
cane) characteristics such as particle size can affect the magnitude of particulate matter emitted from
the boiler. Cane that is improperly washed or incorrectly prepared can also influence the bagasse ash
content. These may be possible reasons for the high emissions of TSP. Also, the RSFPP has only
multi-cyclone for pretreatment of flue gas before releasing to the atmosphere. Adding other dust
removal equipment such as Electrostatic Precipitator (ESP) would reduce TSP emitted from the stack.
Overall, bagasse may be friendlier for the environment impact than fossil fuels as discussed
above. However, the issues of improving combustion and dust removal need to be addressed to realize
the potential adequately.
6.
ACKNOWLEDGEMENTS
The authors would like to thank the Joint Graduate School of Energy and Environment for
supporting this study. The kind cooperation of the Ratchasima Sugar Factory in providing permission
to carry out the study at their power plant and also providing relevant data for the study is also
acknowledged.
7.
REFERENCES
[1]
Sriperpun, S.; Tiwaree, R.S.; and Karuchit, S. 2003. Status and trend of greenhouse gases
emission in Thailand. In Proceedings of the Second Regional Conference on Energy
Technology towards a Clean Environment. Phuket, Thailand, 12-14 February.
Meyers, S.; Goldman, N.; Martin, N.; and Friedman, R. 2003. Prospects for the power sector in
nine developing countries. Energy Policy 21(11): 1123-1132.
Electricity Generating Authority of Thailand (EGAT). 2002. Annual Report 2002: Environmental
Responsibility. Oct.15, 2003.
Wibulswas, P. 2003. Sustainable energy development strategies for Thailand. In Proceedings
of the Second Regional Conference on Energy Technology towards a Clean Environment.
Phuket, Thailand, 12-14 February.
Junginger, M.; Faaij, A.; van den Broek, R.; Koopmans, A.; and Hulscher, W. 2001. Fuel
supply strategies for large-scale bio-energy projects in developing countries. Electricity
generation from agricultural and forest residues in Northeastern Thailand. Biomass &
Bioenergy 21(4): 259-275.
Biz Dimension Co., Ltd. 2003. Production Information : Sugar/Domestic Market/Growing
areas of sugarcane in Thailand. datacenter/product/
sugar/detail/dc_pi_sugar_04_01.htm, Oct. 16, 2003.
[2]
[3]
[4]
[5]
[6]
3-66
[7]
[8]
[9]
[10]
8.
International Energy Journal: Vol. 6, No. 1, Part 3, June 2005
Biz Dimension Co., Ltd. 2003. Production Information : Sugar/Domestic Market/Thai Sugar
Production. />dc_pi_sugar_04_02.htm, Oct. 16, 2003.
Hugot, E. 1986. Handbook of Cane Sugar Engineering. New York: Elsvier.
Graedel, T.E. 1998. Streamlined Life-Cycle Assessment. New Jersey: Prentice Hall.
Lohsomboon, P. and Jirajariyavech, A. 2003. Thailand: Final Report for the Project on Life
Cycle Assessment for Asian Countries-Phase III. Thailand Environment Institute.
APPENDIX
Energy Balance Calculation
1. Fuel bagasse input
2. Steam
Total heat input
Flow
Low heating value
272 x 7.32
Flow
Enthalpy (superheat)
Steam output from system boundary
• Steam for Turbine
Flow
in sugar process
• Steam for PRV.
Flow
(38 kg/cm2,420ºC)
Enthalpy (superheat)
Exhaust steam output from system boundary
• Exh. from TG
Flow
• Exh. from IDF &
Flow
Feed water pump
(1.5 kg/cm 2,200ºC)
Enthalpy (superheat)
3. Feed water input
Flow
Enthalpy (108ºC)
4. Blow down water
Flow
Enthalpy (258ºC)
5. Flue gas loss
Gas flow
Gas temperature
Mean gas specific heat
833,981.1 x (141.5-25) x 0.00137
=
=
Steam generated
(38 kg/cm2,420ºC)
(133.11/1991.04) x 100
6. Radiation loss (from furnace, boiler, air-heater)
0.5% x 1,991.04 GJ/h
7. Ash and other loss (%)
1.5% x 1,991.04 GJ/h
*
Based on working experience of plant engineer.
=
=
=
=
=
272
1,750
7.32
1,991.04
ton/h
kcal/kg
GJ/t
GJ/h
605
3.26
ton/h
GJ/t
235
ton/h
107
3.26
ton/h
GJ/t
204
59
ton/h
ton/h
2.87
637
0.45
32
1.13
833,981.1
141.5
0.00137
133,107.55
133.11
6.69
0.5 *
9.96
1.5 *
29.87
GJ/t
ton/h
GJ/t
ton/h
GJ/t
m3/h
ºC
J/m3ºC
MJ/h
GJ/h
%
%
GJ/h
%
GJ/h