Performance meansurement in finance firms funds and managers
Bạn đang xem bản rút gọn của tài liệu. Xem và tải ngay bản đầy đủ của tài liệu tại đây (2.26 MB, 395 trang )
PERFORMANCE MEASUREMENT
IN FINANCE
Butterworth-Heinemann Finance
aims and objectives
•
•
•
•
•
•
books based on the work of financial market practitioners and academics
presenting cutting edge research to the professional/practitioner market
combining intellectual rigour and practical application
covering the interaction between mathematical theory and financial practice
to improve portfolio performance, risk management and trading book performance
covering quantitative techniques
market
Brokers/Traders; Actuaries; Consultants; Asset Managers; Fund Managers; Regulators; Central
Bankers; Treasury Officials; Technical Analysts; and Academics for Masters in Finance and MBA
market.
series titles
Return Distributions in Finance
Derivative Instruments: theory, valuation, analysis
Managing Downside Risk in Financial Markets: theory, practice and implementation
Economics for Financial Markets
Global Tactical Asset Allocation: theory and practice
Performance Measurement in Finance: firms, funds and managers
Real R&D Options
series editor
Dr Stephen Satchell
Dr Satchell is Reader in Financial Econometrics at Trinity College, Cambridge; Visiting Professor
at Birkbeck College, City University Business School and University of Technology, Sydney. He
also works in a consultative capacity to many firms, and edits the journal Derivatives: use, trading
and regulations.
PERFORMANCE MEASUREMENT
IN FINANCE
Firms, Funds and Managers
Edited by
John Knight
Stephen Satchell
OXFORD AMSTERDAM BOSTON LONDON NEW YORK PARIS
SAN DIEGO SAN FRANCISCO SINGAPORE SYDNEY TOKYO
Butterworth-Heinemann
An imprint of Elsevier Science
Linacre House, Jordan Hill, Oxford OX2 8DP
225 Wildwood Avenue, Woburn MA 01801-2041
First published 2002
Copyright 2002, Elsevier Science Ltd. All rights reserved
No part of this publication may be reproduced in any material form (including
photocopying or storing in any medium by electronic means and whether
or not transiently or incidentally to some other use of this publication) without
the written permission of the copyright holder except in accordance with the
provisions of the Copyright, Designs and Patents Act 1988 or under the terms of
a licence issued by the Copyright Licensing Agency Ltd, 90 Tottenham Court Road,
London, England W1T 4LP. Applications for the copyright holder’s written
permission to reproduce any part of this publication should be addressed
to the publisher
British Library Cataloguing in Publication Data
Performance measurement in finance: firms, funds and
managers. – (Quantitative finance series)
1. Rate of return – Evaluation
2. Portfolio management –
Evaluation
3. Investment analysis
4. Investment advisors –
Rating of
5. Investments – Econometric models
I. Knight, John
II. Satchell, Stephen E.
332.6
Library of Congress Cataloguing in Publication Data
A catalogue record for this book is available from the Library of Congress
ISBN 0 7506 5026 5
For information on all Butterworth-Heinemann finance publications
visit our website at www.bh.com/finance
Typeset by Laserwords Private Limited, Chennai, India
Printed and bound in Great Britain
1 The financial economics of
performance measurement ............................
1
INTRODUCTION ......................................................
1
THE SHARPE RATIO ...............................................
4
THE TREYNOR MEASURE .....................................
4
THE JENSEN MEASURE ........................................
5
THE TREYNOR MAZUY MEASURE .....................
11
PARAMETRIC AND NON-PARAMETRIC TESTS
OF MARKET TIMING ABILITIES .............................
13
THE POSITIVE PERIOD WEIGHTING
MEASURE ................................................................
19
CONDITIONAL PERFORMANCE EVALUATION ....
20
THE 4-INDEX MODEL OF PERFORMANCE
EVALUATION ...........................................................
22
CARHARTS 4-FACTOR MODEL ............................
23
RISK-ADJUSTED PERFORMANCE ........................
24
STYLE/RISK-ADJUSTED PERFORMANCE ............
25
THE SHARPE STYLE ANALYSIS ............................
26
THREE INNOVATIVE MEASURES THAT
CAPTURE THE DIFFERENT FACES OF A
MANAGERS SUPERIOR ABILITIES ......................
27
DYNAMICS OF PORTFOLIO WEIGHTS:
PASSIVE AND ACTIVE MANAGEMENT .................
31
THE PORTFOLIO CHANGE MEASURE .................
34
THE MOMENTUM MEASURES ...............................
38
THE HERDING MEASURES ....................................
40
STOCKHOLDINGS AND TRADES MEASURE .......
43
CONCLUSION ..........................................................
46
REFERENCES .........................................................
47
2 Performance evaluation: an
econometric survey ........................................
INTERNATIONAL EMPIRICAL RESULTS OF
PERFORMANCE ......................................................
67
CONCLUSION AND FUTURE RESEARCH ............
69
REFERENCES .........................................................
70
3 Distribution of returns generated by
stochastic exposure: an application to
VaR calculation in the futures markets.........
INTRODUCTION ......................................................
74
DISTRIBUTION OF PERFORMANCE RETURNS ...
75
IMPLICATIONS FOR VAR CALCULATIONS ...........
78
ACTIVELY TRADING THE FUTURES
MARKETS ................................................................
79
CONCLUSION ..........................................................
88
ACKNOWLEDGEMENTS .........................................
89
REFERENCES .........................................................
89
4 A dynamic trading approach to
performance evaluation .................................
INTRODUCTION ......................................................
TRADITIONAL PERFORMANCE MEASURES ........
92
A NEW PERFORMANCE MEASURE ......................
94
SAMPLING ERROR .................................................
97
HEDGE FUNDS AND HEDGE FUND RETURNS ....
99
EVALUATION OF HEDGE FUND INDEX
PERFORMANCE ......................................................
102
CONCLUSION ..........................................................
105
REFERENCES .........................................................
106
5 Performance benchmarks for
institutional investors: measuring,
monitoring and modifying investment
behaviour .........................................................
INTRODUCTION ......................................................
109
WHAT BENCHMARKS ARE CURRENTLY
USED BY INSTITUTIONAL INVESTORS? ..............
109
WHAT ARE THE ALTERNATIVES? ........................
124
BENCHMARKS BASED ON LIABILITIES ................
128
WHAT HAPPENS IN OTHER COUNTRIES? ..........
135
CONCLUSION ..........................................................
137
APPENDIX: DERIVING THE POWER
FUNCTION ...............................................................
138
REFERENCES .........................................................
140
6 Simulation as a means of portfolio
performance evaluation .................................
INTRODUCTION ......................................................
143
OBJECTIVES OF SIMULATIONS ............................
145
METHODOLOGY .....................................................
146
ADVANTAGES OF SIMULATION ............................
146
EXAMPLES OF PORTFOLIO SIMULATION ...........
147
APPLICATIONS .......................................................
157
SUMMARY AND CONCLUSIONS ...........................
159
7 An analysis of performance measures
using copulae ..................................................
INTRODUCTION ......................................................
161
PERFORMANCE MEASURES ................................
162
EMPIRICAL RESULTS .............................................
166
COPULAE ................................................................
180
AN AGGREGATE PERFORMANCE MEASURE .....
193
CONCLUSIONS .......................................................
195
REFERENCES .........................................................
196
8 A clinical analysis of a professionally
managed portfolio...........................................
INTRODUCTION ......................................................
THE PORTFOLIO .....................................................
199
THE DATA ................................................................
200
THE ANALYSES ......................................................
201
CONCLUSIONS .......................................................
226
ACKNOWLEDGEMENT ...........................................
226
REFERENCES AND FURTHER READING .............
227
9 The intertemporal performance of
investment opportunity sets ..........................
INTRODUCTION ......................................................
INVESTMENT OPPORTUNITY SETS WITH
CONTINUOUS RISK STRUCTURES ......................
232
MEASURING THE PERFORMANCE OF
INVESTMENT OPPORTUNITY SETS .....................
234
RATIONALITY RESTRICTIONS ON
CONDITIONAL RETURN MOMENTS AND GMM
ESTIMATION ............................................................
238
EMPIRICAL ANALYSES ..........................................
246
CONCLUDING REMARKS .......................................
255
ACKNOWLEDGEMENTS .........................................
256
REFERENCES AND FURTHER READING .............
256
10 Performance measurement of portfolio
risk based on orthant probabilities ...............
INTRODUCTION ......................................................
262
ORTHANT PROBABILITY DESCRIPTION OF
PORTFOLIO DISTRIBUTIONS ................................
264
IMPLICATIONS FOR ABSOLUTE AND
RELATIVE RISK .......................................................
271
EMPIRICAL COMPARISONS USING
SIMULATED LONG/SHORT INVESTMENT
STRATEGIES ...........................................................
274
CONCLUSIONS .......................................................
282
ACKNOWLEDGEMENTS .........................................
283
REFERENCES .........................................................
283
11 Relative performance and herding in
financial markets.............................................
INTRODUCTION ......................................................
A MODEL WITH LINEAR TECHNOLOGIES ............
295
A MARKET MODEL .................................................
305
EXTENSIONS ..........................................................
316
CONCLUDING REMARKS .......................................
317
APPENDIX ...............................................................
318
REFERENCES .........................................................
326
12 The rate-of-return formula can make a
difference .........................................................
INTRODUCTION ......................................................
ALTERNATIVE METHODOLOGIES TO
MEASURE PERFORMANCE ...................................
331
CONTRASTING THE METHODS ............................
332
CONCLUSION - SUMMARIZING THE
FINDINGS ................................................................
339
REFERENCES .........................................................
341
13 Measurement of pension fund
performance in the UK ...................................
INTRODUCTION ......................................................
PREVIOUS EVIDENCE ON PERFORMANCE
OF MANAGED FUNDS ............................................
343
MEASURING FUND PERFORMANCE ....................
346
DATA ........................................................................
348
RESULTS .................................................................
352
CONCLUSIONS .......................................................
361
ACKNOWLEDGEMENTS .........................................
363
REFERENCES .........................................................
364
Preface
The purpose of this book is to bring together recent research on performance
measurement, from both academic and practitioner perspectives. As in previous edited works by ourselves, we start with some survey chapters to allow
readers to refresh their knowledge.
Before we describe the contents of this book, it is worth considering a
number of themes in performance measurement that are of current interest.
First, there are issues such as how to deal with complex multi-period portfolio
returns where the assets may be derivatives and returns non-linear and nonnormal. Second, there are issues to do with short performance histories; third,
there are problems to do with benchmark failure as many indices have recently
experienced unprecedented levels of entry and exit. Finally, there are deep
issues connecting the volatility of markets to the use of benchmarks; if all
managers are rewarded in the same way and are measured against the same
yardsticks, we get herding behaviour and the possibilities of excess volatility
and panic.
While the book does not claim to answer and resolve all the above questions
and issues, it does address them.
The first chapter by Nathalie Farah deals with the financial theory relevant to performance measurement. Next, Guoqiang Wang discusses issues of
econometrics and statistics associated with performance measurement.
Dr Emmanuel Acar and Andrew Pearson discuss the real-world problems
associated with stochastic exposures, i.e. when portfolio weights are themselves random. Focusing on Value at Risk, they show how awareness of
stochastic exposures/stochastic cash flow information can be incorporated into
an improved performance measurement methodology.
Gaurav Amin and Dr Harry Kat use recent theoretical results to evaluate performance in hedge funds, their methodology is particularly suited to
dynamic trading strategies.
xii Preface
Professor David Blake and Professor Allan Timmermann investigate the
merits of different benchmarks used in the UK and USA. This is a research
area of great topicality as indices such as the FT100 have recently been found
wanting as a choice of benchmark.
Frances Cowell brings a practitioner’s perspective onto the issue of performance evaluation via simulation and the methodology that lies behind a
performance simulator.
Dr Soosung Hwang and Professor Mark Salmon use the theory of copulae
and 14 UK investment trusts to analyse the non-linear dependency properties
of standard performance measures. For those not familiar with copula theory,
this is a powerful technique for modelling non-standard correlations.
Professor Bob Korkie, who has made many important contributions to performance issues in finance, has contributed two chapters. The first is a detailed
case study of a Canadian investment company, Nesbitt Burns. The second,
joint with Dr Turtle, is a theoretical paper addressing the changing opportunity
set in an intertemporal context. This set is equivalent to the feasible meanvariance space in a one period world and hence one can measure performance
by considering frontier slopes.
Dr Mark Lundin and Dr Stephen Satchell investigate performance issues
in a long–short framework and advocate a particular measure of risk.
Dr Emanuela Sciubbia presents an analysis of performance from the
perspective of economic theory.
David Spaulding considers the important issue of how to calculate rates of
return. His chapter contrasts various methods and demonstrates that the differences can be significant. Professor Ian Tonks, in the final chapter, presents
an analysis of UK pension fund performance focusing on whether there is an
optimal fund size.
John Knight and Stephen Satchell
Contributors
Emmanuel Acar works at Citibank as a Vice-President within the FX Engineering Group. He was previously (since 1990) a proprietary trader at Dresdner Kleinwort Benson, BZW, and Banque Nationale de Paris’ London Branch.
He has experience in quantitative strategies, as an actuary and from having
done his PhD on the stochastic properties of trading rules.
Gaurav S. Amin graduated as a Bachelor of Commerce from the University of Mumbai, India. He holds an MBA from Narsee Monjee Institute of
Management Studies, Mumbai, India, and an MSc (with Distinction) in International Securities, Investment and Banking from the ISMA Centre at the
University of Reading, UK. He is currently pursuing a PhD degree at the
ISMA Centre, doing research on hedge fund performance.
David Blake is Professor of Financial Economics at Birkbeck College in the
University of London and Chairman of Square Mile Consultants, a training
and research consultancy. Formerly Director of the Securities Industry Programme at City University Business School and Research Fellow at both the
London Business School and the London School of Economics. His research
interests include the modelling of asset demands and financial innovations, the
investment behaviour and performance of pension funds and mutual funds,
and pension plan design. He has published in major economics and finance
journals in all these fields. He is author of numerous books on financial topics,
the most recent of which is Financial Market Analysis.
Frances Cowell works in London for Vestek-Quantec, a subsidiary of Thomson Financial. Before joining Quantec in 1998, she was part of the Quantitative
Investments team at Natwest Investment Management in Sydney, where she
was responsible for domestic and international indexed equity portfolios and
xiv Contributors
indexed balanced portfolios. Experience in applying quantitative solutions to
domestic equity portfolios has enabled her to proceed to construct investment
strategies combining physical assets and derivatives; exploiting inconsistent
pricing between related instruments; and subsequently to design portfolios
with pre-specified return and risk characteristics.
Nathalie Farah is a PhD candidate at the Faculty of Economics and Political Science at the University of Cambridge. She is researching in portfolio
theory and performance measurement. She completed her MSc in Finance
and Economics at the London School of Economics after obtaining her BA
in Economics at the American University of Beirut, Lebanon. She plans to
make a career in investment consulting.
Soosung Hwang is a Lecturer in Finance in the Faculty of Finance and the
Deputy Director of the Financial Econometrics Research Centre, City University Business School, London. He is also an Honorary Research Associate of
the Department of Applied Economics, Cambridge University. He received
his PhD from Cambridge University and his research interests include finance,
financial econometrics and forecasting.
Harry M. Kat is currently Associate Professor of Finance at the ISMA Centre
Business School at the University of Reading. Before returning to academia
he was Head of Equity Derivatives Europe at Bank of America in London,
Head of Derivatives Structuring and Marketing at First Chicago in Tokyo and
Head of Derivatives Research at MeesPierson in Amsterdam. Dr Kat holds
MBA and PhD degrees in Economics and Econometrics from the Tinbergen Graduate School of Business at the University of Amsterdam. He is a
member of the editorial board of The Journal of Derivatives and The Journal
of Alternative Investments and has (co-)authored numerous articles in wellknown finance journals such as The Journal of Financial and Quantitative
Analysis, The Journal of Derivatives, The Journal of Financial Engineering,
Applied Mathematical Finance and The Journal of Alternative Investments.
His new book Structured Equity Derivatives was published in July 2001 by
John Wiley & Sons.
Bob Korkie is Head of Investment Research and Risk Management at
OPTrust. He is formerly Professor of Finance at the University of Alberta and
has been a visiting professor in Austria, France, Turkey and the United States.
He is an affiliate member of the Society of Financial Analysts, and principal of
Contributors xv
RMK Financial Consulting. He has an undergraduate degree in Engineering,
an MBA (both Saskatchewan) and a PhD (University of Washington). His
research has been published in numerous financial journals and magazines.
Mark Lundin is the Head of Quantitative Research at Fortis Investment
Management in Brussels. His interests and activities primarily involve the
application of advanced techniques to investing in and trading the financial
markets. Before joining Fortis, Mark was a Research Scientist at Olsen &
Associates Research Institute for Applied Economics in Zurich where he
developed real-time, high-frequency trading models and performed multivariate financial research. Mark is an ongoing external technical referee for Risk
Magazine and an independent referee for IEEE Transactions on Neural Networks in Financial Engineering. He holds a PhD in Particle Physics from
Universit´e Louis Pasteur, Strasbourg, and a BS in Mathematics and Computer
Science from the University of Illinois.
Andrew Pearson is currently Vice-President within the FX Analytics group
at Citibank. Previously he worked as a quantitative analyst for Citibank FX
Options Technology. His PhD was in Theoretical Physics at Imperial College,
London.
Mark Salmon joined City University Business School in 1997 having previously been Professor of Economics and Chair of the Economics Department
at the European University Institute, Florence. He had earlier held appointments at the University of Warwick, the Australian National University, the
Bank of England and the London Business School and visiting appointments
at Nuffield College Oxford, Princeton, Paris I Sorbonne, Aix-Marseille, Bordeaux IV and Illinois. He has served as a consultant to a number of city
institutions and was recently a member of a ‘Task Force’ set up by the European Commission to consider exchange rate policy for the euro. He has been
a member of the European Financial Markets Advisory Panel and has worked
with the National Bank of Hungary on transition policies towards membership of the European Union. He currently acts as a consultant to the Bank
of England. He is a Research Fellow of the Centre for Economic Policy
Research associated with the International Macro and Finance Programmes
and has published widely in journals such as Econometrica, The Annals of
Statistics, Journal of Econometrics, the Economic Journal, the Journal of
Economic Dynamics and Control and the International Economic Review.
His most recent book is a graduate level textbook on Financial Econometrics.
xvi Contributors
Mark is also Deutsche Morgan Grenfell Professor of Financial Markets and
Director of the Financial Econometrics Research Centre.
Emanuela Sciubba is Fellow of Newnham College and University Lecturer
in Economics at the University of Cambridge. She was previously a research
fellow at the Tinbergen Institute in Rotterdam and at Ente Einaudi (Bank
of Italy) in Rome. She received an MA in Business and Economics from
LUISS University in Rome and a PhD in Economics from the University
of Cambridge. She has been invited to present her work at universities and
research institutes all over Europe and in the United States. Her research
interests and writings have covered a variety of topics in economic theory and
finance, including evolutionary finance and the survival of portfolio rules, the
role of asymmetric information in dynamic financial markets, the implications
of relative performance for portfolio choices and asset pricing, the implications
of relative performance for risky choices in banking and the effect of entry
in the banking sector.
David Spaulding is President of The Spaulding Group, Inc., a Somerset, NJbased consulting, publishing and research firm that provides services to the
money management industry. He is the founder and publisher of The Journal
of Performance Measurement and the author of Measuring Investment Performance – Calculating and Evaluating Investment Risk and Return, which was
published by McGraw-Hill in August 1997. He is a member of the AIMR
Performance Presentation Standards Implementation Committee (AIMR-PPS)
and the Investment Performance Council Interpretations Subcommittee. Several of Mr Spaulding’s consulting assignments have involved Performance
Measurement and the AIMR Standards, including the development of a standalone composite maintenance and reporting system. In addition, he has helped
clients comply with the AIMR-PPS and address other performance-related
issues. His articles have appeared in Wall Street & Technology, Traders Magazine, Pensions & Investments, Dow Jones Investment Advisor, Dow Jones
Asset Management and Premier Review. Before founding TSG, he was VicePresident and Director of Systems for SunAmerica Asset Management. There,
he and his staff were responsible for significantly enhancing the firm’s use
of technology. This included the design and development of a performance
measurement system.
Allan Timmermann is a Professor of Economics at the University of California, San Diego, and has previously held positions at Birkbeck College and
the London School of Economics. He acquired his PhD from the University
Contributors xvii
of Cambridge. Dr Timmermann has published extensively on topics related to
financial economics and econometrics and is currently an associate editor of
Journal of Business and Economic Statistics, Journal of Economic Dynamics
and Control and Journal of Forecasting.
Ian Tonks is a Professor of Finance in the Department of Economics at the
University of Bristol, where he is the director of pensions research in the
Centre for Market and Public Organization. Previously he has held positions
at the London School of Economics and the University of British Columbia.
His research has focused on market microstructure and the organization of
stock exchanges; directors’ trading in the UK; fund manager performance;
and the new issue market. He has undertaken consultancy work for a number
of regulators and private sector organizations.
Harry Turtle is an Associate Professor of Finance in the College of Business and Economics at Washington State University. His research interests lie
in the fields of international finance, investment management and other general topics in financial economics. His work has appeared, or is forthcoming,
in numerous financial journals including the Journal of Business and Economic Statistics, Journal of Financial Economics, Journal of Financial and
Quantitative Analysis, Journal of Portfolio Management, and Management
Science.
Guoqiang Wang is currently working as a data analyst for the Hudsons
Bay Company. He got his PhD degree in Economics at the University of
Western Ontario. His research interests are in risk management, mutual fund
performance and data analysis of large financial databases.
Chapter 1
The financial economics
of performance measurement
NATHALIE FARAH
ABSTRACT
This chapter aims to provide insights into the different performance
measures that have been constructed over the years with the aim of
better evaluating and assessing the fund manager’s abilities. Indeed,
the finance literature has for some time been interested in this matter,
first because superior ability and outperformance by definition contradict the efficient market hypothesis and second because there is a
very important need to justify active management and the high fees
that fund managers tend to charge. After reviewing various performance measures and techniques, it is clear that there are still many
questions concerning the extent to which these measures apply in the
real world.
1.1
INTRODUCTION
The quest for active portfolio managers who can deliver abnormal excess
returns and beat a specified benchmark has been crucial for the portfolio
management industry. Indeed, finding an accurate and reliable measure able
to assess and compare the performance of various fund managers has been
stimulating the finance literature for a long period.
Since the tremendous growth that the mutual and pension fund industry
experienced – in the US, for example, over $5.5 trillion are currently managed by the mutual fund industry, with roughly $3 trillion managed in equity
funds (Chen, Jegadeesh and Wermers, 2000) – there has been a great deal of
attention directed towards portfolio performance measurement.
2 Performance Measurement in Finance
On the one hand, investors sought a method that could value the service
rendered by active management and justify the fees and expenses they were
paying. On the other hand, fund managers wanted to illustrate the importance
of their role and justify why one should buy an actively rather than a passively
managed portfolio.
Academic studies found this subject fascinating and tried to devise diverse
methods to tackle the number of issues at stake: measuring any abnormal
performance and assessing the superior ability of fund managers, examining
whether there is any persistence in the performance of the actively managed
funds, and finally constructing appropriate benchmarks that allow a genuine
comparison between active and passive management. The importance of these
issues lies in the fact that it is also a test of efficient market hypothesis:
managers making abnormal returns contradict this crucial hypothesis.
Before presenting the various measures that the researchers have constructed over the years to answer these important questions, this review starts
by defining some of the key concepts to performance evaluation, allowing
the reader a better and easier understanding of the discussion that follows.
Starting by distinguishing active and passive management, this chapter defines
the activities and decisions a fund manager engages in, in order to generate
abnormal performance. Understanding the intuition behind these processes is
the first step towards grasping the methods developed to evaluate them.
In managing funds, two different techniques can be used: passive and
active. Passive portfolio management entails what is commonly referred to
as a ‘buy-and-hold strategy’, where the weights on the securities constituting
the portfolio are set at the beginning of the investment period and are then
held constant until the end, with only minor changes. The assumptions that lie
behind passive portfolio management are market efficiency and homogeneity
of expectations. Indeed, if markets are efficient, the fund manager cannot capitalize on any mispricing of securities and gain from actively trading them.
Moreover, if all investors have homogeneous expectations, the fund manager
cannot take advantage of any differences in the securities market expectations regarding returns and risk to generate abnormal performance from active
trading (Blake, 1994).
In contrast, the assumptions behind active management are that markets are
not ‘continuously efficient’ and that investors do have heterogeneous expectations regarding securities risk and returns. In fact, active managers believe
that they have the ability both to obtain better estimates of the true securities’
risk and return and to spot any mispricing of securities, making use of this to
generate excess returns. As a result, managers frequently adjust their portfolio
weights to follow different strategies and identify any opportunities to ‘beat
the market’. (Blake, 1994).
The financial economics of performance measurement 3
Active management, thus, demands the mastering of different skills needed
to optimally perform the activities it requires: asset allocation, security selection and market timing. Indeed, as a first step, the fund manager must decide
on the allocation of his portfolio across a number of broad asset classes, such
as bond, shares, cash or any money-market securities. This is referred to as
asset allocation and represents one of the fundamental and most important
decisions in the management of the fund, since it not only dominates the
performance of most portfolios (Blake, 1994), but also accounts for a large
part of the variability in their return (Sharpe, 1992).
Once the proportions in each asset class have been chosen, the manager has
now to decide on which particular securities to hold within each asset class.
This is referred to as security selection. In this activity, the fund manager
uses his assumptions and information about the market to take advantage
of any mispricing1 that he believes is occurring. Indeed, the fund manager
accepts that ‘most shares are fairly priced but a few are either underpriced or
overpriced’ (Blake, 1994) and uses the information he has about the mispricing
to gain abnormal returns. If a manager does have superior ability and can
identify the over- and/or underpriced securities then he can game on his skills
and generate excess returns.
Furthermore, according to Jensen (1968), ‘a manager’s forecasting ability
may consist of an ability to forecast the price movements of individual securities and/or an ability to forecast the general behaviour of security prices in
the future’.
The first ability describes security selection skills while the second refers
to the fund managers’ ability to time the market.
An active fund manager engages in market timing by changing the beta
of his portfolio over time, depending on his expectations about the market. For instance, if the fund manager has positive (negative) information
about the market, he would increase (decrease) his portfolio’s beta, aiming at
capitalizing on his expectations. If the fund managers possess real superior
forecasting abilities, then they would be able to provide the investors with
excess abnormal returns.
Note that timing abilities can also be used if managers have expectations
about stocks with certain characteristics. Indeed, if the fund manager believes
that stocks with specific characteristics (size, book to market, etc.) are going
to experience high returns, he could tilt his portfolio weights towards them,
in an attempt to time those various stock characteristics.
1 A mispricing of a security happens when for an informed investor its expected return (or risk
estimate) is different from the market belief. If a security is underpriced (overpriced), it is expected
to rise (fall) in price.
4 Performance Measurement in Finance
To summarize, the difference between selection and timing abilities can be
described as follows: while selectivity mirrors the ability to choose investments that will do well relative to the benchmark portfolio, timing ability
mirrors the ability to forecast the return of the benchmark portfolio (Grinblatt
and Titman – hereafter referred to as GT – 1989b).
Assessing whether active managers have genuine superior abilities in completing these tasks, and whether the high fees and expenses that they charge
are justified by those superior abilities in the form of excess returns, is the
aim of the performance literature. Consequently, the literature has devised,
over the years, several different performance measures that help determine
these issues.
Having defined the terms and notions used in the performance evaluation
world, this chapter will present next a literature survey of the variety of performance measures and techniques that have been constructed throughout the
years to evaluate whether active managers have genuine superior abilities. The
aim is to discover if active managers do actually possess superior information
that could allow them to ‘beat the market’ and generate abnormal returns.
1.2
THE SHARPE RATIO
The first measure discussed is the Sharpe ratio (Sharpe, 1966), a very commonly used way to determine the excess return earned per unit of risk. It is
formulated as follows:
SRi =
Ri − Rf
σi
(1.1)
where:
Ri is the mean return on fund i over the interval considered
Rf is the average risk free rate over the interval considered and
σi is the standard deviation of the return on fund i over the interval
considered.
This ratio is a measure of ‘reward per unit of risk’ (Sharpe, 1966).
1.3
THE TREYNOR MEASURE
A similar measure to the Sharpe ratio is the Treynor measure (Treynor, 1965),
which uses the systematic risk βi of the fund as a measure of its risk instead
of its standard deviation:
Ti =
Ri − Rf
βi
(1.2)
The financial economics of performance measurement 5
The Treynor measure adjusts the excess reward earned by the fund for its
systematic risk, the capital asset pricing model’s beta.
Next, this review moves to one of the most widely used measures in the
empirical performance literature, the Jensen measure (Jensen, 1968, 1969).
1.4
THE JENSEN MEASURE
1.4.1
The theory and the aim behind the Jensen measure
Jensen (1968, 1969) created a measure of abnormal performance based on the
CAPM model of Sharpe (1963, 1964), Lintner (1965) and Treynor (1961).
This measure, however, allows for the abilities of the fund managers to be
reflected by the inclusion of an intercept in the traditional equation:
R˜j t − RF t = αj + βj [R˜ Mt − RF t ] + u˜j t
(1.3)
where the error term u˜j t should be serially independent and E(u˜j t ) = 0.
This expression hence measures the deviation of the portfolio evaluated
from the security market line. Particularly, it aims at picking up the manager’s
ability to forecast future security prices and thus at measuring his security
selection skills.
The benchmark used to compute this measure is assumed to be mean-variant
efficient from the perspective of an uninformed observer. Consequently, a
passively managed fund is expected to generate a zero intercept, while an
actively managed fund whose manager possesses some superior information
or abilities is expected to generate a positive intercept. Note that various
customized benchmarks such as style indexes or multiple-benchmarks models
are used throughout the literature to calculate the Jensen alpha.
However, Jensen (1968) acknowledged that by making βj stationary over
time in the above model, his measure does not account for the manager’s
abilities to ‘time the market’. Indeed, he affirms that a manager can easily
change the risk level of his portfolio, in an attempt to ‘outguess the market’.
Since the managers can possess two kinds of forecasting abilities, security
selection and market timing, Jensen recognized the need for ‘an evaluation
model which will incorporate and reflect the ability of the manager to forecast
the market’s behaviour as well as his ability to choose individual issues’.
Consequently, assuming that the fund manager has a ‘target’ risk level that
he wishes to maintain on average, Jensen (1968) modified the above model
to include such forecasting abilities by expressing the portfolio’s systematic
risk at any time t as follows:
βˆj t = βj + ε˜j t
(1.4)
6 Performance Measurement in Finance
where:
βj is the ‘target’ risk level which the portfolio manager wishes to
maintain on average through time
ε˜j t is a normally distributed random variable that has a 0 expected value.
According to Jensen (1968), ε˜j t is ‘the vehicle through which the manager
may attempt to capitalize on any expectations he may have regarding the
behaviour of the market factor π˜ in the next period’. Hence, if the fund
manager has some positive expectations about the market, he can game on
them by increasing the risk of his fund, i.e. by making ε˜j t positive. Jensen
expresses this relationship more formally as:
ε˜j t = aj π˜ t + w˜ j t
(1.5)
where the error term is assumed to be normally distributed with a 0 expected
value. A fund manager who possesses some forecasting ability will be characterized by a positive aj .2
Replacing this in equation (1.3), Jensen (1968) obtains the following:
R˜j t − RF t = αj + (βj + ε˜j t )[R˜ Mt − RF t ] + u˜j t
(1.6)
The authors then affirm that the least squares estimator of βˆj , assuming that
the forecast error w˜ j t is uncorrelated with the market factor π˜ t , can be shown
to be equal to:
E(βˆj ) =
cov[(R˜j t − RF t ), (R˜ Mt − RF t )]
= βj − aj E(R˜ M )
σ 2 (R˜ M )
(1.7)
If aj = 0, then this generates an unbiased estimate of the fund manager’s
selection abilities.
If aj is positive, i.e. if the fund manager does have any forecasting ability,
equation (1.7) shows that βj will be biased downward and hence αˆ will be
biased upward. As a result, Jensen (1968) concludes that if the fund manager
possesses some superior ability, then this model will definitely give evidence
of it since it tends to ‘overstate their magnitude’.
1.4.2
The various caveats and problems that face the Jensen measure
Although the Jensen measure is widely used throughout the performance evaluation literature, it has been subject to many criticisms (Jensen, 1972 and Roll,
1978). The most important ones are related to:
2 Jensen
(1968) notes that aj cannot be negative since this would be a sign of irrationality.
The financial economics of performance measurement 7
1. Benchmark inefficiency
The Jensen approach, being based on the CAPM model, necessitates the use
of a benchmark to conduct the performance evaluation. This, however, has
been pointed out to be the source of two problems. First, Roll (1978, 1979)
claimed that the Jensen measure is not a genuine and reliable indicator of the
true performance of a fund because of the lack of an appropriate benchmark
with which to compute its beta. Indeed, many empirical studies demonstrated
the mean-variance inefficiency of the CAPM benchmarks, showing that they
exhibit various biases such as dividend-yield or size biases. Roll has also
shown, along with many other researchers, that the Jensen measure can be
sensitive to the choice of the benchmark, and thus can lead to the adoption
of different conclusions, depending on the benchmark used.
2. Timing ability
Jensen (1972) showed that the Jensen measure, due to the bias in its estimate
of the systematic risk of a market timing strategy, could provide biased conclusions about market timers and assign them negative performance. Indeed,
successful market timing activities by the fund manager being evaluated can
lead to ‘statistical bias’ in the Jensen measure, in that such a fund would
generate negative performance numbers (GT, 1994).
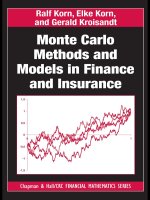
To illustrate this point, GT (1989b) provided an example of such a situation. They assumed a case where an informed investor receives information
about the market behaviour in the form of two ‘signals’: positive information
indicates that the excess return on the benchmark will be above its unconditional mean at rH and negative information indicates that it will be at point
rL , below the unconditional mean. This informed investor is also restricted to
a choice between a high beta portfolio and a low beta portfolio as shown in
Figure 1.1.3
If the investor is a ‘market timer’, he will be at point A (B) when he
receives the positive (negative) signal, choosing the high (low) beta portfolio.
From the point of an uninformed investor, the risk of this strategy is measured by ‘the slope of the dotted line’, i.e. higher than either of the high- or
low-beta portfolios. Furthermore, this figure plotted by GT (1989b) shows that
the Jensen measure, represented by the intercept C of the dotted line, could
assign a negative performance to a genuine superior investor, ‘erroneously
indicating that the informed investor is an inferior investor’.
3. Separation of the selection and timing abilities
Jensen (1972) observed that using equation (1.1) and information solely on the
return data, it is quasi-infeasible to separate the security selection and timing
3 These lines pass through the origin since GT (1989b) assume the benchmark is mean-variance
efficient.
8 Performance Measurement in Finance
High beta
portfolio
Excess return of the
managed portfolio
A
Low beta
portfolio
B
rL
rH
Excess return of the
benchmark portfolio
C
Figure 1.1
This graph illustrates the statistical bias in the Jensen measure, which can lead to
biased conclusions about market timers
abilities’ effect on performance. Indeed, according to him, in order to achieve
this separation and measure the manager’s timing abilities, one needs to know
‘the market-timing forecast, the portfolio adjustment corresponding to that
forecast and the expected return on the market’. Consequently, in his article,
Jensen (1972) first makes two main assumptions: the market timer attempts to
forecast the actual return on the market portfolio, and the forecasted return and
the actual return on the market are assumed to have a joint normal distribution.
Then he shows that under these assumptions, the correlation between the
market timer’s forecast and the realized return on the market can be used to
measure the market timer’s ability (Henriksson and Merton, 1981).
This problem is also described in Lehmann and Modest (1987) who discuss
this issue and explain how it can be quite problematic. Indeed, Lehmann and
Modest (1987) start with a K-factor linear model for securities returns and
then express the following return generating process for N individual assets:
R˜ t = B R˜ mt + ε˜ t
where:
R˜ mt is a K × 1 vector of returns on the reference portfolios
B is the N × K matrix of factor sensitivities
˜
˜
R t and R mt denote excess returns above the riskless rate or zero-beta
return where appropriate.
(1.8)