Global economic prospects
Bạn đang xem bản rút gọn của tài liệu. Xem và tải ngay bản đầy đủ của tài liệu tại đây (5.4 MB, 224 trang )
Global
Economic
Prospects
Technology Diffusion in the
Developing World
2008
Global
Economic
Prospects
Global
Economic
Prospects
Technology Diffusion in the
Developing World
2008
© 2008 The International Bank for Reconstruction and Development / The World Bank
1818 H Street NW
Washington DC 20433
Telephone: 202-473-1000
Internet: www.worldbank.org
E-mail:
All rights reserved
1 2 3 4 11 10 09 08
This volume is a product of the staff of the International Bank for Reconstruction and
Development / The World Bank. The findings, interpretations, and conclusions expressed in
this volume do not necessarily reflect the views of the Executive Directors of The World Bank
or the governments they represent.
The World Bank does not guarantee the accuracy of the data included in this work. The
boundaries, colors, denominations, and other information shown on any map in this work do
not imply any judgement on the part of The World Bank concerning the legal status of any
territory or the endorsement or acceptance of such boundaries.
Rights and Permissions
The material in this publication is copyrighted. Copying and/or transmitting portions or all of
this work without permission may be a violation of applicable law. The International Bank for
Reconstruction and Development / The World Bank encourages dissemination of its work and
will normally grant permission to reproduce portions of the work promptly.
For permission to photocopy or reprint any part of this work, please send a request with
complete information to the Copyright Clearance Center Inc., 222 Rosewood Drive, Danvers,
MA 01923, USA; telephone: 978-750-8400; fax: 978-750-4470; Internet: www.copyright.com.
All other queries on rights and licenses, including subsidiary rights, should be addressed to the
Office of the Publisher, The World Bank, 1818 H Street NW, Washington, DC 20433, USA;
fax: 202-522-2422; e-mail:
ISBN: 978-0-8213-7365-1
eISBN: 978-0-8213-7366-8
DOI: 10.1596/978-0-8213-7365-1
ISSN: 1014-8906
Cover photos: Irrigation by Chris Stowers/Panos; Man with Cell Phone by Jacob
Silberberg/Panos; Train by Qilai Shen/Panos; Map Projection by Chris Stowers/Panos; and
Researcher by Jenny Matthews/Panos.
Cover design: Critical Stages
The cutoff date for the data used in this report was December 12, 2007. Dollars are current
U.S. dollars unless otherwise indicated.
Contents
Foreword
xi
Acknowledgments
Abbreviations
xiii
xv
Overview
1
Technological achievement and diffusion in developing countries
Some policy directions
13
Note
15
References
15
2
Chapter 1 Prospects for Developing Countries
17
Growth outlook
17
Risks
18
Financial markets: Needed correction or major disruption?
18
Global growth
21
World trade
33
Inflation and commodity markets
36
Risks and uncertainties: Danger of a banking crisis and a U.S. recession
Long-term prospects and poverty forecasts
43
Notes
48
References
49
Chapter 2 Technology and Technological Diffusion in Developing Countries
The role of technology in development
53
Measuring technology in developing countries
58
Evaluating overall technological progress
78
Technological diffusion over the long term
87
Conclusion
92
Technical Annex: Construction of the summary indexes
92
Notes
99
References
101
41
51
v
C O N T E N T S
Chapter 3 Determinants of Technological Progress: Recent Trends and Prospects
Drivers of technological progress: A framework
107
External transmission channels
109
Nurturing technological adaptive capacity
127
Conclusion
150
Notes
153
References
156
105
Appendix: Regional Economic Prospects
165
East Asia and the Pacific
165
Europe and Central Asia
170
Latin America and the Caribbean
176
Middle East and North Africa
184
South Asia
189
Sub-Saharan Africa
193
Figures
1
Robust growth among developing countries should cushion the developed country
slowdown
2
2
Scientific innovation and invention is almost exclusively a high-income activity
3
3
Technological achievement: Converging, but the gap remains large
4
4
The penetration of older and more recent technologies depends on more
than income
5
5
Technological achievement tends to level off at different income levels in different
regions
6
6
Most technologies fail to penetrate deeply into developing economies
7
7
The urban–rural gap in telephone access in India is huge
7
8
Domestic absorptive capacity both conditions and attracts external flows
8
9
Developing countries’ trade in technology goods has risen
10
10
Macroeconomic stability has improved since the early 1990s
11
11
Literacy rates have increased in all regions
12
12
Developing regions have much poorer governance than do OECD countries
13
1.1
The perceived riskiness of high-yield corporate bonds increased more than that
of emerging market bonds
19
1.2
Emerging market asset sell-off more severe than during earlier periods of market
turbulence
19
1.3
Global equity markets fall, then recover led by emerging markets
20
1.4
A step-down in growth in 2008
21
1.5
Volatile patterns of growth among OECD countries
23
1.6
Tighter credit and weak housing yield slower U.S. growth
23
1.7
Robust growth in developing country industrial production
24
1.8
Developing growth retains strong momentum during the first half of 2007...
26
1.9
...with growth moderating through 2009
26
1.10
East Asia now accounts for one-quarter of China’s imports
27
1.11
External positions vary widely across Europe and Central Asia
27
1.12
Growth eases in 2007 for the Latin America and Caribbean region
28
vi
C O N T E N T S
1.13
1.14
1.15
1.16
1.17
1.18
1.19
1.20
1.21
1.22
1.23
1.24
1.25
1.26
1.27
1.28
1.29
2.1
2.2
2.3
2.4
2.5
2.6
2.7
2.8
2.9
2.10
2.11
3.1
3.2
3.3
3.4
3.5
3.6
3.7
3.8
3.9
3.10
3.11
3.12
3.13
3.14
Continued oil revenue gains support growth among Middle East and North
exporters
30
South Asia growth is slowing as the Indian rupee appreciates
32
Oil exporters drive 2007 growth results for Sub-Saharan Africa
32
Weak U.S. growth reduces demand for developing country exports
35
Export opportunities for high-income countries
35
U.S. current account narrows over 2007 and is likely to continue doing so
Inflationary pressures are rising in the Middle East and North Africa and
Sub-Saharan Africa
37
Inflation is broadly stable elsewhere, though at high levels
37
Commodity prices continued gains through 2007 led by metals
38
Copper, zinc, and aluminum prices sharply affected by China
38
Growth in the world’s demand for oil slows
39
OPEC reduces output to support prices
39
Agricultural prices surge over 2006–07
40
A rise in food prices, led by a ramp-up of the prices of fats, oils, and grains
Long-term growth, 1980–2030
44
Declining capital-led growth for developed countries, 2002–30
45
Sustained high productivity growth for developing countries
45
Patent activity is rising in middle-income countries
61
Electrical consumption varies markedly even at similar income levels
63
Rail and road densities rise with income and population density
65
Telephone densities are highly correlated with income, but air
transport is not
66
The incidence of Internet use varies widely across countries
73
Logistics performance in the world
77
Distribution of technological achievement by dimension
80
Increase in summary technological achievement subindexes, 1990s–2000s
Alternative summary indexes of technological achievement
83
Technological achievement rises with income levels
84
Comparison of levels of technological achievement, early 1990s and
early 2000s
85
Domestic absorptive capacity both conditions and attracts external flows
Rising share of high-tech imports
112
Exports of low-, medium-, and high-technology goods
114
Share of foreign affiliates in business R&D expenditure
117
Licensing payments have risen sharply
121
The brain drain is a severe problem in a number of small countries
123
Share of Ph.D. students still living in the United States five years
after graduation
124
High-skilled emigrants are disproportionately represented in the diaspora
Most developing countries have increased their exposure to external
technology
128
Number of countries in conflict worldwide
129
Efficiency of contract enforcement
132
Developing country governance scores relative to OECD average
132
Regional averages of six governance indicators
133
Per capita incomes have accelerated in recent years
134
Africa oil
36
40
82
108
124
vii
C O N T E N T S
3.15
3.16
3.17
3.18
3.19
A1
A2
A3
A4
A5
A6
A7
A8
A9
A18
A19
A20
A21
A22
A23
A24
Except in Sub-Saharan Africa, life expectancy is improving
134
Educational expenditures have risen in some regions
137
Many developing country students fail to meet literacy standards
138
Levels of intellectual property protection
146
Level of and recent changes in technological absorptive capacity
149
East Asian growth moves up in 2007
165
Except for China, inflation is now stabilizing across East Asia
166
Performance improves for East Asian countries other than China
169
Mixed growth outturns across Europe and Central Asia 171
External positions vary widely across Europe and Central Asia
171
Growth in Europe and Central Asia eases into 2009
173
Growth outturns were mixed across Latin America in 2007
176
Latin American inflation eases over the last 15 years
177
Latin America and the Caribbean sovereign bond spreads decline, then
increase again
177
Growth in Latin America and the Caribbean eases into 2009
179
Financial test: Credit
183
Exchange rate policy dilemmas?
183
Export product (value) concentration is increasing
183
Export market (value) concentration is falling
184
Growth in Middle East and North Africa picks up
184
Hydrocarbon exports continue to rise on higher prices, modest volume gains
186
Tourism and remittances offset widening trade deficits for Maghreb and
Mashreq countries
187
Middle East and North Africa equities rebound from the mid-2007 slump
189
South Asian economies ease into 2007
190
Monetary policy is tightened in response to a buildup in inflation
190
Growth in Sub-Saharan Africa has accelerated markedly. . .
194
. . . reaching a 35-year high in oil-exporting countries . . .
198
. . . and a 10-year high in oil-importing countries
199
Contributions of investment and consumption have increased
199
Tables
1.1
1.2
1.3
1.4
1.5
2.1
2.2
2.3
2.4
2.5
2.6
2.7
2.8
2.9
Gross capital flows to developing countries, 2005–07
20
The global outlook in summary, 2005–09
22
Recent economic indicators, developing regions, 2005–07
25
Developments and prospects for world trade and payments
34
Poverty in developing countries by region, selected years
46
Disparity among TFP levels remains wide
54
Scientific and innovative outputs
61
Indicators of the diffusion of older technologies
64
Affordability of fixed-line phones falls rapidly with lower incomes
67
Immunization rates lag significantly in South Asia and Sub-Saharan Africa
68
Diffusion of both water and sanitation technology is low in rural areas
69
Diffusion of recent technologies
72
Share of high-tech products in total exports
73
The quality of logistics services in 2005 varies by income
77
A10
A11
A12
A13
A14
A15
A16
A17
viii
C O N T E N T S
2.10
2.11
2.12
2.13
2.14
2.15
2.16
A2.1
A2.2
A2.3
A2.4
A2.5
A2.6
A2.7
A2.8
A2.9
3.1
3.2
3.3
3.4
3.5
3.6
3.7
3.8
3.9
3.10
3.11
3.12
A1
A2
A3
A4
A5
A6
Indicators included in summary indexes of technological achievement
79
Technological achievement in developing countries relative to that in high-income
countries
81
Increase in technological achievement in developing countries relative to that in
high-income countries
81
Overall technological progress in absolute and relative terms
86
Successful diffusion has accelerated
88
The pace at which technology diffuses has picked up among successful adaptors
89
Slow diffusion means that many developing countries never reach the 25 or 50 percent
threshold
90
Indicators used to calculate the summary indexes and overall index related to
technological achievement
95
Indicators used to calculate the summary indexes and overall index of technological
absorptive capacity
96
Share of total variance explained by principal components, technological achievement
index
96
Share of total variance explained by principal components, technological absorptive
capacity index
96
Share of total variance explained by principal components for each subgroup of
indicators
97
Factor loadings and variable weights for technological achievement
subgroups
98
Factor loadings and variable weights for technological absorptive capacity
subgroups
98
Share of total variance explained by main principal components of
technological achievement and technological absorptive capacity
using the sub-indexes
99
Factor loadings and variable weights obtained from second-stage principal
components analysis (2000–03)
99
Trade in technology goods has increased in developing countries 111
Foreign direct investment as a percent of GDP
116
Foreign direct investment as a percent of fixed capital formation
116
Selected purchases of high-tech firms by companies in developing countries,
early 2000s
121
Increases in exposure to external technologies index, 1990s to 2000s
129
Macroeconomic stability has improved in developing countries
130
The regulatory burden is heavier in developing countries than in the OECD
131
Educational attainment indicators
135
Relatively high youth literacy rates
136
Weak financial intermediation hinders technology in developing countries
139
R&D intensities have increased
141
Private-public sector R&D
141
East Asia and Pacific forecast summary
166
East Asia and Pacific country forecasts
168
Europe and Central Asia forecast summary
170
Europe and Central Asia country forecasts
174
Latin America and the Caribbean forecast summary
179
Latin America and the Caribbean country forecasts
180
ix
C O N T E N T S
A7
A8
A9
A10
A11
A12
Boxes
1
1.1
1.2
1.3
2.1
2.2
2.3
2.4
2.5
2.6
2.7
2.8
2.9
3.1
3.2
3.3
3.4
3.5
3.6
3.7
3.8
3.9
x
Middle East and North Africa forecast summary
Middle East and North Africa country forecasts
South Asia forecast summary
192
South Asia country forecasts
192
Sub-Saharan Africa forecast summary
194
Sub-Saharan Africa country forecasts
195
185
188
Summary of empirical results
14
Developing country exports in the wake of the removal of barriers to
Chinese exports
31
Biofuels
41
Policy responses to rising food prices
42
Technology can contribute to welfare without affecting measures of short-term
output
55
Technological innovation may spur further innovation in upstream and downstream
activities
56
Promoting appropriate technologies in Rwanda
57
Shortcomings of available measures of technological achievement
60
Deepwater petroleum technology in Brazil
62
The green revolution
68
Technology and growth in Latin America’s natural resource–based economies
71
Innovative use of communications technology is improving financial access for
the poor
75
The technological divide within India
91
Technology imports: Different paths for different countries
113
European call centers in the Maghreb have inspired local entrepreneurs and prompted
a specialization in high-value-added services
118
South African investment in Zambia’s retail sector has improved the quality of local
produce and farmers’ earnings
118
Wal-Mart’s entry in Mexico boosted the Mexican soaps, detergents, and surfactants
industry
119
Technological transfers through the diaspora and return migrants:
Some examples
125
Principal market failures impeding technological progress in developing
countries
143
Government sponsored innovation: Brazilian biofuels
144
A successful government program of technological development and innovation
financing in the Republic of Korea
145
Technology in 2020
152
Foreword
E
ACH YEAR,
Global Economic Prospects
explores critical “here and now” economic developments that are relevant to
low- and middle-income countries. Past editions have examined the economic implications of international and regional trade liberalization, and migration and remittances. Last
year’s report looked at the recent acceleration
in growth among developing countries and its
sustainability over the longer term.
This year we take a closer look at technology, a critical determinant of sustainable
growth and poverty reduction. We do so by
directly measuring the extent to which countries use technological inputs (including scientific technologies embodied in goods and
services and business processes) and produce
technological outputs. The report also examines trends in the major channels through
which technology is transmitted internationally, and in the country-specific factors that determine how well it is absorbed domestically.
Encouragingly, this Global Economic
Prospects finds that, since the early 1990s,
technological progress in both low- and
middle-income countries has increased more
rapidly than in high-income countries. As a result, the level of technology used in developing
countries is catching up with high-income
countries. However, the technology gap between them remains wide. Globalization has
underpinned much of the recent progress by
exposing developing countries to foreign technology through imports of high-tech consumption, intermediate and capital goods. Countries
have also benefited from rising levels of foreign
direct investment that often brings with it
knowledge of important process technologies
and foreign markets. Finally, highly skilled international diasporas are exposing developing
countries to technology, both through the
trade and marketing contacts that they provide
to their countrymen and through the return of
former émigrés.
Unfortunately, progress in improving the
capacity of developing countries to absorb
and make use of those technologies throughout their economies has been much weaker.
Whether technological progress in developing
countries will continue to outpace highincome countries will depend on the improvements in this regard. The main impediments to
further progress is not access to technologies,
but the weakness of domestic skills and competencies, which prevents many developing
countries from exploiting these technologies,
and rigidities in the regulatory environment
that prevent innovative firms from being created and expanding. The diffusion of technologies within countries is often slow, which
means that although some firms may have
technologically sophisticated operations, most
do not. Moreover, most of the population and
most firms operate in a low-tech environment.
As a result, despite having technologically
sophisticated cities and world-class firms, the
economy-wide level of technological achievement in countries like China and India is not
very different from that in other countries at
similar levels of development.
xi
F O R E W O R D
This report suggests a number of policy directions to bolster technology diffusion and
absorption within developing countries. First,
developing countries should safeguard the
principle of openness and actively strengthen
skills in the domestic population to ensure
that they are able to take advantage of future
opportunities. Second, to assist diffusion
throughout the economy, policy needs to reinforce technological absorptive capacity at the
subnational and regional levels and to
strengthen dissemination channels within
countries, including the outreach, testing,
marketing, and dissemination activities of applied R&D agencies. Third, authorities should
ensure that publicly supplied technological
services and technology-enabling infrastructure are widely available, whether they are delivered directly by the state or by private firms.
Fourth, in low-income countries and in those
xii
middle-income countries with uneven access
to quality secondary and tertiary schooling,
efforts should concentrate on raising the quality and quantity of schooling.
Finally, governments may need to intervene
directly to encourage the rapid diffusion of
technology and a domestic culture of “new-tothe-market” innovation. However, caution is
required. Although direct interventions have
sometimes been associated with some important technology successes, in many instances
they have not. Policies that have succeeded
have tended to make subsidies conditional on
performance and put in place high-quality and
independent-of-industry oversight systems.
Alan Gelb
Acting Senior Vice President and
Chief Economist
The World Bank
Acknowledgments
T
HIS REPORT WAS produced by staff from the World Bank’s Development Prospects Group.
Andrew Burns was the lead author and manager of the report. The principal authors
of chapter 1 were Hans Timmer and Elliot (Mick) Riordan. Chapter 2 was written by
Andrew Burns and William Shaw, with written contributions from Antonio David, Yvan
Decreux, and Annette De Kleine. Chapter 3 was written by Andrew Burns and William Shaw
with written contributions from Dilek Aykut, Antonio David, Yvan Decreux, Annette De Kleine,
Mariem Malouche, Sanket Mohapatra, and Olga Sulla. Both Chapters 2 and 3 benefitted from
the expert research assistance of Taras Chernetsky, Shuo Tan, and Teng Jiang.
Several people contributed substantively to chapter 1. The Global Trends Team, under the
leadership of Hans Timmer, was responsible for the projections, with written contributions from
John Baffes, Paul Brenton, Maurizio Bussolo, Betty Dow, Teng Jiang, Annette De Kleine, Donald
Mitchell, Denis Medvedev, Gauresh Rajadhyaksha, Elliot (Mick) Riordan, Cristina Savescu,
Shane Streifel, and Dominique van der Mensbrugghe. The poverty numbers originated with
Shaohua Chen from the Development Research Group.
The accompanying online publication, Prospects for the Global Economy (PGE), was produced by a team led by Cristina Savescu and including Sarah Crow, Teng Jiang, Shunalini Sarkar,
and Jennifer Vito, with technical support from Gauresh Rajadhyaksha.
Martha Grotton edited the report, Nigar Farhad Aliyeva and Michael Paul managed the publication process, and Merrell Tuck managed the dissemination activities. Roula Yazigi provided
invaluable assistance with the design of some figures. Book production was coordinated by Mary
Fisk from the World Bank Office of the Publisher.
The report was produced under the guidance of Uri Dadush, François Bourguignon, and Alan
Gelb. Several reviewers offered extensive advice and comments throughout the conceptualization
and writing stages. These included Jean-François Arvis, Kevin Barnes, Vandana Chandra, Prof.
Carl Dahlman, Mark Dutz, Alan Gelb, Mary Hallward-Dreimeier, Daniel Lederman, Jeffrey
Lewis, William Maloney, Claudia Paz Sepulveda, and Alfred Watkins.
xiii
Abbreviations
BACI
Banque Analytique de Commerce International (International Trade
Analytical Database)
CAGR
compound annual growth rate
CAT scan
computerized axial tomography scan
CEPII
Centre d’Etudes Prospectives et d’Informations Internationales (Institute
for Research on the International Economy)
CIS
Commonwealth of Independent States
DAX
Deutsche Aktien Exchange
DJIA
Dow Jones Industrial Average
DPT
diphtheria, pertussis, and tetanus
DSL
digital subscriber ink
EAF
electric arc furnace
EAP
East Asia and the Pacific
ECA
Europe and Central Asia
EMBIG
Emerging Market Bond Index-G
EPO
European Patent Office
EU
European Union
FDI
foreign direct investment
GDP
gross domestic product
GNI
gross national income
HIV/AIDS
human immunodeficiency virus/acquired immune deficiency syndrome
ICB
International Crisis Behavior
IEA
International Energy Agency
IMF
International Monetary Fund
ISO
International Organization for Standardization
LAC
Latin America and the Caribbean
LME
London Mercantile Exchange
MENA
Middle East and North Africa
xv
A B B R E V I A T I O N S
xvi
MSCI
Morgan-Stanley Composite Index
NASDAQ
National Association of Securities Dealers Automated Quotations
OECD
Organisation for Economic Co-operation and Development
OHF
open hearth furnace
OPEC
Organization of the Petroleum Exporting Countries
PC
personal computer
PPP
purchasing power parity
R&D
research and development
SAR
South Asia region
SMEs
small and medium enterprises
SSA
Sub-Saharan Africa
TFP
total factor productivity
TOPIX
Tokyo Stock Price Index
UN Comtrade
United Nations Comtrade database
UNCTAD
United Nations Conference on Trade and Development
UNDP
United Nations Development Programme
UNESCO
United Nations Educational, Scientific, and Cultural Organization
UNIDO
United Nations Industrial Development Organization
USPTO
U.S. Patent and Trademark Office
WTO
World Trade Organization
Overview
This edition of Global Economic Prospects is
being released during a period of increased uncertainty following four years of record
growth in developing countries. In addition to
examining economic prospects over the near
and longer term, it takes an in-depth look at
the current level of and recent trends in technological achievement and the main factors
that determine the extent to which developing
countries succeed in implementing foreign
technologies.
Notwithstanding the financial turmoil
provoked by a reassessment of risks in the
U.S. mortgage market, and despite large losses
in some financial markets, exposure to assetbacked securities appears to be broadly based.
Losses so far have been manageable, although
credit conditions have tightened. For developing economies, sovereign risk premiums have
increased but remain low by historical standards. Equity values, exchange rates, and
commodity prices have become more volatile,
and the vulnerability of countries with large
current account deficits or pegged exchange
rates has become more visible.
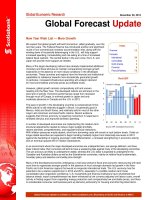
Against this background, global growth
slowed modestly in 2007, coming in at 3.6 percent after a strong 3.9 percent in 2006.
Most of the slowdown was attributable to
weaker growth in high-income countries.
Growth in developing economies was a robust
7.4 percent, broadly unchanged from 2006
(figure 1). This strong performance in the
developing countries has offset somewhat the
slowdown in U.S. domestic demand that
started with the unwinding of the housing
bubble early in 2006. During 2007, developing
countries accounted for more than half the
growth in world imports, contributing—along
with the depreciation of the dollar—to strong
net exports for the United States and furthering the reduction in global imbalances.
Global growth in 2008 should moderate to
3.3 percent, as the robust expansion in developing countries partly compensates for
weaker results in high-income countries.
World output should pick up in 2009, expanding by 3.6 percent, as the U.S. economy
regains momentum.
Several serious downside risks cast a
shadow over this soft landing for the global
economy. External demand for the products of
developing countries could weaken much
more sharply and commodity prices could decline if the faltering U.S. housing market or
further financial turmoil were to push the
United States into a recession. Alternatively,
monetary authorities might overreact to the
current climate of uncertainty and overstimulate the economy. This would be particularly
dangerous for developing countries if the bulk
of the resulting liquidity were to move into
rapidly growing developing regions, provoking the same kind of overinvestment conditions that arose in the U.S. housing market.
Prospects for the U.S. dollar represent an
additional risk factor. A recession in the United
States or an excessive easing of U.S. monetary
policy could contribute to further sharp declines
in the dollar. A weaker dollar would benefit
developing countries with dollar debt, but
impose losses on those that hold dollardenominated assets. It would hurt the competitiveness of firms exporting to the United States
1
G L O B A L
E C O N O M I C
P R O S P E C T S
2 0 0 8
Figure 1 Robust growth among
developing countries should cushion the
developed country slowdown
Real GDP, annual percent change
Forecast
8
Developing
countries
6
4
2
High-income
countries
09
08
20
20
07
06
20
20
05
20
04
03
20
20
02
01
20
20
20
00
0
Source: World Bank.
(and those producing close substitutes for U.S.
imports), while benefiting countrieswithcurrencies pegged to the dollar—at least temporarily.
However, the main impact of a precipitous decline of the dollar would likely derive from the
increased uncertainty and financial-market
volatility it would provoke, which would increase trading costs, and spreads on developingcountry debt—resulting in weaker export and
investment growth throughout the global
economy.
Even should such risks not materialize,
several developing countries may be quite
vulnerable to sudden adjustments in financial
markets. Most exposed are those countries
that combine large current account deficits
with pegged exchange rates and with increasing domestic inflation. Also at risk are countries whose domestic banking sectors have
balance sheets characterized by large currency
mismatches.
Technological achievement and
diffusion in developing
countries
T
he special topic of this edition of Global
Economic Prospects is technology and its
diffusion within the developing world. Much
2
of the economic and social progress of the past
few centuries has been due to technology.
Technology has been central to both economic
growth and many elements of social welfare
that are only partly captured by standard measures of gross domestic product (GDP), including health, education, and gender equality. As
measured by total factor productivity, it explains much of the differences in both the level
and rate of growth of incomes across countries
(Easterly and Levine 2001; Hall and Jones
1999; King and Levine 1994). And, looking
forward, it is expected to play a central role in
meeting the environmental and climate-change
challenges of the remainder of this century.
The private sector and the efficient functioning of markets are key to technological
progress. At the same time, the efficient delivery of socially relevant technological goods and
services depends on the direct contribution of
nonmarket actors, including governments,
nongovernmental organizations, and international organizations. Of course, policy also
supports technological progress by facilitating
the smooth operation of markets, by ensuring
the acquisition of technological competencies
by the general population, and by providing the
physical infrastructure that is often a necessary
complement to technologically sophisticated
activities. Active measures to promote technology diffusion and strengthen the linkages between firms and research and development
(R&D) agencies are also vital.
In exploring technological achievement and
diffusion, this report adopts a broad definition
of technology and technological progress, one
that encompasses the techniques (including
the way the production process is organized)
by which goods and services are produced,
marketed, and made available to the public.
Understood in this way, technological
progress at the national level can occur
through scientific innovation and invention;
through the adoption and adaptation of preexisting, but new-to-the-market, technologies;
and through the spread of technologies across
firms, individuals, and the public sector within
the country.
O V E R V I E W
Figure 2 Scientific innovation and invention is almost exclusively a high-income activity
Index
0.25
0.20
0.15
0.10
0.05
0
High-income
countries
Upper-middle-income
countries
Lower-middle-income
countries
Low-income
countries
Source: World Bank.
The following discussion traces the structure of the overall report, which in chapter 2
explores the level of—and recent trends in—
technological achievement, as well as the
process by which technology diffuses between
and within countries. Chapter 3 concentrates
on the process by which countries absorb foreign technology, both the mechanisms through
which they are exposed to foreign technologies and the domestic factors that dictate how
successfully they absorb those technologies.
Although the chapter identifies a number of
important, policy-relevant trends, and it explores their policy implications, it leaves to
future work a more normative analysis of the
policies that developing countries should
follow to maximize the development benefits
of technological progress.
Policy needs to actively promote
technological adoption and adaptation as
well as nurturing domestic innovative
capacity
A central finding of the report is that most developing countries lack the ability to generate
innovations at the technological frontier.
Although the number of patents and scientific
journal articles is strongly correlated with
GDP per capita for high-income countries,
almost none of this activity is being performed
in developing countries (figure 2). The lack of
advanced technological competencies in these
countries means that technological progress in
developing countries occurs through the
adoption and adaptation of pre-existing but
new-to-the-market or new-to-the-firm technologies. Moreover, relatively thin domestic
technology sectors and much better economic
and scientific opportunities abroad mean that
many nationals of developing countries perform cutting-edge research in high-income
countries. For example, 2.5 million of the
21.6 million scientists and engineers working
in the United States were born in developing
countries (Kannankutty and Burelli 2007).
The level of technological achievement in
developing countries has converged with
that of high-income countries over the
past 15 years
A sustained policy of increased openness to foreign trade and foreign direct investment (FDI),
plus increased investments in human capital,
have contributed to substantial improvements
in technological achievement in developing
countries over the past 15 years. And despite
rapid progress at the technological frontier,
technological achievement in both low- and
3
G L O B A L
E C O N O M I C
P R O S P E C T S
2 0 0 8
Figure 3 Technological achievement:
Converging, but the gap remains large
Rapid progress in developing countries…
Percent change in technological achievement, 2000s versus
1990s
180
150
120
90
60
30
0
High-income Upper-middle- Lower-middle- Low-income
countries
income
income
countries
countries
countries
…fueled relative convergence…
Index, high-income countries ϭ 100
120
100
80
60
40
20
0
High-income Upper-middle- Lower-middle- Low-income
countries
income
income
countries
countries
countries
…but the gap remains large
Technological achievement index
0.18
0.16
0.14
0.12
0.10
0.08
0.06
0.04
0.02
0
High-income Upper-middle- Lower-middle- Low-income
countries
income
income
countries
countries
countries
Source: World Bank.
4
middle-income countries has increased much
more rapidly than in high-income countries. As
a result, developing countries have closed
the relative gap with high-income countries.
However, the gap remains large (figure 3).
Moreover, the strong aggregate performance of
low-income countries reflects large improvements in technological achievement by some,
but much more modest advances by the
majority. As a consequence, many are only
maintaining pace with, or even losing ground
to, high-income countries.
In general, the level of technological
achievement observed in a country is positively correlated with income levels. However,
considerable variation is apparent within income groups. Among other things, this variation reflects the nature of the technology being
observed, the impact of the overall policy
framework on the ability of technologically
sophisticated firms to grow, and the extent to
which governments have given priority to and
had success in delivering services with a strong
technology component.
The penetration of older technologies, such
as fixed-line telephones, electrical power, transportation, and health care services—many of
which were originally provided by governments—is only weakly correlated with income.
The low-income countries with the highest
utilization rates of these older technologies
tend to have rates as high as those of the average lower-middle-income country (figure 4).
Similarly, the lower-middle-income and uppermiddle-income countries with the highest utilization rates tend to have rates that match the
average rate of the next highest income group.
In part, this reflects the nature of the
technologies in question, such as electrical
networks, road infrastructure, fixed-line
telephony, and sanitation networks. Many
of these technologies require an infrastructure
that is relatively expensive to create and
maintain, and which relies on large numbers
of individuals with scarce technical skills. In
addition, the observed diffusion of older technologies today depends on the intensity and efficiency with which government services have
O V E R V I E W
Figure 4 The penetration of older and more recent technologies depends on more
than income
Penetration of older innovations (2000–03)
Index
0.35
0.30
0.25
0.20
0.15
0.10
0.05
0
High-income countries
Upper-middle-income
countries
Lower-middle-income
countries
Low-income countries
Lower-middle-income
countries
Low-income countries
Penetration of newer innovations (2000–03)
Index
0.8
0.7
0.6
0.5
0.4
0.3
0.2
0.1
0
High-income countries
Upper-middle-income
countries
Source: World Bank.
been delivered in the past. Part of the strong
technological showing of the countries in the
former Soviet bloc is explained by the heavy
emphasis that past governments placed on providing basic infrastructure and education to a
wide range of the population. Similarly, past
governance problems and civil strife help explain the relatively weak penetration of these
technologies in many Sub-Saharan African
countries, whereas macroeconomic turmoil
and a relatively unequal distribution of incomes and skills in Latin America may have
contributed to weak outcomes in that region.
The penetration rates of newer technologies have risen relatively rapidly and are more
directly correlated with income than is the case
for older technologies. The infrastructure for
newer technologies such as mobile phones,
computers, and the Internet is generally less
expensive to create and requires fewer (though
more skilled) workers to maintain. Moreover,
in many countries, regulatory reform has
meant that the private sector now offers these
services in a competitive environment as compared with the state-owned, monopolistic environments of the past. As a result, supply of
5
G L O B A L
E C O N O M I C
P R O S P E C T S
2 0 0 8
Figure 5 Technological achievement tends to level off at different income levels in
different regions
Technological achievement versus per capita income by region
Index
0.30
Europe and Central Asia
0.25
All countries
0.20
0.15
0.10
0.05
Latin America
0
Ϫ0.05
Ϫ0.10
0
5,000
10,000
15,000
20,000
25,000
30,000
35,000
40,000
Income per capita (PPP)
East Asia and the Pacific
Europe and Central Asia
High-income other countries
Latin America and the Caribbean
Middle East and North Africa
Middle East and North Africa
South Asia
Sub-Saharan Africa
High-income OECD countries
Source: World Bank.
these new technologies has been more responsive to market demand and less restrained
by the budget constraints of governments or
state-owned-enterprises. Furthermore, demand for these products has been boosted by
low end-user costs as a result of competitive
pricing strategies and because some of these
newer technologies lend themselves more easily to sharing than do some older technologies.
Overall, although technological achievement tends to rise with incomes, this relationship is nonlinear and shows a tendency to level
off. Moreover, it is not uniform across regions.
Thus countries in Europe and Central Asia
tend to have somewhat higher levels of
achievement than would be expected on the
basis of income alone, but the overall relationship between technological achievement and
income in the region tracks relatively well that
of all countries (figure 5). In contrast, technological achievement in Latin America tends to
be lower than what would be expected given
incomes, and the overall relationship suggests
6
that other factors appear to be restraining
achievement even as incomes progress. These
results are consistent with the view that policy
choices over the long term (such as those
that generated the uneven distribution of income and educational opportunities in Latin
America and the region’s history of weak links
between R&D communities and the business
world) are important determinants of absorptive capacity and technological progress.
The level of technology in developing
countries reflects the pace at which
technology diffuses within countries
Although it can take time for a technology to
gain a foothold in developing countries, the
more serious impediment to technological
achievement is the speed with which technologies spread within these countries. On
average, the time it takes before official statistics in a developing country record significant
exploitation of a new technology has declined
from almost 100 years for innovations
O V E R V I E W
Figure 6 Most technologies fail to
penetrate deeply into developing
economies
Figure 7 The urban–rural gap in telephone
access in India is huge
Percent
60
120
Percent of subscribers with phone service
5%
25%
100
50%
50
Cities
40
Rural
areas
80
30
60
20
40
10
20
06
07
20
05
20
04
20
03
20
02
20
01
00
99
20
1975–2000
20
1950–75
20
1900–50
19
1800s
19
98
a
0
0
Source: World Bank calculations using data from Comin and
Hobijn 2004.
Source: Telecommunications Regulatory Authority of India.
discovered in the 1800s to about 20 years
today.1 However, technological progress also
depends on how rapidly the technology
spreads within the country. Here the story is
less encouraging. For technologies discovered
during 1950–75, only a quarter of the developing countries that have achieved at least a
5 percent penetration level have gone on to
reach the 25 percent threshold, and all of these
are upper-middle-income countries (figure 6).
The story is somewhat better for newer
technologies. Not only have these technologies
spread more quickly between countries, but
also the share of countries that have achieved
the 25 percent threshold is higher, at 33 percent. Indeed, developing countries have now
reached the same average level of penetration
of mobile phones as was observed in highincome countries in 1995.
The unevenness of technological diffusion
across countries is often mirrored within
countries, especially large countries. Although
technology spreads relatively rapidly among
elites living in major cities, it takes much
longer for it to find its way to the rest of the
population or from top-performing companies
to the average firm. Specific sectors in advanced urban centers in China and India, for
example, use world-class levels of technology,
but the incidence of these technologies elsewhere in the country, and in rural areas in particular, remains low (figure 7). Even within
sectors, technology may diffuse only slowly. In
Brazil and India, for example, the most sophisticated firms use technologies and achieve
levels of productivity that rival world leaders,
but the vast majority of firms operate at levels
of productivity that are less than one-fifth
those of the top performers.
a ϭ estimated.
A framework for understanding the
diffusion of technology within developing
countries
The bulk of technological progress in developing countries has been achieved through the
absorption and adaptation of preexisting and
new-to-the-market or new-to-the-firm technologies, rather than the invention of entirely
new technologies. Given the still wide technology gap, this is likely to remain the case for
the vast majority of developing countries.
A developing country’s ability to absorb
and adopt foreign technologies depends on
two main factors: the extent to which it is
exposed to foreign technologies (the pace at
7
G L O B A L
E C O N O M I C
P R O S P E C T S
2 0 0 8
Figure 8 Domestic absorptive capacity both conditions and attracts external flows
Technological absorptive
capacity
Transmission
channels
Technological frontier
Trade
FDI
Diaspora
and other
networks
Governance and the business climate
Policies to
- create competencies
- build infrastructure
- foster an innovationfriendly business climate
Basic technological literacy
Finance of innovative firms
Technological
absorption
Pro-active policies
Spillover
effects
Returns to
scale
Dynamic
effects
magnify
technology
transfer
Domestic technological achievement
Source: World Bank.
which technologies diffuse across countries)
and its ability to absorb and adapt those technologies to which it is exposed (the pace at
which technology diffuses within the country). Figure 8 presents a stylized description of
how a developing country absorbs technology.
As a first step, an economy is exposed to
higher-tech business processes, products, and
services through foreign trade; foreign direct
investment; and contacts with its diaspora and
other communications channels, including
academia and international organizations (the
large arrows at the top of the figure). The
larger these flows, the greater the exposure of
the economy to the global technological
frontier.
However, exposure to new ideas and techniques is not sufficient to ensure that the
technology diffuses throughout the economy.
Successful absorption of foreign technology
8
depends on the technological absorptive
capacity of the economy (represented by the
multiple-ringed drum). Absorptive capacity
depends on the overall macroeconomic and
governance environment, which influences
the willingness of entrepreneurs to take risks
on new and new-to-the-market technologies;
and the level of basic technological literacy
and advanced skills in the population, which
determines a country’s capacity to undertake
the research necessary to understand, implement, and adapt them. In addition, because
firms are the basic mechanism by which technology spreads within an economy’s private
sector, the extent to which financing for innovative firms is available—through the banking system, remittances, or government
support schemes—also influence the extent
to and speed with which technologies are
absorbed.