Business information systems
Bạn đang xem bản rút gọn của tài liệu. Xem và tải ngay bản đầy đủ của tài liệu tại đây (8.39 MB, 315 trang )
Chapter 1
Information Systems in Your Life: Types of Systems and
Careers
1.1 What Are Information Systems?
LEARNING OBJECTIVES
1.
Understand the parts of an information system
2.
Identify companies that practice user centered design
3.
Identify typical careers for information systems graduates
It’s More Than Just Computers
Information systems are the combination of people, information technology, and business processes to
accomplish a business objective.
Every information system (IS) has people, processes, and information technology. In fact, many IS
professionals add most of their value working with people and processes. They manage the programmers
but typically avoid programming themselves. We can represent an information system as a triangle with
people, processes, and information technology (computers) on the three vertices. The three parts of an
information system are often referred to as theinformation systems triangle.
Consider the popular trend of letting the TV audience vote on some talent shows such as Dancing with the
Stars. The voting is managed by a sophisticated information system. The voters are the people involved
with the system. Voters can cast the votes by phone, by text, or by online poll—three different information
technologies. A central server at ABC records and tallies the votes. The business processes include the
phone, texting, and online procedures—how and when to cast votes, and rules limiting the number of
votes from each household.
In November 2010, ABC had to defend the legitimacy of its business processes when detractors claimed
that Bristol Palin, daughter of political candidate, Sarah Palin, received an inflated vote tally from Tea
Party supporters. Some of these supporters bragged on blogs about how they had circumvented the ABC
Saylor URL: />
Saylor.org
9
business processes to record multiple votes for Bristol. ABC claims that it has systems in place to spot and
discount suspicious voting activity. They have publicly revealed some, but not all, of these fraud detection
systems. At this point we don’t know for sure if fraudulent votes got through. For more on this story see
for example: />
The three parts of the information systems triangle must interact in concert to realize business
objectives. The job of the IS professional is to ensure that a balance is maintained and enhanced for
the good of all the actors and the business as a whole.
Good and Bad Information Systems
Information systems professionals work with others to design and customize the systems that you interact
with everyday. When you register at a hospital, the information goes into an information system designed
to support administrative reporting and insurance processing. When you buy fromAmazon.com, the
information goes into an information system designed to support customer relationship management.
Every information system is designed to make someone’s life easier. Unfortunately, that someone is not
always the consumer. When was the last time that you had a good registration experience at a hospital?
Saylor URL: />
Saylor.org
10
That system probably was not designed with you in mind—but rather designed to support backend
reporting for the hospital administration and by proxy for the government and insurance companies. So
the administrators are happy, but not the customers. From the hospital’s point of view there is no
business need to make the registration experience extraordinarily pleasant. They are betting that you will
not choose your hospital based on how difficult it was to register.
Amazon.com, by contrast, delivers an extraordinary experience to its customers so that they will stay
loyal. Amazon practices user centered design—designing to meet the needs of the user. However, the
clever folks at Amazon also have tremendous backend reporting. So it is possible to design systems that
please customers and administrators simultaneously—but it takes a bit more effort.
What would hospital systems look like if they were designed to Amazon standards? Imagine 1-click
appointments, 1-click payments, shielding the client from the insurance companies. How about an
integrated patient record of all past procedures?
The world will continue to gravitate toward Amazon style systems. In the end it is good business to make
everyone happy—employees, customers, and administrators. It is also the right thing to do. Think back to
the hospital. In a competitive market, maybe you would choose the better customer experience. A hospital
worker might choose to work for the hospital with the more user friendly patient information system. No
one likes to be yelled at by unhappy customers.
It doesn’t take much to improve the user experience (UX) of a system. You have to design a user interface
(UI) anyway—why not make it a good one? In the words of Hall of Fame basketball coach John Wooden,
“If you don’t have time to do it right, when will you have time to do it again?”
Consider the tremendous success of Apple Computer. One of the main advantages that Apple has over its
rivals is that it carefully analyzes how people best interact with technology, develops requirements based
on that analysis and then designs elegant computers, the iPhone, iPad, iTunes, and so forth based on
those requirements.
Saylor URL: />
Saylor.org
11
Google Health, pictured here, has created a user centered patient record—and for free! It will be
interesting to see if hospitals adopt it.
Most Professions Use Information Systems
Marketing, accounting, finance, manufacturing – there are many different professional goals and types of
work in the business world. There are also many different industries where this work can be performed –
manufacturing, retail, banking, healthcare. No matter what your career goal is or what industry interests
you, your success and the success of the business rely on your ability to recognize opportunities where
information systems can be used to improve performance. In most lines of work, you will need to store
information in and retrieve information from databases. You will have to create persuasive and
professional reports and presentations to convince others that your ideas make sense. Using Microsoft
Excel and other tools, you will analyze data to find patterns and trends to aid decision-making. You will
manage your relationships with contacts and clients using customer relationship management systems.
The business’s success will depend on you leading efforts that use technology to support the introduction
of new products, efficiently manage supply chains, and effectively manage complex financial activities.
Retailers rely on past purchase data to develop sales forecasts and predict purchase behavior. Most
businesses utilize collaboration technologies to bring together employees from all over the world to solve
Saylor URL: />
Saylor.org
12
problems. Your ability to recognize opportunities to use information technology to create business value is
central to both your success and that of your firm.
What Does an IS Career Look Like?
A career in information systems is full of action, problem-solving, and teamwork. It is the goal of
information systems professionals to bridge the knowledge gap between business users and technologists,
and thus IS professionals must be fluent in both worlds. Work in the field of information systems is
exciting, fun, and fast-paced. There is always a new team to work with and new technology to learn about,
and projects move quickly leaving openings for new endeavors. In a recent report published in The Wall
Street Journal, information systems professionals were tied for the highest percentage of college
graduates that were satisfied with their career path. See />When preparing to become an IS professional, students focus on learning about the types of systems that
exist, what they offer to businesses, best practices for implementation, and the advantages and
disadvantages of each. Students also focus on how to work with business users and discover what their
system needs are and how they can best be served by information systems. Information systems
professionals focus on solving problems in businesses through the use of information systems.
When students start their careers, they frequently work on teams that connect businesspersons with the
appropriate system solution for their situation. Usually the organizations they work for adopt a set of best
practices to create consistency across project teams. Through the use of these best practices, IS
professionals determine what options are available, consider the pros and cons of each, design a
customized solution to match the specific business, and develop a plan on how to best implement the
information system, including rollout phases and training.
As mentioned, IS professionals typically work in teams. This is because the projects are usually very large
and have many interworking pieces. As a result, IS professionals specialize in a particular type of work
and contribute their expertise in this area. Specializations include system analysts, software developers,
database administrators, and project managers.
Saylor URL: />
Saylor.org
13
Information systems as a career is attractive to many individuals because of the traits above. However, it
is also engaging because it is a career in which you get to work on making people’s lives easier. IS
professionals focus on developing systems that businesspersons will use to create efficiency and increase
their performance. IS professionals design systems that help businesspersons make better decisions
(decision support systems) and lead organizations (executive dashboards). Systems are also created to
keep track of materials (supply chain management systems) and customers (customer relationship
management systems). And given the important role of information in modern organizations, IS
professionals record, monitor, and analyze data to learn how the business can improve (business
intelligence systems). IS professionals work to design these systems to be more usable, more efficient, and
more informative. This book will discuss these topics and allow you to experience many of them. It walks
you through what it is like to be an IS professional, rather than telling you about it.
KEY TAKEAWAYS
The information systems triangle includes people, processes, and information technology. It is a good
reminder that MIS is about much more than just technology.
Well designed information systems keep the user in mind at each step of the process.
Information systems are used by every functional area of business—marketing, management, finance,
and accounting. For this reason it is good to have a strong background in information systems.
Careers in information systems tend to be dynamic, team based, and focused on problem solving.
Few information systems careers involve programming. However, IS professionals must be able to
communicate with programmers.
QUESTIONS AND EXERCI SES
1.
Search for news stories on the Bristol Palin vote controversy. What systems did ABC put in place to catch
voter fraud?
2.
Pick a user centered web site other than Amazon.com and explain why you think it is well designed.
3.
Find job descriptions for two information systems jobs. Do the job descriptions emphasize soft skills or
technical skills or both?
Saylor URL: />
Saylor.org
14
1.2 Designing Information Systems
LEARNING OBJECTIVES
1.
Compare and contrast usability, graphic design and analytical design.
2.
Outline the steps by which an information system should be designed.
Many Meanings of Design
The key to successful information systems is good design. But what makes a good design? A number of
disciplines weigh in on this topic. We will look at design from a number of different perspectives.
Whenever possible we will contrast good and bad designs.
Different people use the word design in different contexts. When IS professionals speak of design, they are
referring to business processes. Problems must be analyzed and requirements documented before
solutions are designed, developed, and implemented. After all if the design does not satisfy the business
need, then what’s the point? However, satisfying the business need is really a baseline standard. The
vilified hospital system described earlier meets the business need of registering patients. And yet its
design is in other ways lacking. Similarly, fast food meets the need for feeding one’s hunger. However, we
want to be metaphorically better than fast food in our designs.
Usability describes how easy the system is to navigate. The easier the system is to navigate, the less time a
user will need to spend learning to use the system. A more usable system also leaves less room for error.
Usability theory provides rules of thumb (heuristics) that document best practice conventions for
designing a user interface. Amazon.com has one of the most usable online systems because they follow
established conventions. Following conventions tremendously increases the potential acceptance of your
website or app.
Graphic design refers to the visual appeal and organization of the user interface. There is obviously some
overlap here with usability. Usable systems typically adhere to at least some graphic design rules.
However, a usable system could be bland and uninteresting. Employing graphic design principles helps
ensure that the system will have visual appeal. Designs also need to fit with the overall brand of the client.
Existing colors, fonts, and logos are all a part of the brand for which the system is being created.
Saylor URL: />
Saylor.org
15
Analytical Design describes how to best represent information—especially quantitative information—to
communicate clearly and truthfully. Every information systems project has quantitative dimensions
associated with project management. These include estimating costs, time schedules, and so forth.
The convergence of usability, graphic design, and analytical design on Yahoo Finance. This graph
shows the three month stock price for Amazon vs. Google. From a usability standpoint it could not
be easier to request the graph. Type the company name and it suggests the stock ticker symbol.
Also, as you move your cursor (the hand), the black dot on the line moves as well, and the numbers
on the top left update to display values for the date you are passing over—very slick! The graphic
design is excellent—muting the underlying grid so that the data stands out by contrast. The
analytical design is also first rate. Hundreds of data points are effortlessly represented. We see the
trading volume on each day. At the bottom, the stock price is placed in context over a multi year
period. In sum, we have a tremendous amount of information beautifully represented without
clutter. Think about this the next time you see an impoverished PowerPoint graph with four bars
representing four data points.
Saylor URL: />
Saylor.org
16
Systems Development Life Cycle (SDLC)
Information systems are designed using the systems development life cycle (SDLC). The SDLC is to a
large extent common sense spelled out in stages. First, analyze the current situation. Then specify the
requirements that a solution should embody. The next stage is to design a solution (no programming yet).
Then the system is developed (programmed) and tested. Finally, the system goes live for the end users as
it is implemented in the business setting. To review, the five phases are:
1.
Analysis
2. Requirements (vision of future state)
3. Design
4. Development
5.
Implementation
In this course we will cover all five stages. However we will focus most heavily on the first three stages for
two reasons. First, because that is where IS professionals tend to spend most of their time and second
Saylor URL: />
Saylor.org
17
because it is much easier to make changes to a system when in the planning stages, than after code has
already been generated.
It is good to frequently interact with the end user and show them screen mockups and
a systems architecture diagram of what the final system will look like. The systems architecture is a
hierarchy diagram of the flow of the website or app—what the relationship between the pages of the
system will be. It is sometimes called a site map. Ideally the systems architecture is done on paper with
sticky notes that can be moved around at will by multiple users. A final systems architecture can be
represented as a hierarchy chart in PowerPoint.
Once the systems architecture is complete, wireframes or mockups of the individual pages may be
constructed. Mockups are non-functioning pages generated in a drawing program such as PhotoShop,
Omnigraffle (Mac), or even PowerPoint. PowerPoint turns out to be a fairly respectable mockup tool—
especially when working off of some predefined templates.
The SDLC in action. By analogy think of home improvement shows on TV. such as Curb Appeal.
They typically follow a similar life cycle when improving a home. The current state of the home is
analyzed in consultation with the resident. During this stage the residents reveal their
requirements for a solution. For example, they might want a way to interact more with the
neighbors. Next the designer produces a plan to meet those requirements. For example, a French
Saylor URL: />
Saylor.org
18
door in the living room leading to a front deck from which to interact with the neighbors. Actually
blowing a hole through the wall and installing a deck is the development stage. If the design is good
and workmanship good, the owner is normally delighted with the solution. At least they seem to be
on TV. The illustration below helps to tease out some of the equivalencies.
KEY TAKEAWAYS
The systems development life cycle (SDLC) is an approach for designing and developing MIS solutions. It
proceeds in stages: analysis, requirements (vision of future state), design, development, and
implementation.
Information systems professionals often make the equivalent of a sketch of the design of the final system.
When the sketches are crude they are called wireframes; when they are more refined they are called
mockups. However, sometimes the terms are used interchangeably.
QUESTIONS AND EXERCI SES
1.
Watch a home improvement show such as Curb Appeal and identify all five stages of the SDLC in the
show. About how much time does the show devote to each stage?
2.
Read and summarize an article on interface design from humanfactors.com.
Saylor URL: />
Saylor.org
19
1.3 The Big Picture
LEARNING OBJECTIVE
1.
Compare and contrast Enterprise, Collaboration and Collaboration systems
Business Information Systems
Most information systems can be grouped into three broad classifications—enterprise systems (ES),
knowledge management/collaboration systems, and business intelligence (BI) systems. These collectively
comprise the information systems architecture for an enterprise.
Enterprise systems are used to manage the day to day business processes.
Supply chain management (SCM) controls inbound and outbound logistics.
Customer relationship management (CRM) manages communications and marketing initiatives directed
at customers. However, the grandaddy of them all are enterprise resource planning (ERP) systems that
control business transactions from accounts payable/receivable to product movement on the factory floor.
If this seems dense now, don’t worry about it. Books have been written about all these pieces. What is
important for you to see is that ideally all the systems are smoothly coordinated so that management
makes information driven decisions.
All of these enterprise systems communicate and share information as needed. They also store each of
their activities in databases. At regular intervals these databases are copied into a centrally located data
warehouse. The copying process is called extract, transform and load (ETL). Data is extracted from
the multiple databases, transformed to a common format, and then loaded into the data warehouse.
The data warehouse then becomes a gold mine of data about the business. The beauty of the data
warehouse is that it can be queried offline without interrupting operations of the business. However, the
data warehouse is only as useful as the systems that query it for information. These are called
business intelligence (BI) systems. One of the most well known types of BI systems is for advanced
reporting or data mining. BI systems look to spot trends in the data and then convey that information to
the appropriate management level. For example, BI systems discovered years ago that diapers and beer
Saylor URL: />
Saylor.org
20
were often purchased in the same supermarket visit. Clever marketing sleuths concluded that dad sent out
to buy diapers was also picking up a 6 pack on his way out of the store. This creates opportunities for
product placement—locating the beer closer to the diapers.
Knowledge management and collaboration systems are ways that members of the organization capture
and institutionalize organizational knowledge. The most familiar types of systems are internal websites
for the company as well as blogs and wikis. However, leading organizations will also require that reports
be filed in a systematic way to allow for easy retrieval in case the organization encounters a similar
business problem in the future.
The big picture of information systems architecture. We will touch all these systems—albeit at a
surface level. We will create a store that handles customer relationship management (CRM).
Blackboard and similar systems are examples of collaboration systems. Finally, we will analyze
our sales data as a form of business intelligence.
KEY TAKEAWAYS
Saylor URL: />
Saylor.org
21
Most business information systems can be classified as enterprise systems, collaboration systems, or
business intelligence systems.
Ideally all these systems smoothly exchange data to help managers make information driven decisions.
QUESTIONS AND EXERCI SES
1.
In Good to Great, Jim Collins quotes former Kroger CEO, Lyle Everingham, on how Kroger management
made the decision to pursue the Superstore concept, “Basically, we did extensive research, and the data
came back loud and clear: The super—combination stores were the way of the future.” Which of the
information architecture systems could produce such data? Explain.
Saylor URL: />
Saylor.org
22
Chapter 2
Information Systems to Enhance Business: Business
Process Redesign
Information Systems to Enhance Business: Business Process
Redesign
“If you don’t know where you’re going, you might not get there.”
- Yogi Berra
Saylor URL: />
Saylor.org
23
2.1 What Is a Business Process?
LEARNING OBJECTIVES
1.
Identify a business process
2.
Describe the difference between an As-Is and To-Be business process
3.
Ask questions to elicit business process information from the client
Introduction
Every information system is designed to improve business in some way. However, before making an
improvement, it is critical to understand the current business process. In this chapter we will develop a
technique to diagram business processes. We will first diagram the current business process—the socalled As-Is process. After studying the process, we will be in a position to propose and diagram a future
process—the so-called To-Be process. If we have done our job well, the To-Be process will improve upon
the As-Is process, making it more efficient, effective, user friendly, and so forth. In other words, every
process improvement should move the business closer to achieving its goals.
Where Are We in the Life Cycle?
Many information systems projects are conceived of in a life cycle that progresses in stages from analysis
to implementation. The diagram below shows the stages that we touch in the current chapter:
Saylor URL: />
Saylor.org
24
Goal Directed Activities.
Implicit in each current and future state are one or more business processes. A business process is a set of
goal directed activities. In other words, a process describes the actions To-Be taken to accomplish a task.
For example, applying to a university, filing taxes, and evaluating employees are all processes. The steps
in applying to a university might include filling out an online form, submitting a credit card payment,
requesting test scores be sent, and requesting that high school transcripts be sent.
Note that all of the processes mentioned above took place even before the advent of computers. Try to
imagine how. Information systems simply transform the processes with the goal of making the process
more efficient, convenient, effective, reliable, and so forth.
First, we represent the current (usually deficient) state As-Is process. Seeing the As-Is process
diagrammed exposes obvious areas for improvement in the process. For example, many years ago
students registered for classes in person. The As-Is process in that era might have shown a student
Saylor URL: />
Saylor.org
25
waiting in line outside a large auditorium. When his turn comes up, the student enters the auditorium.
There are tables representing each department staffed with faculty from that department. For each course
that the student wishes to take, he must find the corresponding department table and add his name to the
list for that class. Buying concert tickets followed a similar process before services like Ticket Master went
online. People used to camp out for days in advance outside the Ticket Master office.
Sometimes information technology may improve processes, other times no technology is required.
Sometimes the solution is as simple as providing information for individuals completing a business
process at the appropriate time, or simply rearranging the steps in the business process, in which case, no
new information technology is needed.
The redesigned and improved business process is called the To-Be process. This process takes into
consideration the deficiencies identified in the As-Is process and the goals of the business. The area of
work that focuses on improving business processes is called business process redesign. Individuals
performing this work focus on understanding the As-Is process and how to improve it in the To-Be
process.
Business Process Examples:
Shopping at a grocery store
o
o
o
The deli
Taking numbers
Rules about which products can be sliced on which machines
Rules about wrapping product after slicing
The fish counter
Taking numbers
Rules about how to prepare the fish—head and tail off and so forth.
Checkout
Scanning and weighing procedures
Gathering customer data
Printing customized coupons
Saylor URL: />
Saylor.org
26
Optimal bagging
Taking payment
Shopping at an online retailer
o
Product display
Best selling
By price
By rating
o
Cross selling—“You might also like…”
o
Shopping cart and checkout processes
Inventory management
o
Determining the inventory need
o
Reordering with supplier
o
Tracking and receiving shipments
o
Stocking shelves
Note that most business processes subsume other business processes. One of the toughest challenges is
knowing what process to focus on and with what degree of granularity to zoom in on the process. Never
lose site of the problem you are trying to solve—and use that as your filter.
The Initial Client Meeting
Obviously, you can not diagram a business process without understanding the business. This will require
meetings with the client. It is best to walk into those meetings with a willingness to listen rather than
pretending that you know the client’s business. Ask open ended questions and take lots of notes.
Those that design systems are called business analysts or consultants. Analysts begin their work with an
initial client meeting. The quality of the questions asked at that meeting may well determine the success
or failure of the project. Using the following four open ended questions can help in this consulting
situation (Starr, 2010):
Current state: What does the client see as the current state of the situation/project?
Future state: What is the vision of the client for the end point of the situation/project?
Saylor URL: />
Saylor.org
27
Barriers: What barriers does the client envision will hinder reaching the vision?
Enablers: What is the client already doing to reach the vision? What does the client think will help?
Note that these questions capture the aspirations of the client as well as perceived barriers and enablers to
reach that vision. The assumption here is that the client knows her business pretty well, and the goal of
the initial meeting is to capture her knowledge and vision without jumping to a solution.
The initial client meeting for a home renovation project adding a second story to a home. Note the
barriers, time and money, and the enablers, the crane and manpower. Business problems require a
similar type of analysis. Never assume that you know these items. Give the client the opportunity to
explain. It will save you a great deal of time in the final analysis.
KEY TAKEAWAYS
A business process is a set of goal directed activities
The As-Is process captures the analysis of the current state of the business
Saylor URL: />
Saylor.org
28
The To-Be process captures the client’s requirements for the future state of the business. Ultimately the
To-Be process will be the measuring rod against which you will evaluate the completed system.
QUESTIONS AND EXERCISES
1.
Identify three business processes involved in the purchase of a car.
2.
Describe how the process of going on a date changed with the introduction of online dating services such
as Match.com. What do you see as the pros and cons?
Saylor URL: />
Saylor.org
29
2.2 Diagramming a Business Process
LEARNING OBJECTIVES
1.
Create deliverables for the first two phases of the systems development life cycle
2.
Create As-Is and To-Be process diagrams for the redesign of a business process
3.
Given an advertisement, research and represent the business process redesign
4.
Manipulate images and text to create a best practice diagram in PowerPoint
5.
Choose and successfully employ PowerPoint techniques to solve a complex task
Actors and Actions
Improving a business process requires first understanding the process. Diagramming the steps in the
process contributes greatly to that understanding. Business process diagrams typically consist of actions
linked by arrows. However, it is also important to be clear about who is performing each action. For this
reason we create a swim lane for each actor in the process. The actors pass a metaphorical baton among
themselves at different stages of the process.
An easy way to diagram a business process is to first identify all of the actors and place each in a swim
lane. The process begins at the top of the page and continues down the page following the arrows. Arrows
represent communication among the actors, while diamonds represent decision points. While actors are
normally people, a computer standing in for the role of a person can also be an actor.
At times we can simplify the business process diagram by eliminating all but the essential elements. This
makes the diagram less cluttered and easier to read. On the facing page we have a process diagram
reduced to just three elements — swim lanes, actions, and arrows.
For the level of analysis needed in this course, the simplified diagram is more than sufficient. However, it
is good to know the full lexicon, especially the decision point diamond shown on the next page.
Saylor URL: />
Saylor.org
30
To-Be business process for IBM’s package routing solution. In this solution Radio Frequency
Identification (RFID) tags in the boxes communicate with their surroundings to report their
geographic position back to the help desk. If a truck has taken the wrong turn, the boxes will notify
the help desk. A help desk employee will in turn communicate by phone with the truck driver to
reroute the truck.
It’s More Complicated Than That
What we showed on the prior page is actually a simplified form of a business process diagram. For the
purpose of this course, the simplified form works just fine. However for the sake of completeness, we
show a more advanced diagram more in the spirit of Universal Modeling Language (UML). It is not that
the UML style diagram is better—just that you should be prepared to see it. The following table lists some
of the symbols that you might encounter in a process flow diagram.
Saylor URL: />
Saylor.org
31
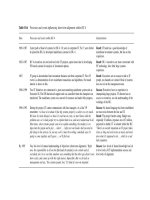
Table 2.1
Action
An action taken in the
state
flow
A beginning of a flow;
only one start state
Start state
can be used
An end of a flow; any
number of end states
End state
are allowed
Indicates the control
passing from one
Transition
object to another
Showing possible
Decision
options and paths to
point
follow
The beginning of
Fork
parallel processes
The integration of
Join
parallel processes
Represents ownership
or assignment of a
Swim lane
Saylor URL: />
group of actions
Saylor.org
32
An object involved in
the system, such as a
Artifact
server or database
KEY TAKEAWAYS
A business process can be diagrammed by showing actors in swim lanes taking actions. Communication or
message passing among the actors is represented by arrows.
QUESTIONS AND EXERCI SES
1.
Diagram the As-Is and To-Be processes before and after online dating.
Saylor URL: />
Saylor.org
33