study on inundation due to storm surge for phu quoc islands
Bạn đang xem bản rút gọn của tài liệu. Xem và tải ngay bản đầy đủ của tài liệu tại đây (3.76 MB, 101 trang )
MINISTRY OF EDUCATION AND
TRAINING
MINISTRY OF ARGICULTURE
AND RURAL DEVELOPMENT
THUY LOI UNIVERSITY
-----------------------------
VU VAN LAN
STUDY ON INUNDATION DUE TO
STORM SURGE FOR PHU QUOC ISLANDS
THESIS OF MASTER DEGREE
HÀ N I, 2016
1
MINISTRY OF EDUCATION AND
TRAINING
MINISTRY OF ARGICULTURE
AND RURAL DEVELOPMENT
THUY LOI UNIVERSITY
-----------------------------
VU VAN LAN
STUDY ON INUNDATION DUE TO
STORM SURGE FOR PHU QUOC ISLANDS
Major: Coastal Engineering and Management
No:
Supervisor: Ass. Prof. PhD. Vu Minh Cat
HA NOI, 2016
2
Declaration
I hereby certify the work which is being presented in this thesis entitled, “Study on storm
surge due to inundated for Phu Quoc island” in partial fulfillment of the requirement for
the award of the Master of Coastal Engineering Management, is an authentic record of
my own work carried out under supervision of Ass. Prof. PhD. Vu Minh Cat. The matter
embodied in this thesis has not been submitted by me for the award of any other degree
or diploma.
Date: May 30, 2016
Vu Van Lan
3
Acknowledgements
I would like to express my sincere gratitude to my advisor Ass. Prof. PhD Vu Minh Cat
for his guidance, suggestion and inspiration.
I would like to acknowledge Ass. Prof. PhD Nghiem Tien Lam for his comments and
suggestion. I also want to show deep thanks to Ass. Prof. PhD. Tran Thanh Tung who
is main co-ordinator, making value contributions to success in Master course. In
addition, please allow me to send my bestgratitude to the KC09.16/11-15 subject, which
support a lot of valuable data for my thesis.
I would like to thank faculty of Marine and Coastal Engineering of Thuy Loi University
and Faculty Marine Science & Island, Ha Noi University for Natural Resources and
Environment for enabling me thesis before the deadline.
Finally, I would like to express my special appreciation to my friends and colleagues for
their support, encourage and advices. The deepest thanks are expressed to my family
member for their unconditional loves.
4
TABLE OF CONTENS
LIST OF FIGURES .........................................................................................................7
LIST OF TABLES ..........................................................................................................9
INTRODUCTION .........................................................................................................10
1. The necessity of the study .....................................................................................10
2. Objectives ..............................................................................................................11
3. Objects and scope of the study ..............................................................................11
4. Study approaches and methodology ......................................................................11
5. Structure of the thesis ............................................................................................13
CHAPTER 1: OVERVIEWS ON STORM SURGE STUDY AND STUDY AREA ..14
1.1. Literature reviews ............................................................................................16
1.1.1.
International researches on storm surges ...............................................16
1.1.2.
Storm surge researches in Viet Nam .....................................................20
1.2. Brief description on study area ........................................................................21
1.2.1.Natural conditions ........................................................................................21
1.2.2 Climatic and oceanographic characteristics .................................................24
1.2.3. Hydrological and oceanographic characteristics .........................................25
1.2.4. Social and economic features ......................................................................27
CHAPTER 2: APPLICATION OF DELFT3D TO STUDY STORM SURGE ...........29
2.1. Data used for the simulation ...............................................................................29
2.1.1. Statistical typhoon data................................................................................29
2.1.2. Water level ...................................................................................................36
2.1.3. On land and seabed topography ..................................................................36
2.2. Model description ............................................................................................... 36
2.2.1. Hydrodynamic Model ..................................................................................36
2.2.2. Typhoon model ............................................................................................43
2.3. Set up the hydrodynamic model .........................................................................50
2.3.1. Computational grid ......................................................................................50
2.3.2. Topography..................................................................................................51
2.3.3. Boundary conditions ....................................................................................52
5
2.3.4. Other parameters .........................................................................................53
2.4. Model calibration ................................................................................................ 53
CHAPTER 3: SIMULATION OF STORM SURGE IN PHU QUOC ISLANDS .......59
3.1. Typhoon zoning along the coastlines of Viet Nam ............................................59
3.2. Generation of typhoon scenarios for Phu Quoc areas ........................................62
3.3. Extraction of water level around Phu Quoc islands ...........................................62
3.3. Simulated results ................................................................................................ 63
3.3.1. Scenario 1: Simulation of typhoon namely Linda (later it is called Linda
typhoon) that approached to the study area in November, 1997 ...........................63
3.3.2 Scenario 2: Scenario 1 in case of the typhoon Linda coming at the same
time of flood tide at the study area. .......................................................................66
3.3.3. Scenario 3: Simulation of typhoons according scenarios approved by
Ministry of Natural Resources and Environment (MoNRE), but wind velocity
changes with the time V= f (t) ...............................................................................69
CHAPTER IV: BUILDING INUNDATED MAPS CAUSED BY STORM SURGE
FOR PHU QUOC ISLANDS ........................................................................................72
4.1. Introduction on application of GIS .....................................................................72
4.2. Application of ArcGIS software to build up inundated map.............................. 74
4.2.1.Topographic data ..........................................................................................75
4.2.2. Hydrologic data ...........................................................................................77
4.3. Building up inundation maps..............................................................................78
4.3.1. The inundation map of scenario 1 ............................................................... 78
4.3.1. The inundation map of scenario 2 ............................................................... 82
4.3.2. Inundation of Phu Quoc island according scenario 03 ................................ 85
CONCLUSION AND RECOMMENDATION ............................................................89
Conclusion .................................................................................................................89
Recommendation .......................................................................................................90
References .....................................................................................................................92
6
LIST OF FIGURES
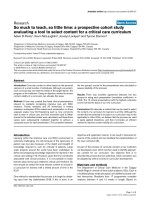
Figure 1. Flowchart to illustrate the study approach
12
Figure 2. Comparison of the calculated results top, legs and wave height of Boussinesq
1D model with experimental data of Bowen (1986).
18
Figure 3 .Location of Phu Quoc islands on satellite image
22
Figure 4 .Statistical storm paths approaching to Viet Nam coasts
29
Figure 5. Grid calculated in the study area
51
Figure 6.Topography in Phu Quoc area
52
Figure 7.The model grid and boundaries
52
Figure 8 . Phu Quoc oceanographic station
55
Figure 9. Observed and computed water level at Phu Quoc (C=55)
55
Figure 10. Observed and computed water level at Phu Quoc (C=60)
56
Figure 11. Observed and computed water level at Phu Quoc (C=65)
56
Figure 12. Observed and computed water levels for model verification
57
Figure 13. Observed and computed water levels in verification step
57
Figure 14.Typhoon zoning along the Vietnam coasts
60
Figure 15.Basic characteristics and storm risk in Viet Nam Coasts
61
Figure 16. Extracted points of simulated water level
63
Figure 17.The track of Linda typhoon in the study area
64
Figure 18.Water level field around Phu Quoc islands in scenario 1
65
Figure 19. Storm surge at 8 points around islands in scenario 1
66
Figure 20.Tidal series at Phu Quoc during Linda typhoon
67
Figure 21. Storm surge at 8 points around islands in scenario 2
68
Figure 22. Storm surge at 8 points around islands in scenario 3
71
Figure 23.Topographic data layer of Phu Quoc island
75
Figure 24.Vegetation cover layer on the Phu Quoc island
76
Figure 25.Cadastral data layer of Phu Quoc island
76
Figure 26.Hydrological data layer around Phu Quoc island
77
Figure 27.Simulated water level and topography in coast of Duong Dong and Ham
Ninh
78
Figure 28. Inundated mapping Phu Quoc with scenario 1.
80
7
Figure 29. Inundation maps of the Cua Duong, Duong Dong, Duong To communes 81
Figure 30. Inundation mapping at the Ham Ninh commune
82
Figure 31. Inundated map in scenario 2
83
Figure 32. Inundated mapping of Duong To, Cua Duong and Duong ông communes.
84
Figure 33. Inundated mapping of Duong To, Cua Duong and Duong ông communes.
84
Figure 34.Spatial disribution of flooded areas in the Phu Quoc island in scenario 3
86
Figure 35. Inundated mapping of Duong Dong and Cua Duong commune
87
Figure 36.Inundated mapping of Ham Ninh commune
87
Figure 37. Inundated mapping of D
88
ng To commune
8
LIST OF TABLES
Table 1 .Coordinate of Phu Quoc area shown in map scale of 1/ 50.000............................. 23
Table 2 . Monthly and yearly average temperature in Phu Quoc and Rach Gia (oC) ...24
Table 3.Monthly and yearly average and minimum humidity (%) at Phu Quoc ..........24
Table 4.Monthly and yearly average and minimum humidity (%) at Phu Quoc ..........24
Table 5. Monthly wind velocity and main direction at Phu Quoc ................................ 25
Table 6.The statistical result of wave height and its period at Phu Quoc .....................26
Table 7.Water level at Phu Quoc (103058 E – 10013 N) station (1990-2008) ..............27
Table 8 .Statistics on typhoon hitting to Phu Quoc and surrounding areas ..................30
Table 9 .Characteristics of typical typhoons approaching to the southern coasts .........31
Table 10.Tidal constituents at 3 boundaries ..................................................................53
Table 11.Coefficient RMSE ..........................................................................................56
Table 12.The locations where water level is extracted .................................................62
Table 13.Linda typhoon’s parameters ...........................................................................63
Table 14.Highest storm surge and appearance time at the extracted points .................65
Table 15.Adjustment of Linda typhoon time to fit to spring tide..................................67
Table 16.Highest water level and appearance time at 8 points in scenario 2 ................68
Table 17.Typhoon parameters used to simulate in scenario 3 ......................................69
Table 18. Highest water level and appearance time at 8 points in scenario 3 ...............70
Table 19. The maximum storm surge at the point around Phu Quoc islands ...............71
Table 20.Clasification of inundated depth.....................................................................78
Table 21. Flooded area for Phu Quoc island in scenario 1............................................81
Table 22. Flooded area for Phu Quoc island in scenario 2............................................85
Table 23. Flooded area of Phu Quoc island in scenario 3 .............................................87
9
INTRODUCTION
1. The necessity of the study
In recent years due to the impact of global climate change, natural disasters become
more complex, especially storms, accompanied by rising sea levels caused flooding of
coastal estuaries. The sea level rise due to storm caused flooding of coastal areas and
break dike, especially storm occur during high tides. So the study, calculated and
forecasting extreme storm surge in coastal area and flooding risk due to storm are
positive tasks to find appropriate solutions for prevention and reduction of damages in
coastal areas. The components cause extreme water level during storm including tides,
storm surge, and wave surge, in which the storm surge is an important one.
Storm surge is a dangerous natural phenomenon which causes lost lives, destruction of
socio-economic infrastructures and valuable resources when typhoon attacking to
coastal areas. Worldwide, storm surge has caused major damages such as the typhoon
in 1970 and 1990 with water surge more than 7 m, generated large wave, inundated to
delta of Bangladesh and over 400,000 people were killed. On the Caribbean, highest
water surge of typhoon Flora is 8 meter, it had cause flood and over 5000 people were
killed. Coastal of the United States had been affected by historic storm surge of up to
7.4 m. The countries on the Northern coasts of Europe had been affected serious of storm
surge in 1916, 1953, 1962, 1976, in which the storm occurred in 1953 in Netherland
caused large inundation and over 1400 people killed.
Storm surges may be defined as high sea water level above mean sea level which is
caused by strong winds and low atmospheric pressures of a storm. Winds which blow
towards land exert a shearing stress on the surface, causes an increase in the sea water
level near the coastlines. Low atmospheric pressure also produces high elevation due to
the so-called inverted barometer effect. The highest surges have generated by strong
tropical cyclones. The surge belongs to the same class of phenomena as tide waves and
tsunamis. Its horizontal scale depends on the parameters of the storm. In general, the
storm surge occurs in duration of several hours, but it can sometimes last for a few days.
It is obvious that prediction of surges is a very urgent issue to be addressed, especially
in coastal regions which are affected by tropical cyclones. There have also been many
10
attempts to develop methods for forecasting storm surges in Vietnam. At present, all
kinds of activities are increased in number and almost marine constructions need sea
level data for designing. Sometimes they need the values of sea level rise which happen
at rare frequencies, while the observed stations located along coasts and islands are
scarce. That’s why in this study numerical models are used to simulate storm surge based
on the data of bathymetry, figure of coastlines, climate characteristics of typhoons and
oceanic data at sea and coastal stations.
2. Objectives
The general objective of the present work, therefore, is to develop a method based on
hydrodynamic models to determine maximum surface water elevation generated by
typhoons. The computed results of model produce an atlas of pre-computed surges and
a collection of several possible typhoon conditions from many potential surges. It is
straightforward to determine the highest possible surge at all vulnerable coastal locations
from a particular family of tracks and simulated storm surges as input data for
preparation of potential map of inundation in Phu Quoc island.
3. Objects and scope of the study
+ Objects of the study: The extreme water level during storm at the shorelines and
potential inundation caused by storm surge.
+ Scope of the study: Phu Quoc islands and surrounding areas
4. Study approaches and methodology
The simulation of storm surge and land inundation by using Delft3d is shown in figure
1, of which the following steps are conducted.
11
.
Figure 1. Flowchart to illustrate the study approach
Step 1: Collection of data
These data are used as input for calibration and verification of models and simulation of
storm surge. These are included:
+ Hydro-meteorological data such as water level series at the sea and observed stations,
atmospheric pressure, water temperature, wind, wave, currents etc.
+ Topography including sea bathymetry and land elevation surrounding the study
islands
+ Socio-economic data: including infrastructures around the coasts, lands, forests,
ecosystem and all socio-economic activities that will be damaged if coastal strip of
island is inundated by typhoon water.
Step 2: Set up computational model
It includes computation network, meshes, defined boundaries such as tide series, seabed
topography and typhoon information including central typhoon pressure, typhoon
radius, wind velocity and so on. After having the computational network and necessary
12
data, the calibration and verification are conducted to find model parameters that are fit
between simulated and real observed data both for hydrodynamic as well as typhoon
models.
Step 3: Create scenarios for simulation of storm surge in the study area
The scenarios proposed for study of storm surge are based on the real typhoon which
had been occurred in the past and potential typhoon that can occur under the climate
change conditions. These are presented in detail in chapter 3.
Step 4: Simulation of storm surge around the study area according to scenarios proposed
in step 3
Results of this step are resultant water level fields (including tide plus storm surge) at
the study areas. The real storm surge can be taken by subtracting total water level and
astronomical tide at the same time. The computation of resultant water level, potential
land inundation around the island at many points is taken for each scenario.
Step 5: Inundated mapping for each scenario
By overlapping simulated water level map on to topographical map with the support of
GIS software, the potential inundated map can be produced for each scenario.
Step 6: Conclusions and recommendations
In this content, author will summary the results conducted in the research and also
propose the future works that should be continued to serve socio-economic development
in Phu Quoc islands.
5. Structure of the thesis
Besides the introduction, conclusion, recommendation and annexes, the study is
consisted 4 chapters as following:
Chapter 1: Overviews on storm surge study and study area
Chapter 2: Application of Delft 3D to study storm surge
Chapter 3: Simulation of storm surge in Phu Quoc islands
Chapter 4: Building inundated maps caused by storm surge.
13
CHAPTER 1: OVERVIEWS ON STORM SURGE STUDY AND STUDY AREA
Storm surges may be defined as high sea water level caused by strong winds and low
atmospheric pressures at the center of a storm. Winds which blow towards land exert a
shear stress on the surface, causing an increase in the sea surface elevation near the
coastline. Low atmospheric pressure also produces high elevation due to the so-called
inverted barometer effect. The highest surges are generated by strong tropical cyclones
and it is considered the same category of phenomena as tide waves and tsunamis. Its
horizontal scale depends on the parameters of the storm. In general, the storm surge can
occurs in the duration of several hours, but it can sometimes last for a few days. It is
obvious that prediction of surges is a very urgent issue to be addressed, especially in
coastal regions which are affected by tropical cyclones.
There have also been many attempts to develop methods for forecasting storm surges in
Vietnam. At present, on the coastal areas, all kinds of activities are increased in number
and almost marine structures need sea level data for designing. Sometimes they need the
values of sea level rise which happen at rare frequencies, while the sea level stations
located along coasts and islands are scarce. That’s why we need to find another way to
define the maximum values of sea level rise that can happen in the chosen areas. The
way mentioned here is numerical model that is used to simulate sea level rise with the
data of bathymetry, coastal topography and climate characteristics of typhoons, tide and
wave conditions occurred at the chosen places.
Worldwide, storm surge has caused serious damages in the coastal areas. For example
the typhoons attacked the Bangladesh in 1970 and 1990 created a storm surge of more
than 7 m, generating high waves, and inundated large area of Bangladesh delta and more
than 400,000 people were killed in these events. On the Caribbean Sea, the highest water
surge of typhoon Flora was 8 m causing serious flood and over 5,000 dead people;
Coastlines of the United States had been affected by big storm with storm surge up to
7.4 meters. The countries on the Northern coasts of Europe had also been affected by
serious storm surge in 1916, 1953, 1962, 1976 in which the typhoon in 1953 hitting the
14
coastlines of Netherlands caused sea dike breaches, resulting large inundation and over
1400 dead people.
Storm surge is very dangerous natural phenomenon which causes to destroy valuable
properties, lost lives and all socio-economic infrastructures when typhoons attack to
coastal areas. Friction of wind on water surface and decreasing pressure at typhoon
center are main reasons to create high storm surge. The bathymetry and parameters of
typhoon including center typhoon pressure, maximum wind radius, wind velocity, storm
track, river flow, and tidal regime are factors which affected to storm surge. That’s why
the problem is very urgent and important to study.
There have also been many attempts to develop methods for forecasting storm surges in
Vietnam. At present on the coastal areas, all kinds of activities are increased in number
and almost marine constructions need data for designing in which sea water level is very
important because it happens at rare frequencies, meanwhile the observed stations
located along coasts and islands are scarce. That’s reasons why we need to find other
ways to define maximum values of sea level rise occurred in a certain areas. The way
mentioned here is an application of numerical models for simulation. For doing this data
of bathymetry, coastal topography, hydrodynamic parameter such as tide, waves, sea
currents and typhoon characteristics in the interested areas are needed.
According to Le Van Thao et al. (2000), storms occur in Viet Nam unevenly. The most
affected areas are the northern and the central coasts. The southern coast is less affected
both in number and intensity, but damages was more serious because less awareness on
the typhoons of local people. Typhoon Linda in November 1997 was an example and
considered as a very uncommonly strong storm in the past 100 years to the southern
coasts area. There was about 778 people killed, 1142 and 2541 injured and missing,
2789 boats sank etc. The total economic loss was estimated about 480 million USD (Le
Van Thao et al, 2000).
Phu Quoc and Tho Chu islands belonging to Kien Giang province are located in the
western sea of Thailand gulf. They are considered as strategic locations in socioeconomic development as well as defense and security in the south of Viet Nam due to
15
there terrain and resources. For sustainably economic development and environmental
protection, the study all on natural disasters, specially typhoon and storm surges is a
priority tasks. For which we can assess the flood inundation and damages due to typhoon
and storm surges to serve marine spatial planning as well as to make strategy for
mitigation of natural disasters for Phu Quoc islands.
1.1.
Literature reviews
1.1.1. International researches on storm surges
Because of the direness of the storm surge disaster, the studies of theory and scene from
which construct methods, technological modeling to calculate and forecast storm surge,
which have been conducted for so long. According to Brestschneider (1959), different
factors can cause change of the water level in coastal areas during a hurricane are: the
parameter of storm (atmospheric pressure, wind speed ...), the rotary motion of the earth,
wave, and rain. Later, Pore (1965) has added factors: tide, shape of shoreline and water
depth.
Currently there are several methods of calculation and forecast storm surge such as
method uses semi-empirical formula, diagram method, artificial neural systems method
and numerical model methods
In the method using semi-empirical formula (Ippen and Hallerman, 1966), surge
magnitude is calculated based on ground level wind speed, wind fetch length, the angle
between the wind direction and the axis perpendicular to the shoreline and the water
depth. This method is very simple but precision is not high because it does not describe
all the factors which impact on storm surges.
Diagram method (Yang et al, 1970, Horikawa, 1985) is often used to forecast storm
surges for some ports, where have many monitoring data on hurricanes and storm surges.
The content of the method is to construct the monogram based on the relationship
between monitoring data of water level with parameters of hurricane storm (the largest
wind speed, wind direction, reduce of pressure in the center). Therefore, the method is
very limited when data series is not long enough (usually around 100 years if require
result is high precision) and often only true for the nearest observation station.
16
Numerical models method was created to overcome the deficiencies of empirical
measurement data. The advantage of this method is reduction of cost compared with
experimental measurement methods. In addition, this method also allows calculation,
forecast the evolution of the phenomenon based on a lot of assumed scenarios, which
does is not yet exist in reality present but likely to happen in the future.
In studies by numerical models, storm surge phenomenon is modeled based on the
shallow water equations (2 or 3 dimensions). Depending on the purpose, in forecast
about storm surges, 2-dimensional model does not take much time to calculate but it can
achieve full accuracy. When the need for simulation and calculations in more detail, eg
distribution according to the flow rate of the water layer, 3-D model is needed. With
more detail simulation and calculations, such distribution flow rate under water layers
is revealed in 3-dimensional model. At the beginning, the numerical models were built
to simulate storm surge, which are limited by several reasons: (1) Usually only
simulation, calculation of individual phenomena such as tide, wave, storm surges; (2)
The grid is very course, which does not cover about the detailed topography of coastal
area; (3) In addition, many effects that affect to storm surges in the equations system is
ignored. Therefore, accuracy of the results of the model varies among areas or
simulation is very good for a storm but limited with other storms. For example,
Jelesnianski’s model (1965), which has ignored friction component and nonlinear
component, so calculated results were reasonable in spatial distribution of water rise and
the time storm surges is the highest, however tends to overestimate the water height in
some l. SPLASH model (Special Program to List Amplitude of Surge from Huricanes)
was built in 1972 by Jelesnianski and then SLOSH model (Sea, Lake, and Overland
surges from Hurricanes) was developed to simulate the storm surge in coastal areas, sea
and lake, which NOAA (National Oceanic and Atmospheric Administration) used to
simulate coastal flooding caused by storm surge in the United States (Jelesnianski et al,
1984, 1992) but there are many restrictions such as the use a grid with fixed structure,
which cannot simulate the coastal areas with complex topography and shoreline.
The Concept of storm surge in the previous calculations usually understood as the water
level rises due to the impact of the wind stress and reduction of pressure in center of the
17
storm. However, in fact wave stress generated surge wave, which occupies a very
significant part of the storm in the shallow waters. Therefore, recently wave setup has
been interested and considered as an important part in the warning news, forecasts in
countries like the US, Japan, UK. Due to the complexity of the wave setup phenomenon,
calculation has just followed by the analytic formula Longuet- Higgins and Stewart
(1963).
This study has shown that the magnitude of wave set up depends on the horizontal
gradient variation of wave radiation stresses. Longuet-Higgins and Stewart’s theory has
explained the mechanism of phenomenon of rising water and ebb water around break
water area in shallow water zones. Longuet-Higgins and Stewart’s theory proved quite
suitable, when verified with experimental data of Bowen et al (1968) about phenomenon
of rising water and ebb water in points around break water area. Bowen et al's
experiments (1968) on the phenomenon of wave surges and ebb water, which are caused
by waves have been used to verify numerical models, which simulate the phenomenon
of wave propagation in coastal zones as shown in figure 2.
Figure 2. Comparison of the calculated results top, legs and wave height of
Boussinesq 1D model with experimental data of Bowen (1986).
Recently wave setup was considered in calculating total of storm surges by combining
numerical models in many studies. Funakoshi et al (2008) have combined ADCIRC
model which is used to simulate about storm surge and SWAN model, which is used to
simulate wave. This study indicates that, wave setup may contribute 10-15% in extreme
water levels in storms. Another study combined storm surge model and wave model as
18
Chen et. al (2008) in 2005 Hurricane Katrina in the US, which concluded that storm
surge by affection of coastal wave contribute 80% in extreme water levels while other
influences such as tide, surface wave and rising water by wind contributed only 20%.
In 2010, Youl Kim Soo et al have developed model to predict storm surges, which
integrated tide both waves (Surge Wave and Tide - Suwat). This model was designed
with integrated mesh to calculate storm surges in the Tosa Gulf - Japan and the results
are consistent with the measured data, while previously many models not interested
wave setup give lower results. Youl Kim Soo's research also shows that to study wave
setup need to perform on the calculated grid which has detailed resolution. After Youl
Kim Soo model has been used to forecast storm surges in many ports in Japan.
In recent years, due to the development of systems of monitoring and transmit water
level data in real time, data assimilation techniques of water level in tidal forecast model,
from that storm surges has been built and development (Lewis and Derber, 1985;
Thacker and Long, 1988).
To accurately predicting storm surge depends on accurately predicting the field of
pressure and wind in storms. However, if the water level monitoring data is regularly
updated in the forecast calculations, the error will be decrease significant. When
Lionello P. (1996) used data assimilation techniques in water level forecasting models
showed that the storm surge forecasting results in report in Atlantic Beach has reduced
errors up to 50% for forecast from 1 to 3 day
Assess the risks of hurricanes and storm surges also follow the traditional approach of
assessing risk method of natural disasters is based on statistical methods. In developed
countries like the US, Canada, Australia, the European Community (England, Poland,
Croatia, Italy, Netherlands, Spain), Asia (Japan, South Korea, the East Asian countries
(SY Wang et al, 2007), there have many research programs to develop response methods
early. To calculate the possibilities of disaster risk, Monte-carlo (PPMC) method is used
a lot in disaster applications: storms, storm surges, waves and waves in storms, floods,
landslides, earthquakes. Specifically with surges in Australia, scientists have simulated
storm for 3,000,000 years from data of historical hurricanes in 30 years, the US used
19
storm simulated data from 2,000 years from data of historical hurricanes in 100 years,
which is used as input of the storm surge model, from that construct frequency line of
storm surge with period is from 2-100 years and distributed risk map of large wave.
1.1.2. Storm surge researches in Viet Nam
Vietnam is a coastal country with high potential risk of storm surges. That’s why the
study storm surges is paid much attention long time ago with many methods from
experiences to mathematical models.
According to statistical researches, the first study of Vu Nhu Hoan (1988) was presented,
in which storm surges are estimated according to statistical methods and charts.
Recently, Hoang Trung Thanh (2010) used observed data of water levels in the
oceanographic and estuary stations to assess water surge generated by wind and thus
gave overview about time and rise and set down trends at the monitoring stations.
Although there the advantage of being simple and easy to use but limited the application
of statistical methods. Because of very sparsely observed stations, the accuracy of this
method is not so high. Therefore this method is only suitable in some monitoring
stations where data series are long enough and with this reason it is rarely used in
Vietnam.
In research methods using numerical models, there are three main directions being used.
These are included self-built models, research and development of open source models
from abroad; and using commerce models from abroad. These information can be seen
in the researches of Vu Nhu Hoan, Do Ngoc Quynh, Le Trong Dao, Bui Xuan Thong,
Dinh Van Manh, Nguyen Thi Viet Lien, Nguyen Vu Thang and Nguyen Xuan Hien.
When researching storm surges in coastal areas of Tokin Gulf, Le Trong Dao (1998)
have used finite element method to calculate tide and storm surges and had conclusion
that due to large tidal difference up to 4.0 m, so storm surge was more impacted by tidal
regimes. Also by using this method, Nguyen Vu Thang (1999) got result about
prediction storm surges at Hai Phong coast using finite element methods.
Also by using finite element method, in the governmental projects namely KT.03.03,
Do Ngoc Quynh and Pham Van Ninh (1999) used the bi-directional shallow water
20
equations to calculate the tide and storm surges for all Vietnam coastal areas.
Accordingly, the current situation and the risk of storm surges was calculated and
partitioned by latitude. The results of the study have served for disaster prevention and
build coastal constructions. Also according to the finite difference method, Bui Xuan
Thong (2000) has developed cage mesh to increase the details the points need calculated
as well as reducing the time to calculate when the calculate storms surges. In 2001, the
model predicted storm surge had calculate to tidal and design on the cage mesh by the
Institute of Mechanics have been applied on calculated the storm surge with detailed
resolution to 1.0 km serving the coastal constructions such as dikes, jetties, after that,
this model has been applied in many subjects, different projects related to storm surge
in Vietnam. Author Phung Dang Hieu (2013) have built models that predict storm surges
that taking into account the influence of the tide on the system nonlinear shallow water
equations and according different method of SMAC combined with schemetic CIP there
are tertiary accuracy for nonlinear components, The model was applied to simulate
surges and flooding coastal areas of Thua Thien Hue very reliable results when
compared with observation data
In recent years, due to the development of computational systems and information
technologies have had many foreign models are built and developed towards
commercialization as well as shape open source to community develop. The popular
commercial model is being applied in Vietnam as models MIKE Danish Hydraulic
Institute (DHI), SMS model of the US Navy, the Delft-3D model of the Hydraulic
Institute Delft. In the thesis had used Delft 3D- Flow simulation about storm surge in
Phu Quoc Island.
1.2.
Brief description on study area
1.2.1.Natural conditions
Geographical location
Phu Quoc is the biggest island of Vietnam, located in Thai Lan Gulf, Kien Giang
province. It is about 7.5 km from North West of Phu Quoc to the neighboring country
of Cambodia. The distance from Phu Quoc to Rach Gia and Ha Tien cities are relatively
21
112 km and 45 km accordingly. Administratively, Phu Quoc district consists of Phu
Quoc island and 2 other smaller islands namely An Thoi and Tho Chu with total area of
593.05 km2 in which Tho Chu archipelago is farthest from the main land (about 115
km).
Figure 3 .Location of Phu Quoc islands on satellite image
The shape of Phu Quoc island is nearly triangular, base side in the north, narrow
gradually to the south (figure 1.3). The research site would be covered Phu Quoc water
area of 220 km2, from the coastline of island to the water depth up to 20 m. The study
area is defined by the points from A1 to A26 with coordinates (National Coordinate
System VN 2000) showed in table 1.
22
Table 1 .Coordinate of Phu Quoc area shown in map scale of 1/ 50.000
Northern
Eastern
Northern
Eastern
latitude
longitude
latitude
longitude
A1
103° 59' 54.55"
9° 56' 23.54"
A14
103° 59' 47.59"
10° 28' 6.96"
A2
103°59' 43.78"
9° 59' 6.01"
A15
104° 02' 0.92"
10° 26' 9.65"
A3
103° 58' 31.95"
10° 3' 21.62"
A16
104° 04' 8.87"
10° 24' 56.19"
A4
103° 57' 15.30"
10° 11' 16.09"
A17
104° 5' 37.42"
10° 21' 47.14"
A5
103°55' 7.77"
10° 15' 33.24"
A18
104° 5' 22.40"
10° 19' 38.56"
A6
103° 53' 54.89"
10° 16' 35.44"
A19
104° 5' 31.80"
10° 14' 31.85"
A7
103°50' 38.99"
10° 18' 6.27"
A20
104° 2' 46.50"
10° 7' 43.30"
A8
103° 49' 3.85"
10° 22' 8.72"
A21
104° 2' 17.04"
10° 5' 42.87"
A9
103° 50' 8.00"
10° 23' 32.96"
A22
104° 3' 12.90"
10° 3' 55.54"
A10
103° 53' 4.69",
10° 22' 58.51");
A23
104° 3' 7.06"
10° 2' 4.79"
A11
103°54' 57.90"
10° 22' 47.00"
A24
104° 3' 54.09",
10° 0' 52.26"
A12
103° 56' 54.53"
10° 25' 30.01"
A25
104° 2' 58.04"
9° 57' 55.18"
A13
103°57' 14.97"
10° 26' 48.26"
A26
104° 2' 19.32"
9° 56' 17.89"
Point
Point
Topographic characteristics
The typical topography of Phu Quoc island is low hill. The coastline is zigzag, divided
by various channels and rocky mountain. The sea bed bathymetry of Phu Quoc is clearly
distinguished into 2 levels of depths:
+ From 0 – 8 m: generally even and flat. At the southern site, bathymetry is more
complicated with unstable slope, submerged dunes and deep channels due to the impacts
of submarine canyons. The estuarine topography is consisted of submerged dunes, bar
between channels and varies with seasons due to river-sea dynamic interaction.
+ From 8 -20 m: the bathymetry is deeper from the shorelines to the offshore. It is the
boundary of modern sediment deposition area and existing kinds of shorelines: This kind
of shoreline was observed in every original rock before Quaternary era in Phu Quoc
island and other islands, composition is mostly high stable continental sedimentation.
23
1.2.2 Climatic and oceanographic characteristics
In general, Phu Quoc area is belonging to tropical monsoon climate with dry and rainy
seasons annually. Main climatic characteristics computed based on data collected during
1992-2003 in the islands are shown as below.
Temperature: monthly air temperature is presented in table 2. For that annual average
temperature is 27.4oC; hottest in May (28.70C) and coldest in January (26.10C).
Table 2 . Monthly and yearly average temperature in Phu Quoc and Rach Gia (oC)
Location 1
2
3
4
5
6
7
8
9
10
11
12
Year
Rach Gia 25.5 26.3 27.5 28.5 28.4 28.2 27.7 27.5 27.5 27.3 26.7 25.9 27.3
PhuQuoc 26.1 26.8 27.9 28.6 28.7 28.0 27.8 27.6 27.3 26.9 27.1 26.5 27.4
Sunshine: According to yearly data, it can see that sunny hours at Phu Quoc is rather
high in comparison to base value in Viet Nam. It is about 2350 – 2500 hours per year.
Humidity: varying from 74 -87 %, annual average humidity is 81% and minimum value
is less than 50% in dry season and around 60% in rainy season.
Table 3.Monthly and yearly average and minimum humidity (%) at Phu Quoc
Parameter 1
2
3
4
5
6
7
8
9
10
11
12
Year
Meanvalue
77
77
77
80
83
85
86
86
87
86
79
74
81
Min value
40
36
39
43
46
60
61
65
60
50
44
39
36
Precipitation: Yearly rainfall at Phu Quoc is 2983 mm. The rainy season starts from
May to October with about 130 rainy days and total rainfall of 2397 mm, approximately
80%. The dry season lasts from November to April next year with total rainfall of only
20%. Maximum rainfall is in August and minimum value is in February/January. Daily
maximum rainfall is also in August with value of about 330mm.
Table 4.Monthly and yearly average and minimum humidity (%) at Phu Quoc
Parameter 1
Monthly
value
2
3
46.7 23.6 65.1
4
5
6
7
8
9
10
11
12
179.3 259.2 379.7 417.4 508.9 447.8 384.0 195.6 76.4
24
Daily max
77.9 39.3 103.2 127.1 84.1
126.8 196.5 327.1 162.1 132.9 136.0 71.0
Wind: Phu Quoc is within tropical monsoon zone which appears main wind directions
such as North and northeast in winter and west and southwest in summer. Calm wind
just only takes 8% over the year. Monthly wind velocity and main direction at Phu Quoc
is shown in table 5.
Table 5. Monthly wind velocity and main direction at Phu Quoc
Year
I
II
III
IV
V
VI
VII
VIII
IX
X
XI
XII
V(m/s)
2.0
2.0
2.1
2.1
3.3
3.9
4.0
4.6
3.8
1.9
2.2
2.7
Direction
E
E
E/SE
E/SW
W/SW W
W/SW
W
W
E/W
E/NE E/NE
Storms: In general Thailand gulf including Kien Giang province has less storm vents in
comparison to East sea and northern part of Viet Nam coasts. As statistics in recent 60
years (1955-2015), there were fewer than 40 storms hitting to these areas in which there
were only 8 storms attacked Kien Giang coast. Storm season usually occurs in last
months of a year. Despite of less storm, but damages cause by these typhoons were very
serious due to less awareness of local people. The Linda storm occurred in 1997 was
one example.
1.2.3. Hydrological and oceanographic characteristics
a. River system: due to being formed on the small catchment areas, geomorphology and
climate conditions, so river system in the Phu Quoc islands is less developed and mostly
small with very short in length and steeping and later we call springs. The flow in these
springs only exist in rainy season with very small discharge. The main springs are
Duong Dong, Cua Can, Rach Tram, Cua Lap and Ham Ninh.
Duong Dong spring: It is the biggest channel in Phu Quoc originated from the center of
a main island and flowing to the sea in the west coast at Duong Dong estuary. This is
the biggest socio – economic and tourism center of Phu Quoc. In environmental point
of view, the waste water due to all activities is discharged through this channel to cause
pollution seriously for the coastal and estuarine area of Duong Dong town.
25