CMA USA part 1 vol 2 hock
Bạn đang xem bản rút gọn của tài liệu. Xem và tải ngay bản đầy đủ của tài liệu tại đây (2.83 MB, 324 trang )
CMA Part 1
Volume 2: Sections C – E
Financial Planning,
Performance and Control
HOCK international books are licensed only for individual use and may not be
lent, copied, sold or otherwise distributed without permission directly from
HOCK international.
If you did not download this book directly from HOCK international, it is not a
genuine HOCK book. Using genuine HOCK books assures that you have complete,
accurate and up-to-date materials. Books from unauthorized sources are likely outdated
and will not include access to our online study materials or access to HOCK teachers.
Hard copy books purchased from HOCK international or from an authorized
training center should have an individually numbered orange hologram with the
HOCK globe logo on a color cover. If your book does not have a color cover or does
not have this hologram, it is not a genuine HOCK book.
Fifth Edition
CMA
Preparatory Program
Part 1
Volume 2: Sections C – E
Financial Planning,
Performance and Control
Brian Hock, CMA, CIA
and
Lynn Roden, CMA
with
Kevin Hock
HOCK international, LLC
P.O. Box 204
Oxford, Ohio 45056
(866) 807-HOCK or (866) 807-4625
(281) 652-5768
www.hockinternational.com
Published May 2013
Acknowledgements
Acknowledgement is due to the Institute of Certified Management Accountants for
permission to use questions and problems from past CMA Exams. The questions and
unofficial answers are copyrighted by the Certified Institute of Management Accountants
and have been used here with their permission.
The authors would also like to thank the Institute of Internal Auditors for permission to
use copyrighted questions and problems from the Certified Internal Auditor Examinations
by The Institute of Internal Auditors, Inc., 247 Maitland Avenue, Altamonte Springs,
Florida 32701 USA. Reprinted with permission.
The authors also wish to thank the IT Governance Institute for permission to make use
of concepts from the publication Control Objectives for Information and related
Technology (COBIT) 3rd Edition, © 2000, IT Governance Institute, www.itgi.org.
Reproduction without permission is not permitted.
© 2013 HOCK international, LLC
No part of this work may be used, transmitted, reproduced or sold in any form or by any
means without prior written permission from HOCK international, LLC.
ISBN: 978-1-934494-81-3
Thanks
The authors would like to thank the following people for their assistance in the
production of this material:
All of the staff of HOCK Training and HOCK international for their patience in the
multiple revisions of the material,
The students of HOCK Training in all of our classrooms and the students of HOCK
international in our Distance Learning Program who have made suggestions,
comments and recommendations for the material,
Most importantly, to our families and spouses, for their patience in the long hours
and travel that have gone into these materials.
Editorial Notes
Throughout these materials, we have chosen particular language, spellings, structures
and grammar in order to be consistent and comprehensible for all readers. HOCK study
materials are used by candidates from countries throughout the world, and for many,
English is a second language. We are aware that our choices may not always adhere to
“formal” standards, but our efforts are focused on making the study process easy for all
of our candidates. Nonetheless, we continue to welcome your meaningful corrections and
ideas for creating better materials.
This material is designed exclusively to assist people in their exam preparation. No
information in the material should be construed as authoritative business, accounting or
consulting advice. Appropriate professionals should be consulted for such advice and
consulting.
Dear Future CMA:
Welcome to HOCK international! You have made a wonderful commitment to yourself
and your profession by choosing to pursue this prestigious credential. The process of
certification is an important one that demonstrates your skills, knowledge and commitment to your work.
We are honored that you have chosen HOCK as your partner in this process. We know
that this is a great responsibility, and it is our goal to make this process as painless and
efficient as possible for you. To do so, HOCK has developed the following tools for your
use:
A Study Plan that guides you, week by week, through the study process. You
can also create a personalized study plan online to adapt the plan to fit your
schedule. Your personalized plan can also be emailed to you at the beginning of
each week.
The Textbook that you are currently reading. This is your main study source and
contains all of the information necessary to pass the exam. This textbook follows
the exam contents and provides all necessary background information so that you
don’t need to purchase or read other books.
The Flash Cards include short summaries of main topics, key formulas and
concepts. You can use them to review whenever you have a few minutes, but
don’t want to take your textbook along.
ExamSuccess contains original questions and questions from past exams that
are relevant to the current syllabus. Answer explanations for the correct and incorrect answers are also included for each question.
Practice Questions taken from past CMA Exams that provide the opportunity to
practice the essay-style questions on the Exam.
A Mock Exam enables you to make final preparations using questions that you
have not seen before.
Teacher Support via our online student forum, e-mail, and telephone throughout your studies to answer any questions that may arise.
Class Recordings are audio recordings of classes conducted and taught by
HOCK lecturers. With the Class Recordings you are able to have the benefits of
attending classes without actually being required to be near a location where
classes are held.
We understand the commitment that you have made to the exams, and we will match
that commitment in our efforts to help you. Furthermore, we understand that your time
is too valuable to study for an exam twice, so we will do everything possible to make
sure that you pass the first time.
I wish you success in your studies, and if there is anything I can do to assist you, please
contact me directly at
Sincerely,
Brian Hock, CMA, CIA
President and CEO
CMA Part 1
Table of Contents
Table of Contents
Section C – Cost Management ......................................................................................... 1
Classifications of Costs .................................................................................................... 2
The Difference Between Costs and Expenses
Direct Versus Indirect Costs
Costs Based on Level of Production (Fixed, Variable and Mixed Costs)
Production vs. Period Costs
Types of Product Costs
Other Costs and Cost Classifications
Cost of Goods Sold (COGS) and Cost of Goods Manufactured (COGM)
2
2
3
6
6
8
11
Introduction to Cost Accumulation Systems ................................................................ 13
The Flow of Manufacturing Costs .................................................................................. 14
1. Materials Inventory
2. Payroll
3. Factory Overhead Control
4. Work-in-Process Inventory
5. Finished Goods Inventory
6. Cost of Goods Sold
14
14
15
15
16
16
Costing Systems.............................................................................................................. 18
1. Standard Costing
2. Normal Costing
3. Extended Normal Costing
4. Actual Costing
Benefits and Limitations of Each Costing System
18
19
19
19
21
Accounting for Direct Manufacturing Inputs in Standard Costing .............................. 23
Overhead Allocation ........................................................................................................ 27
Manufacturing Overhead Allocation
Traditional (Standard) Allocation Method
Determining the Basis of Allocation
Calculating the Manufacturing Overhead Allocation Rate
Determining the Level of Activity
Allocating Manufacturing Overhead to the Units
The Process of Accounting for Factory Overhead
Over-Applied and Under-Applied Manufacturing Overhead
Comprehensive Example of Accounting for Fixed Overhead and FOH Variances
27
28
28
29
31
35
36
38
40
Process Costing .............................................................................................................. 45
Steps in Process Costing
1. Determine the Physical Flow of Goods
2. Calculate the Number of Units Started and Completed
© 2013 HOCK international, LLC. For personal use only by original purchaser. Resale prohibited.
46
47
47
i
Table of Contents
3. Determine When the Materials Are Added to the Process
4. Calculate the Equivalent Units of Production (EUP)
5. Calculation of Costs Incurred During the Period
6. Calculation of the Cost per EUP
7. Allocation of the Costs to the Products
Process Costing Diagram – FIFO
Process Costing Diagram – Weighted Average
Process Costing Summary
Process Costing Examples
Spoilage in Process Costing
1. How Many Units Were Spoiled
2. How are the spoiled units classified – as normal or abnormal?
3. Calculating the Costs Allocated to Each Spoiled Unit
4. What is Done with the Costs Allocated to the Spoiled Units?
CMA Part 1
48
48
55
55
55
57
58
59
60
65
65
65
66
66
Job-Order Costing ........................................................................................................... 70
Operation Costing ........................................................................................................... 72
Activity-Based Costing ................................................................................................... 73
Traditional Costing versus ABC
ABC and External Financial and Tax Reporting
The ABC Process
Benefits and Limitations of Activity-Based Costing
73
74
75
77
Life-Cycle Costing ........................................................................................................... 82
Customer Life-Cycle Costing ......................................................................................... 84
Joint Products and Byproducts ..................................................................................... 85
Methods of Allocating Costs to Joint Products
1. Relative Sales Value at Splitoff Method (or Gross Market Value Method)
2. Estimated Net Realizable Value (NRV) Method
3. Physical Measure and Average Cost Methods
4. Constant Gross Profit (Gross-Margin) Percentage Method
Accounting for Byproducts
The Production Method: Inventory the Byproduct Costs
The Sales Method: Revenue from the Byproduct
Comprehensive Example of Joint and Byproduct Costing
85
85
87
89
91
93
93
94
95
Variable and Absorption Costing ................................................................................. 101
Fixed Factory Overheads Under Absorption Costing
Fixed Factory Overheads Under Variable Costing
Effects of Changing Inventory Levels
Income Statement Presentation
The Income Statement under Absorption Costing
The Income Statement under Variable (Direct) Costing
Absorption Costing versus Variable Costing: Benefits and Limitations
ii
101
101
102
103
103
103
104
© 2013 HOCK international, LLC. For personal use only by original purchaser. Resale prohibited.
CMA Part 1
Table of Contents
Answer to the Variable/Absorption Costing Example
What if the Number of Units is Not Known or is Not Meaningful?
107
108
Service Cost Allocation................................................................................................. 116
Allocating Costs of A Single (One) Service or Support Department to Multiple Users
Allocating Costs of Multiple Service or Support Departments
The Direct Method
The Step-Down Method
The Reciprocal Method
Comprehensive Example of Direct, Step and Reciprocal Methods
116
119
120
120
121
122
Estimating Fixed and Variable Costs ........................................................................... 125
High-Low Points Method
Regression Analysis
Forecasting Total Costs
125
127
129
Operational Efficiency ................................................................................................... 130
Just-in-Time (JIT) Inventory Management Systems
Kanban
Materials Requirements or Material Resource Planning (MRP)
MRP and Making Calculations in Manufacturing
Outsourcing
Theory of Constraints (TOC)
Drum-Buffer-Rope
Calculating Throughput Contribution Margin
Capacity Level and Management Decisions
Capacity Level and its Effect on Financial Statements
130
131
132
132
136
136
138
142
147
148
Business Process Performance ................................................................................... 155
The Value Chain
Primary Value Chain Activities
Steps in Value Chain Analysis
Process Analysis
Business Process Reengineering
Benchmarking Process Performance
Activity-Based Management (ABM)
The Concept of Kaizen
The Costs of Quality
Calculating the Costs of Quality
Total Quality Management (TQM)
Total Quality Management and Activity-Based Management
ISO 9000
Quality Management and Productivity
Other Quality Related Issues
© 2013 HOCK international, LLC. For personal use only by original purchaser. Resale prohibited.
155
156
156
157
158
159
160
160
161
163
165
170
171
171
171
iii
Table of Contents
CMA Part 1
Section D – Internal Controls ....................................................................................... 174
Risk Assessment, Controls and Risk Management ................................................... 175
Corporate Governance
175
Internal Control .............................................................................................................. 178
Internal Control Definition and Objectives
Who Is Responsible for Internal Control?
Components of Internal Control
The Relationship Between the Objectives and the Components of Internal Control
Component 1: The Control Environment
Component 2: Risk Assessment
Component 3: Control Activities
Component 4: Information and Communication
Component 5: Monitoring
Segregation of Duties
Responsibilities of the Board of Directors
Responsibilities of the Full Board
Audit Committee Requirements, Responsibilities and Authority
Foreign Corrupt Practices Act (FCPA)
Sarbanes-Oxley Act
Title I - Public Company Accounting Oversight Board (PCAOB)
Title II – Auditor Independence
Title III – Corporate Responsibility
Title IV – Enhanced Financial Disclosures
SEC Release 33-8810 – Guidance for Management
PCAOB Auditing Standard No. 5 – Guidance for External Auditors
Top-Down Approach Versus Bottom-Up Approach
What Internal Control Can and Cannot Do
178
180
181
181
182
184
186
190
191
192
194
194
195
200
201
201
203
204
205
207
212
216
217
Internal Auditing ............................................................................................................ 218
Definition of Internal Auditing
The Internal Audit Charter
Independence and Objectivity in Internal Auditing
Requirement for Internal Auditor Proficiency
Responsibilities and Limit of Responsibilities
The Organizational Status of the Internal Audit Function
The Difference Between Internal Auditors and External Auditors
Types of Engagements
Differences Between Assurance Services and Consulting Services
Assurance Services
Consulting Services
Quality Auditing
Quality Assurance Reviews of the Internal Audit Function
iv
218
219
219
219
220
221
222
224
224
225
228
229
230
© 2013 HOCK international, LLC. For personal use only by original purchaser. Resale prohibited.
CMA Part 1
Table of Contents
The Auditing Process
Determining Which Engagements to Conduct
Planning the Audit
Understanding Internal Controls in the Planning of the Audit
The Internal Audit Program
Audit Evidence
Audits of Financial Controls
Types of Controls
Accounting Controls Versus Administrative Controls
Objectives of an Audit of Controls
Testing Compliance with Controls
Control Breakdowns
Detection and Prevention of Fraud
Consideration of Fraud in the Planning of a Financial Statement Audit
Internal Audit Reports
Oral Reports and Interim Reports
Preparing the Final Written Internal Audit Report
Contents of the Final Report
Summary Reports
Report Review and Distribution
Types of Incidents That Should Be Reported
Auditor Follow Up
Computerized Audit Techniques
231
231
232
236
240
241
247
247
248
248
249
249
250
251
253
253
254
254
256
256
257
257
258
Systems Controls and Security Measures .................................................................. 261
Introduction to Systems Controls
Threats to Information Systems
The Classification of Controls
General Controls
Organization and operation of the computer facilities
General Operating Procedures
Equipment Controls
Equipment Access and Data Access Controls
Segregation of Duties
System and Program Development and Change Controls
Physical Access Controls
Hardware Controls for Networks
File Security and Storage Controls
Application Controls
Input Controls
Processing Controls
Output Controls
Controls Classified as Preventive, Detective and Corrective
© 2013 HOCK international, LLC. For personal use only by original purchaser. Resale prohibited.
261
262
263
264
264
265
265
265
266
268
274
274
275
276
276
279
281
282
v
Table of Contents
Controls Classified as Feedback, Feedforward and Preventive
CMA Part 1
282
Internet Security ............................................................................................................ 284
Viruses, Trojan Horses and Worms
Cybercrime
Defenses Against Cybercrime
Encryption
285
286
288
289
Contingency Planning................................................................................................... 290
Disaster Recovery
292
Section E – Professional Ethics ................................................................................... 294
Introduction to Ethics
Business Ethics
Statement of Ethical Professional Practice
294
294
297
Answers to Questions................................................................................................... 301
vi
© 2013 HOCK international, LLC. For personal use only by original purchaser. Resale prohibited.
Section C
Section C – Cost Management
Section C – Cost Management
Section C represents 25% of the Part 1 Exam. This section focuses on the process of determining and also
ways of controlling how much it costs to produce a product. This includes several types of cost accumulation
and cost allocation systems as well as sources of operational efficiency and business process performance for
a firm. An important concept in the business process performance portion is the concept of competitive
advantage and how a firm can attain it. Major topics include:
•
Overhead Cost Allocation
•
Process Costing
•
Joint-product and Byproduct Costing
•
Activity-based Costing
•
Job Order Costing
•
Life-cycle Costing
•
Variable and Absorption Costing
•
Service Cost Allocation
•
Estimating Fixed and Variable Costs
•
Operational Efficiency
•
Business Process Performance
In the area of costing systems, the three that are the most complicated are:
1)
Process Costing
2)
Activity-based Costing
3)
Variable and Absorption Costing
This is not to say that the others are not important or will not be tested, but simply that these three are
where you will need to spend more time to ensure that you fully understand them for the Exam.
In our ongoing effort to keep your study materials up to date, we may have posted minor corrections or
additions after the publication of this book. Please see the Corrections and Omissions forum on
www.hockinternational.com for any minor changes.
© 2013 HOCK international, LLC. For personal use only by original purchaser. Resale prohibited.
1
Classifications of Costs
CMA Part 1
Classifications of Costs
The first thing that needs to be covered for this Section is a number of terms and concepts related to the
different classifications of costs. This is a large element of the Exam (both directly and indirectly) and as such,
it is important that from the very beginning a candidate understands the different types, classifications and
treatments of costs.
The Difference Between Costs and Expenses
Costs and expenses are two different things.
1)
Costs are resources given up to achieve an objective.
2)
Expenses are costs that have been charged against revenue in a specific accounting period.
“Cost” is an economic concept, while “expense” is an accounting concept. A cost need not be an expense, but
an expense was a cost before it became an expense. Most costs eventually do become expenses, such as
manufacturing costs that reach the income statement as Cost of Goods Sold when the units they are attached
to are sold, or the cost of administrative fixed assets that have been capitalized on the balance sheet and
subsequently expensed over a period of years as depreciation.
However, some costs do not reach the income statement. Implicit costs a such as opportunity costs b never
become expenses in the accounting records, but they are costs nonetheless because they represent resources
given up to achieve an objective.
Direct Versus Indirect Costs
Direct costs are costs that can be traced directly to a specific cost object. A cost object is anything for
which a separate cost measurement is recorded. It can be a function, an organizational subdivision, a contract
or other work unit for which cost data are desired and for which provision is made to accumulate and measure
the cost of processes, products, jobs, capitalized projects, etc. Examples of direct costs that we will spend a
lot of time talking about are direct materials and direct labor used in the production of products.
Indirect costs are costs that cannot be identified with a specific cost object. In manufacturing, overhead is
an indirect cost. Other indirect costs include support functions such as IT, maintenance and security and
managerial functions such as executive management and other supervisory functions.
a
b
Implicit costs are costs that do not involve any specific cash payment and are not recorded in the accounting records.
An opportunity cost is the contribution to income that is lost by not using a limited resource in its best alternative use.
Both implicit costs and opportunity costs are discussed in more detail later.
2
© 2013 HOCK international, LLC. For personal use only by original purchaser. Resale prohibited.
Section C
Classifications of Costs
Costs Based on Level of Production (Fixed, Variable and Mixed Costs)
In the following table are the main groups of costs based on their behavior as the level of production
changes. For these three types of costs you need to know both how the cost per unit changes and how the
total cost changes as the level of production changes.
Fixed costs
Fixed costs do not change within the relevant range of production. The total
amount of these costs does not change with a change in production.
However, the cost per unit decreases as production increases.
Variable costs
Variable costs are those that are incurred only when a product is made, such as
material or labor. The per unit variable cost remains unchanged as
production increases or decreases while total variable cost increases as
production increases and decreases as production decreases.
Note: Because discounts are received when more units are purchased, it may
appear that variable costs per unit decrease as production increases. However,
companies do not order units one at a time. As part of the budgeting process a
company determines how many of a particular item it will need to purchase
during the year and the cost per unit for that particular quantity of units is used
in the budget for each unit purchased. This means that variable costs do not
change as the production levels change for the company.
Mixed costs
Mixed costs have both a fixed and a variable component. An example is a data
plan on a smartphone. Unless you have an unlimited usage plan, you pay a fixed
amount each month that includes a usage allowance of a certain amount of data.
If you go over that allowance, you pay a specified amount per megabyte used.
The overage charge is a variable cost based on the number of megabytes of data
used over and above your data allowance for the month.
Having looked at the above table and the basics of these classifications, we will now examine in greater depth
the different ways in which fixed and variable costs behave in the production process as the production level
changes. It is important that you know how total costs and costs per unit change as production changes. This
fundamental behavior of fixed and variable costs is used in other sections of the CMA Part 1 exam as well as
in the CMA Part 2 exam. Although this is not inherently difficult, we will look in more detail at this subject
because it is such an underlying element of the process.
Variable Costs
Variable costs are those costs that are incurred only if the company actually produces something. This means
that if a company produces no units (sits idle for the entire period), there will be no variable costs incurred by
the company. Direct material and direct labor are usually variable costs. (There are some situations in which
direct labor may be a fixed cost as in the calculation of throughput contribution margin, covered later under
“Theory of Constraints,” but we do not need to worry about those situations for this purpose.)
As the production level increases, the total amount of variable costs will increase, but the variable cost
per unit will remain unchanged.
Note: This topic will be covered in many other areas of the Exams, and is presented here only for
awareness purposes. The selling price per unit minus all unit variable costs is equal to the unit contribution. Contribution is the amount from the sale that the company is able to put toward the covering of fixed
costs or profit after the variable costs have been covered. Contribution margin is a measure of
contribution as a percentage of the sales price.
© 2013 HOCK international, LLC. For personal use only by original purchaser. Resale prohibited.
3
Classifications of Costs
CMA Part 1
Fixed Costs
Fixed costs are costs that do not change as the level of production changes – within a relevant range. The
relevant range is the range of production in which the cost is fixed. This means that within the
relevant range, an increase in the units produced will not cause an increase in the total fixed costs.
Fixed costs are best described by looking at a factory as an example. A factory has the capacity to produce a
certain number of units. As long as production is between 0 and that number of units, the cost for the factory
will remain unchanged. However, once the level of production exceeds the capacity of the factory, the
company will need to build (or otherwise acquire) a second factory. This will increase the fixed costs as the
company moves to another relevant range.
Within the relevant range of production the total fixed costs will remain unchanged, but the fixed costs
per unit will decrease as the level of production increases.
Note: Over a large enough time period, all costs will behave like variable costs. In the short term,
some costs may be fixed (such as a factory), but over a longer period of time, the company may be able to
change its factory situation so that the factory cost also becomes variable.
Mixed Costs
In reality, many costs are a combination of fixed and variable elements. These are mixed costs. Mixed costs
may be semi-variable costs or semi-fixed costs.
A semi-variable cost has both a fixed component and a variable component. There is a basic fixed amount
that must be paid regardless of activity, even if there is no activity. And added to that fixed amount is an
amount that varies with activity. Utilities are an example. Some basic utility expenses are required just to
maintain a factory building, even if no production is taking place. Electric service, water service, and other
utilities usually must be continued. So that basic amount is the fixed component of utilities. If production
begins (or resumes), the cost for utilities increases by a variable amount, depending upon the production
level. But the fixed amount does not change. Another example of a semi-variable cost is a salesperson who
receives a base salary plus a commission for each sale made. The base salary is the fixed component of the
salesperson’s salary, and the commission is the variable component.
A semi-fixed cost is fixed over a given, small range of activity, and above that level of activity, the cost
suddenly jumps. It stays fixed again for a while at the higher range of activity, and when the activity moves
out of that range, it jumps again. A semi-fixed cost moves upward in a step fashion, staying at a certain level
over a small range and then moving to the next level quickly. All fixed costs behave this way, and a wholly
fixed cost is also fixed only as long as activity remains within the relevant range. However, a semi-fixed cost
is fixed over a smaller range than the relevant range of a wholly fixed cost. An example of a semi-fixed cost is
the nursing staff in a hospital. If the hospital needs one nurse for every 25 patients, then each time the
patient load increases by 25 patients, one additional nurse will be hired and total nursing salaries will jump by
the additional nurse’s salary. That is in contrast to administrative staff salaries at the same hospital, which
might remain fixed until the patient load increases by 250 patients, at which point an additional admitting
clerk would be needed. The administrative staff salaries are wholly fixed costs (over the relevant range),
whereas the nursing staff salaries are semi-fixed costs.
The difference between a semi-variable and a semi-fixed cost is that the semi-variable cost starts out at a
given base level and moves upward smoothly from there as activity increases. A semi-fixed cost moves
upward in steps.
Total Costs
Total costs consist of total fixed costs + total variable costs. The lowest possible total cost occurs when
nothing is produced or sold, because at an activity level c of zero, the only cost will be fixed costs. Total costs
c
“Activity level” or “level of activity” is used to refer to various types of activity. It can refer to production volume in
number of units of output, the number of units of inputs to the production process, sales volume, or to any other activity
being performed.
4
© 2013 HOCK international, LLC. For personal use only by original purchaser. Resale prohibited.
Section C
Classifications of Costs
begin at the fixed cost level and rise by the amount of variable cost per unit for each unit of increase in
activity. In theory at least, total costs graph as a straight line that begins at the fixed cost level on the Y
intercept and rises at the rate of the variable cost per unit for each unit of increase in activity.
The cost function for total manufacturing costs is
Y = F + VX
Where:
Y = Total Costs
F = Fixed Costs
V = Variable Costs
X = Total Production
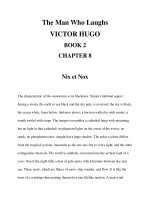
To illustrate, below is a graph of total manufacturing costs for a company with fixed manufacturing costs of
$700,000 and variable manufacturing costs of $20 per unit produced. Total cost is on the Y-axis, while total
production is on the X-axis. The cost function for this company’s total manufacturing costs is
Y = $700,000 + $20X
The total cost line on the graph is a straight line beginning at $700,000 on the Y axis where X is 0 and
increasing by $200,000 for each production increase of 10,000 units (because 10,000 units multiplied by $20
equals $200,000).
This should look familiar to you, because this is another use for linear regression analysis, which we talked
about in the “Forecasting” topic under “Trend Projection and Regression Analysis” in relation to using simple
regression analysis to make forecasts. You will see this same concept again later in this section, under the
topic of “Estimating Fixed and Variable Costs.”
Y
$2,100,000
$1,900,000
$1,700,000
$1,500,000
$1,300,000
$1,100,000
$900,000
$700,000
$600,000
0
10K
20K
30K
40K
50K
60K
© 2013 HOCK international, LLC. For personal use only by original purchaser. Resale prohibited.
70K
X
5
Classifications of Costs
CMA Part 1
Production vs. Period Costs
In addition to the classification of costs based on their behavior as production changes, costs can also be
classified based on their purpose. The main distinction of costs that are based on purpose is that of
Production (or Product) Cost vs. Period Cost. It is important to know this.
Note: Period costs can be fixed or variable, and production costs can be fixed or variable. So these
different classifications are not mutually exclusive from each other.
Product Costs (also called Inventoriable Costs)
Product costs (also called inventoriable costs) are those costs that go directly into the production process,
without which the product could not be made. Product costs are “transferred” to each unit and will be carried
on the balance sheet as inventory when production is completed. When the item is sold, the cost will be
transferred from the balance sheet to the income statement where it is classified as cost of goods sold, which
is an expense.
The main types of product costs are: 1) materials (both direct and indirect); 2) labor (both direct and
indirect); and 3) manufacturing overhead (both fixed and variable). These different product costs can be
combined and given different names as outlined in the tables below. You need to know what types of costs
are included in the different classifications.
Note: This definition of product cost is in accordance with financial reporting purposes. However, there are
also other types of “product costs” for pricing and other purposes, and we will take a look at those later in
this section.
Types of Product Costs
This table includes the main costs that are incurred in the production process.
6
Direct labor
These are the costs of labor that can be directly traced to the production of a unit.
Assembly line workers are direct labor costs for a manufacturing company, and the
compensation of an auditor is direct labor for an auditing firm.
Direct material
These are the materials that are directly put into the finished product. The costs
included in the direct material cost are all of the costs associated with acquiring it –
the item itself, shipping, insurance and taxes, among others. Common examples of
direct materials are plastic and components.
Manufacturing
overhead
These are the company’s costs related to the production process that are not direct
material or direct labor, but are necessary costs of production. Examples are indirect
labor, indirect materials, rework costs, electricity and other utilities, depreciation of
plant equipment, and factory rent.
Indirect labor
Indirect labor is the labor that is part of the overall production process but doesn’t
come into direct contact with the product. The maintenance department is a
common example. Indirect labor is a manufacturing overhead cost.
Indirect material
Similar to indirect labor, indirect materials are materials that are not the main
components of the finished goods. Examples are glue, screws and nails and other
materials that may not even be physically incorporated into the finished good
(machine oils, lubricants, and miscellaneous supplies). Indirect materials are a
manufacturing overhead cost.
© 2013 HOCK international, LLC. For personal use only by original purchaser. Resale prohibited.
Section C
Classifications of Costs
Groupings of Product Costs
The five main types of product costs in the previous table can be further combined to create different cost
classifications. The three classifications that you need to be aware of are in the following table.
Prime costs
Prime costs are the costs of direct material and direct labor. These are the direct
inputs, or the direct costs of manufacturing.
Manufacturing
costs
Manufacturing costs include the prime costs and manufacturing overhead
applied. These are all of the costs that need to be incurred in order to actually
produce the product. This does not include selling or administrative costs, which are
period costs.
Conversion costs
Conversion costs include manufacturing overhead (both fixed and variable)
and direct labor. These are the costs that are required to convert the direct
materials into the final product.
Note that direct labor is both a prime cost and a conversion cost.
Period Costs, or Nonmanufacturing Overheads
Period costs, as compared to product costs, are not involved in the production of the product. Even if these
costs were not incurred the product could still be manufactured. Period costs are usually expensed when they
are incurred.
The number of period costs is almost unlimited because period costs include essentially everything other than
the product costs (all costs have to be either a product cost or a period cost). The more commonly used
examples of period costs include selling, administration and accounting, but period costs are all the costs of
any department that is not involved in production.
Period costs can be variable, fixed or mixed, but they are not included in the calculation of cost of goods sold
or cost of goods manufactured (both of these are covered later). As stated above, for financial reporting
purposes, these costs are expensed to the income statement as they are incurred.
However, for internal decision-making, some period costs may be allocated to the production
departments and then to the individual units. This is done so that the company can set a price for each
product that covers all of the costs the company incurs. We will discuss this type of allocation in the topic of
Service Cost Allocation.
Note that this type of overhead allocation of period costs to production will not be reflected in the external
financial statements issued by the company, because it is not proper according to U.S. GAAP, nor is it
proper under IFRS. According to both U.S. GAAP and IFRS, period costs should be expensed in the period
when they are incurred. This type of overhead allocation would be used for internal decision making only.
The number of classifications of period costs that a company can use on its income statement will depend
upon that company. Examples include general and administrative, selling, accounting, depreciation (of
nonproduction facilities), and so on.
© 2013 HOCK international, LLC. For personal use only by original purchaser. Resale prohibited.
7
Classifications of Costs
CMA Part 1
Other Costs and Cost Classifications
In addition to all of the costs and classifications listed above, there are some more types of costs with which a
candidate must be familiar.
Explicit costs
Explicit costs are also called out-of-pocket costs. Explicit costs involve payment of cash
and include salaries, office supplies, interest paid on loans, payments to vendors for raw
materials, and so forth. Explicit costs are the opposite of implicit costs. Most explicit costs
eventually become expenses, though the timing of their recognition as expenses may be
delayed, as when inventory is purchased and its cost becomes an expense when it is sold.
Implicit costs
An implicit cost, also called an imputed cost, is a cost that does not involve any specific
cash payment and is not recorded in the accounting records. Implicit costs are also called
economic costs. They cannot be specifically segregated in financial reports, but they are
needed for use in a decision-making process. Interest or a cost of capital is often an
implicit or imputed cost. For example, in a loan that does not have a stated interest rate,
an interest rate will often be imputed to determine the cost of the loan. This imputed
rate is assumed and is based on the market rate or rates for similar loans. The imputed
interest amount decreases the amount of principal assumed to be repaid. The interest
does not exist separate from the principal, but it is necessary for use in decision-making.
Implicit costs do not become expenses.
Opportunity
costs
An opportunity cost is a type of implicit cost. Opportunity cost is an economics term, and
opportunity cost is considered an economic cost. It is the contribution to income that is
lost by not using a limited resource in its best alternative use. When calculating the
opportunity cost, it includes only the expenditures that would not be made in the other
available alternatives and/or the contribution that would have been earned if an
alternative decision had been made.
Any time that money is invested or used to purchase something, there is lost return from
the next best use of that money. Often times, that lost return is interest. If the money
had not been used to purchase inventory, for example, it could have been deposited in a
bank and earned interest. The lost interest can only be calculated for the time period
during which the cash flows are different between the two options.
Carrying
costs
These are the costs that the company incurs when it carries inventory. Carrying costs
include: rent and utilities related to storage; insurance and taxes on the inventory; costs
of employees who manage and protect the inventory; damaged or stolen inventory; the
lost opportunity cost of having money invested in inventory; and other storage costs.
Because storage does not add value to the items themselves, storage costs are expensed
on the income statement as incurred. They are not included in inventory (in other words,
they are not included in the balance sheet).
8
Sunk costs
These are costs that have already been incurred and cannot be recovered. Sunk costs are
irrelevant in the decision-making process because of the fact that they have already
been incurred and no present or future decision can change that fact.
Committed
costs
Committed costs are costs for the company’s infrastructure. They are costs required to
establish and maintain the readiness to do business. Examples would be intangible assets
such as a franchise and fixed assets such as property, plant and equipment. They are
fixed costs that are usually on the balance sheet as assets and become expenses in the
form of amortization and depreciation.
Discretionary
costs
These are costs that may or may not be spent, at the decision of a manager. In the short
term, discretionary costs will not cause an adverse effect on the business if they are not
incurred, but in the long run they do need to be spent. These are cost decisions that are
made periodically and are not closely related to input or output decisions. Furthermore,
the value added and the benefits obtained from spending the money cannot be precisely
defined. Advertising, research and development (R&D) and employee training are usually
given as examples of discretionary costs. Discretionary costs may be fixed costs, variable
costs, or mixed costs.
© 2013 HOCK international, LLC. For personal use only by original purchaser. Resale prohibited.
Section C
Classifications of Costs
Marginal
costs
These are the costs necessary to produce one more unit.
Engineered
costs
Engineered costs are costs that have a definite physical relationship to the activity base or
measure. They result from activities that have well defined cause and effect relationships
between inputs and outputs and between costs and benefits. They are called “engineered
costs” because engineers can specify precisely how many inputs are required to generate
a specific output. The value added by activities associated with engineered costs is fairly
clear and easy to measure. Engineered costs are variable costs in their cost behavior.
Direct materials and direct labor are engineered costs. Indirect resources that vary with
product specifications and production volume are also engineered costs, though the cause
and effect relationships are not as precise for indirect resources as they are for direct
labor and direct materials. Relationships for indirect resources can be established using
statistical techniques such as regression analysis and correlation analysis.
Note: When overtime must be worked, the overtime premium that is paid to the workers is considered to
be factory overhead. The overtime premium is the amount that the wage increases for overtime work.
For example, if direct labor is paid $20 per hour for regular hours and time and-a-half, or $30 per hour, for
overtime hours worked in excess of 40 hours per week, $10 per hour of the amount paid for the overtime
work is considered overhead. The regular rate of $20 per hour is classified as direct labor, even though it is
worked in excess of regular hours. The half-time premium of $10 additional paid per hour is classified as
factory overhead. It is not charged to the particular units worked on during the overtime hours, because
the units worked on could just as easily by different units, if the jobs to be done had simply been
scheduled differently. As overhead, the overtime premium paid is allocated equally among all units
produced during the period.
However, if the need to work overtime is the result of a specific job or customer request, the overtime
premium should be charged to that specific job and not included in the overall overhead amount to be
allocated.
© 2013 HOCK international, LLC. For personal use only by original purchaser. Resale prohibited.
9
Classifications of Costs
CMA Part 1
The following information is for the next four questions: The estimated unit costs for a company
using absorption (full) costing and planning to produce and sell at a level of 12,000 units per month are
as follows.
Cost Item
Estimated Unit Cost
Direct materials
$32
Direct labor
20
Variable manufacturing overhead
15
Fixed manufacturing overhead
6
Variable selling
3
Fixed selling
4
Question 1: Estimated conversion costs per unit are:
a)
$35
b)
$41
c)
$48
d)
$67
Question 2: Estimated prime costs per unit are:
a)
$73
b)
$32
c)
$67
d)
$52
Question 3: Estimated total variable costs per unit are:
a)
$38
b)
$70
c)
$52
d)
$18
Question 4: Estimated total costs that would be incurred during a month with a production level of 12,000
units and a sales level of 8,000 units are:
a)
$692,000
b)
$960,000
c)
$948,000
d)
$932,000
(CMA Adapted)
10
© 2013 HOCK international, LLC. For personal use only by original purchaser. Resale prohibited.
Section C
Classifications of Costs
Cost of Goods Sold (COGS) and Cost of Goods Manufactured (COGM)
Now that we have looked at all of the different classifications of costs and their different behaviors, we will
turn our attention to using these different costs in accounting calculations. We will examine the calculation of
the cost of goods sold (COGS) and the cost of goods manufactured (COGM). Though these two items are
somewhat similar, they are very different in one key respect. COGS is an external reporting figure and it will
be reported on the income statement. It is the cost of producing the units that were actually sold during the
period. COGM, on the other hand, is an internal number and is not reported on either the balance sheet or the
income statement. It represents the cost of the goods that were completed during the period. COGM is,
however, used in the calculation of the cost of goods sold for a company that produces its own inventory. The
calculation of both numbers is looked at in more detail below.
The process of calculating the cost of producing an item is a very important one for any company. It is critical
that the cost that is calculated represents the complete cost of production. If the company does not calculate
the cost of production correctly, it will charge a price for the product that will be incorrect. The result will be
either low sales if the price is too high or low profits if the price is too low.
Additionally, as we have already covered, it is this production cost that will be included in the balance sheet
as the value of inventory when the item is completed. When the item is sold, these costs will be transferred to
the income statement as cost of goods sold. Costs that are not production costs are period costs, and they
are generally expensed as incurred (for example: carrying costs, general and administrative costs, and so
on).
Due to this need to determine the cost of production accurately, the information that accountants provide to
management regarding the costs of the company is crucial. Furthermore, it is beneficial to provide this
information quickly and often, so that the company can make any necessary corrections to pricing as soon as
possible.
Calculating Cost of Goods Sold
COGS represents the cost to produce or purchase the units that were sold during the period. It is perhaps the
largest individual expense item on the income statement. As such, it is important that this amount is
calculated accurately.
COGS is calculated using the following formula:
Beginning finished goods inventory
+
Purchases or cost of goods manufactured
−
Ending finished goods inventory
=
Cost of Goods Sold
This written formula is a simplification of what is actually occurring in reality in that it assumes all of the units
were either sold during the period or were still in ending inventory. This does not always happen in reality
because units may be damaged, stolen or lost. However, for the Part 1 Exam, this formula is sufficient.
Calculating Cost of Goods Manufactured
The COGM represents the cost of the units completed and transferred out of work-in-process during the
period. For a manufacturing company this amount will be part of the cost of goods sold calculation. COGM
does not include the cost of work that was done on units that were not finished during the period.
© 2013 HOCK international, LLC. For personal use only by original purchaser. Resale prohibited.
11
Classifications of Costs
CMA Part 1
COGM is calculated using the following formula:
Direct Materials Used*
+
Direct Labor Used
+
Manufacturing Overhead Applied
=
Total Manufacturing Costs
+
Beginning Work-in-process Inventory
−
Ending Work-in-process Inventory
=
Cost of Goods Manufactured
* Direct Materials Used = Beginning Direct Materials Inventory + Purchases + Transportation-In – Net
Returns – Ending Direct Materials Inventory
As was the case with the COGS formula above, this formula simplifies reality because it assumes that all
items of inventory are either used or are in ending inventory. In reality some of the inventory may have been
lost, damaged or otherwise not used, and therefore it is not in ending inventory. However, for the purposes of
the Exams, this formula is sufficient.
Note: Total manufacturing costs is a component of cost of goods manufactured; and cost of goods
manufactured is a component of cost of goods sold. Each one flows into the next one.
Total manufacturing costs consists of direct materials used, direct labor used, and manufacturing
overhead applied.
Direct materials used + Direct labor used + Manufacturing overhead applied = Total manufacturing costs
Cost of goods manufactured consists of total manufacturing costs adjusted for the change in workin-process inventory.
Beginning WIP inventory + Total manufacturing costs – Ending WIP inventory = Cost of goods manufactured.
Cost of goods sold consists of cost of goods manufactured adjusted for the change in finished goods
inventory.
Beginning FG inventory + Cost of goods manufactured – Ending FG inventory = Cost of goods sold.
Question 5: The Profit and Loss Statement of Madengrad Mining Inc. includes the following information for
the current fiscal year.
Sales
Gross profit
Year-end finished goods inventory
Opening finished goods inventory
$160,000
48,000
58,300
60,190
The cost of goods manufactured by Madengrad for the current fiscal year is
a)
$46,110
b)
$49,890
c)
$110,110
d)
$113,890
(ICMA 2010)
12
© 2013 HOCK international, LLC. For personal use only by original purchaser. Resale prohibited.
Section C
Introduction to Cost Accumulation Systems
Introduction to Cost Accumulation Systems
Job order costing (also called job costing), process costing and operation costing are different types of
cost accumulation systems used in manufacturing. Cost accumulation systems are used to assign costs to
products or services.
•
Process costing is used when many identical or similar units of a product or service are being
manufactured, such as on an assembly line. Costs are accumulated by department or by process.
•
Job order costing is used when units of a product or service are distinct and separately identifiable.
Costs are accumulated by job.
•
Operation costing is a hybrid system in which job costing is used for direct materials costs while a
departmental approach is used to allocate conversion costs (direct labor and overhead) to products
or services.
In a process costing system, costs are accumulated according to processing department or area. All of the
units are produced in the same way, using the same resources, usually in an assembly-line fashion. The
accumulated costs for all the units move from process to process. As more work is done on the units, the
total accumulated cost increases with each added process. The cost of one unit of finished goods is an
average: it is the total accumulated manufacturing cost for all the units in the batch divided by the number of
units of output in the batch. This works because each unit produced uses the same quantity of production
resources. Mass-produced consumer goods are accounted for using process costing.
In a job order costing system, costs are accumulated according to assigned job numbers or some other
means of identification. The work is done according to the customer’s specifications, and those are generally
different for each job. Thus, each job uses a different quantity of resources. The actual quantity of resources
used on each specific job is used to calculate the costs to be allocated to that job. Some examples of
applications for job order costing are construction projects, custom-built furniture, automobile repair, and
printing. Job order costing is also used to accumulate the costs of professional services such as attorneys and
CPAs. If average costs were allocated to jobs in the way process costing allocates average costs, the cost of
each job would be distorted.
Operation costing is a hybrid costing system with elements of job costing and elements of process costing.
It is used when conversion activities are similar for several product lines, but the direct materials used in the
various products differ. Direct labor and factory overhead conversion costs are accumulated by process
(called an operation in operation costing) or by department and then are allocated to products. Direct
materials costs are accumulated by jobs or by batches and assigned to the products in each job or batch.
Note: Process costing and job order costing are two ends of a continuum (with operation costing in the
middle). The primary difference between process costing and job order costing is the extent of averaging used in computing unit costs of products or services.
Process costing, job order costing and operation costing will be discussed in more detail later.
© 2013 HOCK international, LLC. For personal use only by original purchaser. Resale prohibited.
13