Urban expansion the effect of economic growth on urbannization in viet nam
Bạn đang xem bản rút gọn của tài liệu. Xem và tải ngay bản đầy đủ của tài liệu tại đây (798.48 KB, 68 trang )
BỘ GIÁO DỤC VÀ ĐÀO TẠO
TRƯỜNG ĐẠI HỌC KINH TẾ Tp.HCM
……………………………..
SOUK SOPHAL
URBAN EXPANSION
THE EFFECT OF ECONOMIC GROWTH ON URBANIZATION IN
VIETNAM
LUẬN VĂN THẠC SĨ KINH TẾ
TP. Hồ Chí Minh-Năm 2013
BỘ GIÁO DỤC VÀ ĐÀO TẠO
TRƯỜNG ĐẠI HỌC KINH TẾ Tp.HCM
……………………………..
SOUK SOPHAL
URBAN EXPANSION
THE EFFECT OF ECONOMIC GROWTH ON URBANIZATION IN
VIETNAM
Chuyên ngành: Kinh tế phát triển
Mã số: 60310105
LUẬN VĂN THẠC SĨ KINH TẾ
NGƯỜI HƯỚNG DẪN KHOA HỌC: Dr. Nguyễn Lưu Bảo Đoan
TP. Hồ Chí Minh-Năm 2013
ACKNOWLEDGEMENTS
Firstly, I would like to take this opportunity to thanks my Advisor Dr. Nguyễn Lưu
Bảo Đoan for his guidance during the process of researching and writing this thesis.
He was supportive of helping me to successfully complete this thesis. It would not
have been possibly written without his help. I am very fortunate to have him as my
master’s thesis supervisor.
I would also like to express my profound thanks to Dr.Pham Khanh Nam for his
help in collecting Vietnam data.
Special thanks to Dr.Nguyen Huu Dung, Deputy Dean at the University of
Economics HoChiMinh City.
I would like to thanks my family and my good friends for always encouraging me to
think and supporting me spiritually throughout my life.
Finally, I would like to dedicate this work to my lost relatives and I hope that this
work makes them proud.
HoChiMinh City, December 15, 2013
SOUK SOPHAL
i
Abstract
Urbanization is a major change taking place globally, especially in Southeast Asia
which is one of the world’s fast growing regions in terms of population and urban
growth. The total population in Southeast Asia accounts for 14.64 per cents of
Asia’s population. Meanwhile, urbanization is also increasingly taking place in
many cities in Southeast Asia. Phnom Penh is the capital of Cambodia with an
estimated population of 2.3 million by 2013, with the area of 678.46 square
kilometers. Recently, the development in the economy has impacts on the growth of
Phnom Penh Capital. The demand for more living spaces has increased so it lead to
unplanned urbanization and industrialization in the outer periphery of Phnom Penh
Capital, which, has created pressure on the change in land use pattern. Therefore, it
is important to study impacts of different factors on urban expansion. However, the
absence of data for Phnom Penh does not make a regression analysis possible. Thus,
the study employs available data of cities and provinces in Vietnam, a country
which has a similar economic structure and level of development. In this paper, the
overall goals are to examine the change in population, GDP, agricultural investment
and other that lead to the urban spatial growth and, the expansion of urbanized
areas. Based on the Monocentric model and panel analysis, the result shows that
population, agricultural investment, industrialization and GDP are major pushing
factors in the processing of urban expansion. The analysis demonstrates the
overwhelming importance of economic growth in the determination of urban land
use. This study examines the effect of economic growth on urbanization in
Vietnam. Based on this information, a case study analysis of Cambodia and Phnom
Penh is also conducted.
Keywords:
economic growth, monocentric model, urban expansion, land use
ii
Table of Contents
ACKNOWLEDGEMENTS ........................................................................................ i
ABSTRACT ............................................................................................................... ii
LIST OF ABBREVIATION
LIST OF TABLES
LIST OF FIGURES
Chapter 1 : Introduction……………………………………………………………..1
1.1
Research problem………………………………………………………..1
1.2
Research Objective………………………………………………………2
1.3
Research Question……………………………………………………….3
1.4
Scope and Methodology of Research……………………………………3
1.5
Research Structure ………………………………………………………3
Chapter 2: Urbanization in Vietnam………………………………………………..5
2.1
The overview of the study area…………………………………………...5
2.2
Urbanization in Vietnam………………………………………………….7
Chapter 3: Literature Review……………………………………………………...12
3.1
Theoretical Literature Review of Monocentric…………………………12
3.2
The Monocentric model………………………………………………...13
3.3
Empirical Study…..…………………………………………………….16
3.4
Analytic Framework……………………………………………………19
Chapter 4: Data and Methodology………………………………………………...21
4.1
Data Source……………………………………………………………..21
4.2
Data Description………………………………………………………..22
4.3
Research Method.....………………………………………………........23
4.4
Analysis Method…………….…………………………………………..24
Chapter 5: Result and Discussion…………………………………………………26
5.1
Descriptive Analysis……………………………………………………26
5.2
Empirical Result….……………………………………………………..33
Chapter 6: A Case Study about Cambodia and Phnom Penh ……………………...37
6.1
Overview of urbanization in Cambodia………………………………...37
6.2
Overview of urbanization in Phnom Penh………………………………40
Chapter 7: Discussion
7.1
Explaination of differences between theory and my analysis…..............46
7.2
Limitations of this analysis……………………………………..............46
Chapter 8: Conclusion………………………………...........................................48
REFERENCES
APPENDIX
LIST OF ABBREVIATION
CBD
Central Business District
FEM
Fixed Effect Model
GDP
Gross Domestic Product
GSO
General Statistics Office
IND
Industrialization
SVS
Service Sector
REM
Random Effect Model
LIST OF TABLES
Table 3.3.1
The proxies and list studies of independent variables………………….17
Table 5.1.1
Descriptive Statistics…………………………………………………...25
Table 5.1.2
Correlation test…………………………………………………………26
Table 5.1.3
Multicolinearity test……………………………………………………27
Table 5.1.4
Normality test………………………………………………………….27
Table 5.2.1
Estimation result……………………………………………………….31
Table 5.2.1.1 Heteroskedasticity test…………………………………………………33
LIST OF FIGURES
Figure 2.1.1
Expansion of city boundaries between 1999 and 2009 .................. …..6
Figure 2.1.2
Urbanization rate 1960-2010…………………………………………8
Figure 3.1
PLUREL concept of peri-urban areas and rural- region……………..12
Figure 3.2
Dimension of regional urban form..…………………………………13
Figure 5.1.5
Graph of changes in urbanized land across the country…………..….28
Figure 5.1.6
Graph of explanation for changes of province &cities..……………...30
Figure 6.1
Phnom Penh map by districts…………………………………………..39
Figures 6.2 Planning of city development………………….……………………….41
CHAPTER 1: INTRODUCTION
1.1
Research problem
One of the most remarkable changes over the centuries is urbanization, or the shift
from rural areas to large cities. Urbanization has had important consequences in many
aspects of social, political, and economic life (Kleniewski & Thomas, 2011)
Kleniewski, N., & Thomas, A. R. (2011) 1. The world remained largely rural until the
industrialization of the nineteenth century. Urbanization is a major change taking place
globally, especially in Southeast Asia. Between the 1870s and World War II, a few
dominant Southeast Asian urban centers such as Yangoon (Myanmar), Malaya
(Singapore), Bangkok (Thailand), Saigon (Vietnam) and Manila (Philippines) were
ports of Western and the gateways that connected the frontier southeast Asia to the
global economy (Gregg Huff, 2012). The study of urbanization is very necessary for
developing countries because these countries are in the process of facing with rapid
urbanization. Urbanization is the process which leads to a higher proportion of total
population of an area living in cities and towns and generally occurs with
modernization and industrialization. Moreover, modernization and industrialization
pull people to cities at the same time that they push people from rural home. And when
more and more people leave villages and farms to live in cities, it is the results of
urban growth. According to experiences of most part of the world, urbanization is part
of the development process. Rapid urbanization is closely linked to economic
development that is contributed with the rising demand of land in manufacturing and
service sector in urban and the decline of agricultural land in rural. Urbanization
occurs as countries shift from rural agricultural activities into urban industrial
activities. Successful urbanization requires the expansion of the industrial and service
sector (Parker, 1996). Similarly, urban expansion mainly depends upon the urban
requirement, facilities available and industrialization. The development of cities plays
a very important role in economic development in developing countries. The major
dynamic driving forces of cities in developing countries are economic and social
1
/>1
forces (population growth and urbanization) that change the urban system. Of course,
the problems are different and unique from one to another urban according to the
urban growth patterns, economic and social characteristics. With high urban
population density and potential for economic growth, there are demands more and
more land to ,support, yet, there is no unlimited amount of land for growth. The
increase of demand for goods and services of all kinds is pushing up the price
especially the price of land. Urban growth is the growth and decline of urban areas
when an economic phenomenon is inextricably linked with the process of
urbanization. Urban growth or city growth is the expansion of towns and cities with
respect to the increase of the size of a built-up area. Cities offer important
opportunities for economic and social development and are they are the focal points
for economic growth, innovation, and employment. Nevertheless, as cities grow,
managing them becomes increasingly complex. As a result, it creates pressure on
infrastructure, reduction in farmland, and damage to natural environment and changes
in diversity use of land in particular area. Particular concerns are the risks to the
immediate and surrounding environment, to natural resources, to health conditions, to
social cohesion, and to individual rights. Since an urban land is very often being
developed at the cost of a lot of arable lands that would raise many people, if there is
no enough arable land to supply enough food, it would threat to human being’s
surviving. It is also known that demography and economy are two driving factors for
urban expansion. Demands for space by humans are the original force for urban
expansion. However, the urban expansion may not happen without economic support.
High economic growth may also promote the demands. Therefore, the link between
urban expansion and economic growth is equivalent and very closely.
1.2
Research Objective
1.2.1 General Objective
To examine the effect of economic growth on urbanization
1.2.2 Specific Objective
(i)
To examine whether or not the GDP growth cause urban expansion and
its magnitude
(ii)
To examine whether or not the population growth causes urban
expansion and its magnitude
2
(iii)
To examine whether or not the agricultural investment causes urban
expansion and its magnitude
(iv)
To examine whether or not the industrialization causes urban expansion
and its magnitude
(v)
To examine whether or not the service sector causes urban expansion
and its magnitude
1.3
Research Question
1.3.1 Research Question
What are the effects of economic growth on urban expansion?
1.3.2 Specific Question
1.4
(i)
Does GDP growth rate have effect on urban expansion?
(ii)
Does population growth have effect on urban expansion?
(iii)
Does agricultural investment have effect on urban expansion?
(iv)
Does industrialization have effect on urban expansion?
(v)
Does service sector have effect on urban expansion?
Scope and Methodology of Research
The thesis will be examine on 63 cities and provinces in Vietnam except some
provinces such as Hoa Binh, Hau Giang and Lai Chau because of missing data, during
2000-2011 period. In order to get the goal of this research that can explore the effect of
economic growth on urbanization (urban expansion), the STATA 12 software will be
apply to analyze the panel dataset. Particularly, the specific econometrics consists of
Fixed Effects Model (FEM) and Random Effect Model (REM) but in my analysis I
only use Fixed Effects Model. Several statistics tests are also taken into account in
order to find the most suitable model that can explain the best effect of economic
growth on urbanization.
1.5
Research Structure
This thesis is organized into eight chapters and reference and appendix as follow.
Chapter 1 (Introduction) draws a general scope of this research. Chapter 2
(Urbanization in Vietnam) covers the urbanization underway and some government
policies on urbanization. Chapter 3 (Literature review) summarizes the theory of
Monocentric model and empirical studies of economic growth and urban expansion in
cities and provinces in Vietnam. Chapter 4 (Data and Research methodology)
3
illustrates the data source, data description, research method, method for analysis and
descriptive analysis. Chapter 5 (Empirical Results) shows the estimated result on this
research study. Chapter 6 (A case study of Cambodia and Phnom Penh urbanization)
shortly reviews urban planning, government policy on housing and some policies on
urbanization. Chapter 7 (Discussion) explains the differences between theory and my
analysis and finally the limitation of this analysis. Chapter 8 (Conclusion) evaluates
the empirical study and recommends some policies.
4
CHATER 2: URBANIZATION IN VIETNAM
2.1
The overview of the study area
Vietnam is a developing country located in the centre of the Southeast Asian region. It
borders the Gulf of Thailand, Gulf of Tonkin, and South China Sea, alongside China,
Laos, and Cambodia. This S-shaped country has a north-to-south distance of
1,650kilometers and about 50 kilometers wide at the narrowest point 2.Vietnam is a
development success story. Political and economic reforms (Doi Moi) launched in
1986 have transformed Vietnam with per capita income below $ 100 to a lower middle
income country within a quarter of a century with per capita income of $1,130 by the
end of 2010. Vietnam has already attained five of its ten original Millennium
Development Goal targets and it is well on the way to attaining two more by 20153.
According to a report of Vietnam, recently, on account of Doi Moi reforms and exportoriented industrialization policies, there is a strong co-movement of urbanization and
economic growth. Vietnam is in the incipient (initial) stage of urbanization and it is
transitioning to an intermediate stage (the second (middle) stage in the process of
successive) with rapid urbanization (currently 30% urban with 3.4% urban population
growth per year) and an increasing economic transition toward industrial
manufacturing as a share of both employment and economic output (World
Bank(2011)*).
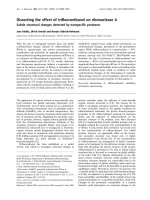
This Figure 2.1.1 below shows the Expansion of city between 1999 and 2009,
In 1999, the most expansion boundary was HoChiMinh city, class 1 city, Da Nang,
class 2 City and Hanoi, class 1city with the land expansion on boundary with 100km
circle radius. And the rest of provinces and cities are in class 2 city, class 3city and 4
city.
2
www.vietnamemb.se/index.php?option=com_content&view=article
&id=68&itemid=62
3
/>5
Chapter 1: Vietnam’s Evolving Urban System (Figure 1.6)
Figure 2.1.1 shows that:
10 years after, HoChiMinh city and Hanoi have become special cities and Da Nang
has become class 1 city. And some of provinces and cities become class 1 city and the
rest become class 2 city and class 3 city and about 15 provinces are in class 4 city. In
Vietnam, there are 63 cities and provinces. And five centrally controlled municipalities
such as Can tho, Da Nang, Hai Phong , 1st- class and HaNoi , HoChiMinh city are
special class. The rest is provincial municipalities.
6
2.2
Urbanization in Vietnam
Vietnam is one of the potential countries in Asia, from 1954 to the present, its
administrative boundary has been changed under the approval from the central
government. As Vietnam enters a crucial period of urbanization corresponding to its
present stage of economic development, the developing system of cities has a strong
emphasis by the government of Vietnam. The history has been viewed as an effective
tool in controlling the city’s size and the encroachment of urban areas onto agricultural
lands. With the progress of urbanization since Doi Moi policies in the late 1980s, the
loss of agricultural land to urban use is increasing conflicts at the urban fringe (It is a
zone along the edges of the built-up area, which comprises a scattered pattern of lower
density settlement areas, urban concentrations around transport hubs, together with
large green open spaces, such as urban woodlands, farmland, golf courses and nature
reserves.) of many cities. Meanwhile, Vietnam’s urbanization was managed by
extensive consultation with various stakeholders, including officials from national and
local government, private sector groups and active international and bilateral
organizations in development assistance in the urban sector in Vietnam (World Bank,
2011*). Vietnam has seen its urban areas developing since 1990, when there were only
500 urban areas with an urbanization rate from 17-18%. The urban areas jumped to
649 in 2000 and 656 in 2003. And the nation will reach an urbanization rate around
38% in 2015 given the national master plan on urban development and there will be
870 urban areas, according to, a report of the Ministry of Construction. Urbanization
play an important role in the development process in Vietnam. According to Mr.
Nguyen Sinh Hung, Deputy Prime Minister, “Vietnam will have one chance to get
urbanization right. If we fail at urbanization, we will fail at industrialization and
modernization.” Even though, urbanization does not guarantee economic growth and
modernization, an integral part of Vietnam’s transition from a low to middle income
country may depend on a well underway of transition- from a large rural to an urban
economy. Therefore, for the first urbanizing nearly all countries achieved high income
and strong economic growth and at least 50% urbanized countries were middle income
countries before urbanization. Vietnam expects to reach that point by 20254.
4
www.worldbank.org/en/news/press-release/2012/04/05/vietnam-needs-to-seize-its-urbanizationopportunities-to-become-a-middle-income-country
7
In this figure 2.2.1, it shows the urbanization rate of 5 counties such as South Korea,
Indonesia, China, India and Vietnam that have potential for economic growth.
Vietnam urbanization process is continuing going up around 30% from 2000 to 2010
and similarly to the urbanization rate of India.
Figure 2.2.1 Urbanization rate 1960-2010
Additionally, rapid urbanization always makes two cases occur. The first is the
potential for increasing congestion costs, regional inequalities, increasing urban
poverty, urban pollution and land and housing prices. And the second is the increasing
traffic congestion, increasingly polluted water ways and high urban land prices. At the
same time, Vietnam must be ready to employ urbanization as an instrument to sustain
economic growth by ensuring the economic competitiveness of key economic regions,
ensuring the social and environmental sustainability of cities making them desirable
places to live and work for all segments of society and increasing economic
productivity through accelerated technological advances and a better trained, educated
and mobile workforce (World Bank Vietnam No. 1, 2012). Therefore, “well managed
urbanization can serve to support Vietnam’s economic growth and its Socio-Economic
Development Strategy objective” said Dean A. Cira, Lead Urban Specialist for World
8
Bank in Vietnam5. Therefore, it is very important to learn the trend of urban expansion
and to estimate the future situation.
5
www.worldbank.org/en/news/press-release/2012/04/05/vietnam
9
CHAPTER 3: LITERATURE REVIEW
3.1.
Theoretical Literature Review of Monocentric city
The traditional models of urban economics view cities around a single point, defined
as “mono”-center, or it is called central business district (CBD). The monocentric city
as conceptualized by Alonso (1964) is the first formal model of urban spatial structure.
It directly showed that cities had a unique centre, often termed the Central Business
District (CBD). Wheaton (1974) had a crucial role in identifying the spatial
dimensions of urban and regional socio-economic activity grounded in urban
economic theory and the fundamental parameters underlying spatial growth of cities
were generalized by a function of population (or population density), household
income, agricultural land rent, and commuting costs. In these traditional models, the
cities are supposed to take place in a point representing the central business district
(CBD), and all workers living in the surrounding area are supposed to commute to the
CBD. McMillen (2006) indicated that the net effect of time costs of commuting and
income on city size was ambiguous, because an increase in income enabled urban
residents who prefer to live farther from the CBD to do so, as well as to increase their
opportunity cost of commuting by selecting residential locations closer to the CBD,
leading to a smaller city size, not a larger one. The monocentric city has been the
model most widely used to analyze the spatial organization of cities (Bertaud 2003).
Based on the hypothesis of monocentric city, it is showed empirically that urban size is
related to the given variables (population, income, agricultural rent and commuting
cost). The concept of the monocentric city involves a central unit, the central business
district (CBD), surrounded by a circular residential area whereby land is allocated
according to its most profitable use. The general idea of the monocentric city is that
most economic activities are based in the urban core, whereas suburbs only fulfill a
residential function. The monocentric city model and its extensive analytical
predictions contributed to our understanding of the spatial expansion of the city over
time, that is, the spatial variation in commuting costs, income, population,
employment, agricultural land rents, and a home’s price. The comparative statics
predictions in the simplicity of urban spatial growth shed light on the dramatic changes
10
in urban structure from the CBD to the polycentric or sprawling development
occurring farther from the CBD. In the mid to latter half of the 20th century,
employment began to disperse, with the proportion of jobs in the centre decreasing
over time and most new growth in employment being located outside of the CBD of
mega cities (Meyer & Gómez-Ibáñez 1981). According to various patterns of spatial
organization and employment layout, urban spatial structure can be divided into
monocentric and polycentric city models (Ingram 1997; Bertaud 2003; Ding 2007).
Many cities evolved from a monocentric spatial structure into a polycentric city model.
Cities developed expansive suburban areas where growth rates of population
sometimes exceeded those of their centre (Romein 2005). Muller (1981) proposed a
concept of the Multi-centred Metropolis, which showed that some suburbs had
transformed into increasingly independent and self sufficient urban entities beyond the
older central city. These urban entities do not only hold a rising share of the population
of metropolises, but also accommodated increase major economic activities,
employment,
and
social,
educational,
cultural
and
entertainment
services.
Additionally, Garreau (1991) put forward an idea of ‘edge cities’, a model of
polycentric spatial structure usually located at major highway interchanges, to describe
new suburban cities with office buildings and huge commercial infrastructures. Anas
and Kim (1996) established a computable general equilibrium model to demonstrate
the emergence of urban sub-centers resulted from multiple equilibriums). Hall (1999)
supposed that the Polycentric City focused on the location of business and envisaged a
new polycentric urban form emerging in many contemporary cities. The Polycentric
City included six main elements: a traditional business core; a secondary business
core; a tertiary business core or inner-city edge city; an outer edge city; outermost edge
cities; and specialized concentrations. In a Monocentric city, since there is a highly
concentrated employment centre and residents generally live in suburb, there would be
high commuting flows on radial routes to the centre because the urban commuting
would have many origins for work trips but a concentrated destination. In reality, a
polycentric city functions in a similar manner as a monocentric city does – people are
attracted by jobs from all over the city. But the commuting patterns are different
(Bertaud 2003). There are two commuting models of polycentric city. One model is
that the city has some sub-centres of employment of a similar scale and in such a kind
11
of polycentric city, each sub-centre generates trips from all over the city. The
characteristics of commuting present a wide dispersion of origins and destinations,
appearing almost random. Another model is that there are also different sub-centres of
employment but one sub-centre is stronger and more concentrated than others. Fujita,
Krugman and Venables (2001) developed a theoretical framework to describe the
evolution of polycentric structure that had resulted from centripetal forces and the
agglomeration of economic relationships between firms. It had become obvious over
the years that the structure of many metropolitan areas diverged from the monocentric
model and that many daily trips expanded in clusters over a wide area outside the
original CBD (Bertaud 2003). These urban entities do not only hold a rising share of
the population of metropolises, but also accommodated increasing major economic
activities, employment, and social, educational, cultural and entertainment services.
Moreover, based on a wide literature review (e.g. Bryant et al. 1982; Champion 1999;
Loibl and Toetzer 2003; Gallent et al. 2006: Leontidou and Couch 2007). Figure 3.1
shows that:
Urban core: It has the Central Business District and the site of many other civil
and cultural functions and some public spaces associated with these.
Inner urban area: generally, in this part the higher density builds development
(built-up areas) including residential, commercial and industrial types of uses
and some public open and green space.
Suburban area: In general, this region has the lower density contiguous built-up
areas, which are attached to inner urban areas, and where houses are typically
not more than 200 m apart, with local shops and services, parks and gardens.
Urban fringe: It is a zone along the edges of the built-up area, which comprises
a scattered pattern of lower density settlement areas, urban concentrations
around transport hubs, together with large green open spaces, such as urban
woodlands, farmland, golf courses and nature reserves.
12
Figure 3.1
PLUREL Concept of peri-urban area and rural-urban-region
Source: (Ravetz Joe, 2013)
In Figure 3.1
Urban periphery: It is a zone surrounding the main built up areas, with a lower
population density, but belonging to the Functional Urban Area, as below: this
can include smaller settlements, industrial areas and other urban land-uses
within a matrix of functional agriculture.
Rural hinterland: It is a rural areas surrounding the peri-urban area, but within
the rural–urban-region and it is accessible within a practical commuting time so
its rural character is affected by residents with urban incomes and lifestyles.
The peri-urban area therefore includes both the urban fringe and urban periphery.
It is a well known axiom in urban economics that cities grow to immense size when
they are successful, and that as they grow, they develop scale economies and benefits
that draw more people. In fact, the polycentric is extension of the mono-centric model.
By adding on peripheral centers, a city can keep on growing outward instead of (or as
well as) upward. This keeps trips and rents at a sufficiently low level, while many of
the “single-large-city” attributes are preserved (Gat, 2005).
In figure 3.2, it shows the difference of monocentric and polycentric city in urban
structure in two case studies: centralized and dispersed.
13
The centralization (higher proportion of population live in center and) and – the
dispersion (the population not live in centers but spread out across the territory in a
non-concentrated pattern) dimension refers to the extent to which population and
employment are centralized in cities or dispersed over smaller non-urban places in the
area in a non-centralized pattern. The monocentricity-polycentricity dimension reflects
the extent to which urban population and employment are concentrated in one city or
spread over multiple cities in the wider metropolitan area (see Figure 3.2).
Figure 3.2
Dimensions of regional urban form
Source:
/>
The polycentric model examines forces within a metropolitan area (metro area) which
is a region consisting of a densely populated urban core and its less-populated
surrounding territories, sharing industry, infrastructure and housing. The polycentric
model is affected land use patterns. However, this study will determine the factors that
affect urbanization at provincial level because of the condition and the system in the
area or the region is different among component urban areas within a province.
Therefore, I will use the monocentric model instead of polycentric model to analyze
those factors.
14
3.2
Monocentric model
One of the most frequently used models in regional and urban economics is the
monocentric model.
The main idea of Monocentric model is the distance to the edge of the central business
district (CBD) (𝑥̃) and utility adjusted until the two following conditions hold
(Xiangzheng Deng, 2006)
(1)
(2)
In the model
x is the distance from the central business district (CBD); and it is equal to the
radius of a circle.
Urban residents commute to the CBD, where they earn income y and incur a
commuting cost (t) per unit distance.
r(𝑥, 𝑦, 𝑡, 𝑢) is Land rental (r). It is in term of distance (x), income (y),
commuting cost (t)and common utility level enjoyed by the residents (u)
q(x,y,t,u) is land consumption per capita (q). It is in term of distance (x),
income (y), commuting cost (t)and common utility level enjoyed by the
residents (u)
Following the two equations in this model, we can observe that:
At equilibrium point the total population fits inside the urban area.
The urban land rental and agricultural land rental are equal at the edge of the
urban.
Based on these relationships, the implications of the model can be seen from the signs
of Wheaton (1974)’s comparative statics. In short, the model implies that:
𝜕𝑥̃
𝜕𝑛
𝜕𝑥̃
𝜕𝑥̃
𝜕𝑥̃
> 0 (1), 𝜕𝑦 > 0 (2), 𝜕𝑡 < 0 (3), 𝜕𝑟 < 0 (4)
𝑎
15
(1) An increase in population clearly must increase the distance of the edge of the
city since more people must be housed then it will increase urban land use and
urban expansion.
(2) An increase in household income will increase urban land use and urban
expansion
(3) An increase in transportation costs will reduce urban land use and limit urban
expansion
(4) An increase in the opportunity cost of non-urban land (agricultural rents) makes
the city more compact. It will reduce urban land use and limit urban expansion.
3.3
Empirical studies
To investigate the urban expansion land, the monocentric urban model is deployed.
The model generates hypotheses illustrating the change of urban land area in some of
the fundamental building blocks of economy such as income, population, agricultural
land values and transportation costs. Studies in US, Brueckner and Fansler (1983) first
estimated the monocentric model with cross-section data of 40 small metropolitan
regions (urban countries) and urbanized areas from 1970. In each metropolitan region,
the urban area was contained within a single, relative small country was measure. In
their study, they found that income, population and agricultural rental were statistically
significant determinants of total urban land area. Each of these had the sign that was
consistent with the prediction of the monocentric model. The coefficients of the
variables measuring transportation costs were not significant.
McGrath (2005) estimated a model with panel data set from 33 large US cities for the
time period 1950-1990. The study used the total urbanized land area in square mile for
33 cities in each sample area. These measures were then converted to a variable that
proxied for urban radius. This study also found that income, population and
agricultural rent were statistically significant determinants of urban expansion in the
U.S with signs that were also consistent with hypotheses. Unlike Brueckner and
Fansler (1983), however, McGrath (2005) found that the coefficient on the
transportation costs variable was also statistically and had the expected (negative )
sign. McGrath (2005) used average annual CPI for private transport action for each
year, rescaled to each region using private transportation cost data for 1990. McGrath
16