Chapter 17. Accelerator Mass Spectrometry in the Study of Vitamins and Mineral Metabolism in Humans
Bạn đang xem bản rút gọn của tài liệu. Xem và tải ngay bản đầy đủ của tài liệu tại đây (355.61 KB, 14 trang )
17
Accelerator Mass Spectrometry
in the Study of Vitamins and
Mineral Metabolism in Humans
Fabiana Fonseca de Moura, Betty Jane Burri,
and Andrew J. Clifford
CONTENTS
Historical Background ....................................................................................................... 545
Description of Accelerator Mass Spectrometry.................................................................. 547
Accelerator Mass Spectrometry Method............................................................................ 548
Considerations for Human Subjects................................................................................... 548
Mathematical Modeling ..................................................................................................... 549
Human Folate Metabolism ................................................................................................ 549
Human Vitamin A and b-Carotene Metabolism................................................................ 551
Calcium .............................................................................................................................. 553
Summary ............................................................................................................................ 553
Acknowledgments .............................................................................................................. 554
References .......................................................................................................................... 554
HISTORICAL BACKGROUND
Accelerator mass spectrometry (AMS) harnesses the power of advanced nuclear instruments
to solve important and heretofore unsolvable problems in human nutrition and metabolism.
AMS methods are based on standard nuclear physics concepts. Isotopes of a given element
differ from one another by the number of neutrons in their nucleus. Generally, the isotope
with the lowest number of neutrons in its nucleus is the natural isotope (e.g., 1 H,12 C). Adding
one neutron typically creates a stable isotope (e.g., 2 H,13 C), which is similar in most properties
to the natural isotope, but differs in mass and can thus be separated and detected by mass
spectrometry. Isotopes with even greater numbers of neutrons (e.g., 3 H,14 C) become unstable.
An unstable nucleus such as 14 C has excess energy, which is released in the form of particles of
radiation. These radioisotopes can also be detected by mass spectrometry, while more
common and familiar instruments such as liquid scintillation and Geiger counters can detect
their radioactive decay products.
The antecedents of AMS date back to the beginning of the nuclear era. In 1903,
Marie Curie and her husband Pierre Curie established quantitative standards for measuring
ß 2006 by Taylor & Francis Group, LLC.
the rate of radioactive emission, and it was Marie Curie who found that there was a
decrease in the rate of radioactive emissions over time (radioactive decay), which could be
calculated and predicted.1 In 1911, Ernest Rutherford bombarded atoms with a-rays and
defined the structure of the atom.2 By 1912, more than 30 radioactive species were known and
current isotope terminology was introduced. The a-particle is a nucleus of the element helium,
b-particles are electrons whereas g-radiation is composed of electromagnetic rays (their
names were intended to be temporary until better identification could be obtained). By
1921, several instruments had been constructed to determine the masses of isotopes
and their relative proportions. These instruments evolved into what we now call mass
spectrometers.
In the 1930s, J.D. Cockroft and E.T.S. Walton were the first to construct a
true accelerator at the Cavendish Laboratory, at Cambridge, UK.3 The Cockroft–
Walton accelerator accelerated protons by driving off electrons from atoms. In this accelerator, hydrogen protons were generated by an electric discharge in hydrogen gas. The
proton ions traveled inside an evacuated tube containing electrodes. Each time the ions
oscillated from one electrode to the other, they accelerated; by the time the ions passed
through the tube they were accelerated into a narrow bundle or beam of particles that
could be separated and measured. This first accelerator generated a little over a million
volts. Shortly thereafter, Robert J. Van de Graaff developed the eponymous generator,
which uses static electricity to generate very high voltages. In this accelerator, a pulley-driven
rubber belt moves at high speed to generate electricity. As the pulley rotates, the inside of
the belt becomes negatively charged and the outside positive. The positive charges are then
collected in an outer metal sphere. The Van de Graaff generators produced as much as
10 million volts.
In 1932, the most famous of all accelerators, the Ernest O. Lawrence cyclotron, was built
at the Radiation Laboratory of the University of California at Berkeley.4 In this accelerator
the particle beams circled, allowing the particles to pass through the same electrodes
many times. Between 1934 and 1939, a large number of radionuclides were produced, identified, and characterized by bombarding elements with every available particle in accelerating
machines.
Cyclotrons could also in principle be used as extremely sensitive mass spectrometers, but
it was not until 1977 that a cyclotron was used in this way for radiocarbon dating.5
The cyclotron increased the sensitivity of radiocarbon dating dramatically because it allowed
direct measurement of the actual mass of radioactive 14 C, instead of the typical methods,
which only count radioactive decays. Mass spectrometry methods had also been suggested
for the measurement of 14 C=12 C ratios for carbon dating, but had difficulties distinguishing between the 14 N and 14 C. To solve that problem, two research groups in 1977 proposed
using a tandem Van de Graaff accelerator instead of a cyclotron for radiocarbon dating.6,7 The
Van de Graaff accelerator can discriminate between 14 N and 14 C and it is also capable of
accelerating and separating all three carbon isotopes (12 C,13 C, and 14 C) simultaneously.8
Nowadays, the Van de Graaff accelerator is the most commonly used accelerator for 14 C
measurements.
In the early 1960s, before the advancement of AMS, there were 14 C measurements
of human blood and tissues from individuals who were exposed to elevated atmospheric
14
C from nuclear weapons testing,9,10 as well as 14 C studies of the metabolism of nutrients
in hospitalized patients.11,12 However, these studies had to use large amounts of 14 C capable of
being detected by a liquid scintillation counter. The possibility of using AMS in biomedical
research has been reported since 197813 and was reenforced in a review published in 1987.14
However, it was not until the early 1990s that AMS began to be used regularly for biomedical and
clinical applications.15–19
ß 2006 by Taylor & Francis Group, LLC.
DESCRIPTION OF ACCELERATOR MASS SPECTROMETRY
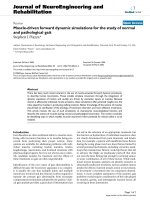
A photo of the accelerator mass spectrometer at Lawrence Livermore National Laboratory
(Livermore, CA, USA) used in our studies is shown in Figure 17.1. An accelerator mass
spectrometer is a form of an isotope ratio spectrometer, ideal for measuring long-lived
radioisotopes because it measures the actual mass rather than the radioactive decay. AMS
separates and measures the individual atoms of isotopic species. AMS is an extremely
sensitive technique, able to detect isotope concentrations to parts per quadrillion and quantify
labeled elements to attomole levels in milligram-sized samples.20
Since AMS measures individual isotopomers, it is millions of times more sensitive than
the more familiar methods of Geiger counting and liquid scintillation counting, which only
measure radioactive decays. However, data from liquid scintillation counting and AMS can
be linearly extrapolated and compared.8,21 Radioisotope methods have inherent superiorities
to stable and natural isotope methods. Specifically, the total radioisotope activity can be
collected and measured, regardless of whether the compounds measured have been identified.
This allows for the collection and measurement of all the metabolites, before they are
identified. Stable isotope methods, in contrast, are difficult to use to identify metabolites,
and in general can only be used to measure metabolites that have already been identified by
other methods. A second advantage is that AMS is more sensitive than almost all stable
isotope methods currently available; by using such small dosages, it allows researchers to
conduct true-tracer studies. This is especially advantageous in nutrient metabolism research,
where the observed behaviors in nutrient metabolism may depend on the size of the administered labeled dose.
The most common use of AMS in nutrition is to measure carbon or hydrogen isotopes,
although calcium and aluminum have also been measured.22–24 In this chapter, we illustrate
the use of AMS for human metabolism research, using folic acid, vitamin A, b-carotene, and
calcium as examples.
FIGURE 17.1 1 MV accelerator mass spectrometer at the Lawrence Livermore National Laboratory
(LLNL). (From http:==bioams.llnl.gov=equipment.php.)
ß 2006 by Taylor & Francis Group, LLC.
ACCELERATOR MASS SPECTROMETRY METHOD
AMS methods require careful sample preparation. Before AMS measurement, the carbon
of biological samples must be converted to graphite. The first method for rapid production
of graphite from biological samples was developed in 1992.25 A description of a high-throughput
method for measuring 14 C is given below.26 In the first step, dried biological samples are placed
in combustion tubes containing cupric oxide and heated to 6508C for 2.5 h. All of the carbon
present in the sample is oxidized to carbon dioxide. In the second step, carbon dioxide is
reduced to graphite in the presence of titanium hydride and zinc powder at 5008C for 3 h then
5508C for 2 h, using cobalt as catalyst.26 The graphitized samples are then loaded into the AMS
instrument and 1 mg (or more) of carbon is added to each sample in the form of 50 mL 33.3
mg=mL of tributyrin in methanol. It is important that the biological material to be analyzed
does not get contaminated with 14 C during sample preparation. To avoid sample cross contamination, disposable materials are used throughout the entire process of graphitization.
Most AMS instruments use cesium as an ion source.20,27 Samples are bombarded with
cesium vapor, which causes the graphitized samples to form negative ions that are extracted
by a series of plates held thousands of volts more positive than the ion source. The negative
ion beam enters an injection magnet where the ions are separated and selected by their massto-charge ratio, so that 12 C,13 C, and 14 C ions pass through separately as a series of pulses in
sequence.28 The pulsed ion beams pass into a tandem electrostatic Van de Graaff particle
accelerator where the negative ions flow toward a positive terminal held at 1 to 5 million volts.
As the ions travel, they attain very high energies, and these high-energy ion beams are focused
to collide with argon gas molecules (on a 0.02 mmol thin carbon foil) in a collision cell. This
collision strips the outer valence electrons from the atoms, so that the charge on the atoms
changes from negative to positive and all molecular species are converted to atoms. These
positive atomic ion beams are now repelled by the positive high terminal voltage used and
exit the accelerator. The beams then pass into a high-energy analyzing magnet where the
12
C, 13 C, and 14 C atoms are separated by their mass moment charge state ratio. 12 C and 13 C
are measured with Faraday cups whereas the less abundant 14 C beam is focused by a
quadropole and electrostatic cylindrical analyzer and counted in a gas ionization detector.
The rare isotope (14 C) count is compared to the abundant (12 C) isotope count to determine the
relative abundance of the 14 C atoms in the original sample.28 Measurements are normalized to
improve precision, by comparing the 14 C=12 C ratio in the sample with the same ratio obtained
from a known standard, graphitized sucrose with an accepted 14 C=12 C ratio of 1.5081 modern
(Australian National University [ANU], Canberra, Australia).26,27 14 C determinations are
made at the Center for Accelerator Mass Spectrometry at Lawrence Livermore Laboratory
(Livermore, CA, USA).
AMS can also be used to detect 3 H tracers in milligram-sized samples.29,30 Sample
preparation for analysis by tritium AMS is a multistep process in which the organic samples
are converted to titanium hydride.29 First, the organic sample is oxidized to carbon dioxide
and water. Then the water is reduced to hydrogen gas, which reacts with titanium to produce
titanium hydride. The ratio of 3 H=1 H is measured by AMS. This technique is currently under
development, but once established it can be a very powerful tool because 3 H is the most widely
and least expensive radioisotope used in biomedical research. In addition, 3 H AMS could
be used with 14 C AMS for double-labeled experiments to study the interaction of two
compounds or the metabolites of a single compound labeled in two separate locations.31,32
CONSIDERATIONS FOR HUMAN SUBJECTS
Several studies conducted in the 1960s used relatively large doses of radioisotopes to study the
metabolism of vitamins in hospitalized subjects. Classic studies of vitamins A, C, E, and other
ß 2006 by Taylor & Francis Group, LLC.
nutrients were all conducted this way.11,12,33,34 The information from these studies formed the
basis of our current understanding of nutrient metabolism and requirement. Those experimental protocols would not meet current Institutional Review Boards’ requirements since the
amount of radiation used ranged from 10 to 194 mCi. AMS, an extremely sensitive technique,
allows the use of radiation dosages that are several 1000 fold lower, on average, a radiation
exposure of 100 nCi,35–39 which corresponds to 11 mSv or 1.1 mrem. This amount of radiation
exposure is equivalent to that received during a 3 h flight in an airplane or from 1 day of
cosmic radiation at sea level. The U.S. Food and Drug Administration defines a safe
radiation dose as <3 rem to the whole body, blood-forming organs, lens of the eye, and
gonads or 5 rem for the remaining organs.40 Additionally, tissues and fluids with a specific
activity >2 nCi=g must be declared as radioactive material. The blood, urine, and fecal
specimens from the low doses of 14 C used in current AMS studies ( 200 nCi) are below the
2 nCi=g cutoff; therefore, the specimens are not considered radioactive material by the U.S.
Federal Regulation.40
MATHEMATICAL MODELING
Our understanding of nutrient metabolism is hindered because metabolism occurs over time,
often in inaccessible tissues. It is very difficult, even impossible, to collect experimental
data for some critical steps in nutrient metabolism in vivo. Kinetic modeling is a systems
analysis approach that constructs a quantitative overview of the dynamic and kinetic behavior of metabolism of a nutrient as it might occur in vivo. A mathematical model is built to
realize as complete a description as possible of the metabolic system under investigation. The
advance of computer hardware and modeling software makes it possible to solve (and
manipulate) differential equations meant to predict kinetic behavior efficiently and accurately. Therefore, mathematical modeling has become an attractive tool for collecting and
processing research data and information needed to understand the dynamics of nutrient
metabolism in vivo. Kinetic models are built to mimic the metabolism of a nutrient as it might
occur in vivo and to estimate values for critical parameters, so that unobserved portions of the
dynamic and kinetic behavior of the nutrient under investigation can be predicted. Specific
information obtained about the nutrient under investigation includes the number of storage
sites (pools) for the nutrient and their sizes, how they are connected, and how their masses
change over time.
Modeling begins with a thorough review existing knowledge of the metabolism of
the nutrient under investigation to formulate an initial structure for the model.
Then initial constants (for transfer of nutrient to recipient compartments from donor compartments) are estimated and adjusted in physiologically relevant ways until the
model structure and rate constants predict best fits for the experimental data. Final
parameter values are generated using iterative nonlinear least squares routines. The following
references describe a series of conferences on mathematical modeling in nutrition and health
sciences.41–47
HUMAN FOLATE METABOLISM
Folate is necessary for purine and pyrimidine synthesis and for the metabolism of homocysteine to methionine. There have been extensive studies of folate metabolism in humans
using pharmacological dosages of radiolabeled folate measured with liquid scintillation
counting.48–52 These studies yield useful information about folate absorption, metabolism,
and excretion. However, all but one were of short duration and thus gave no information
about long-term storage and metabolism of folate.52
ß 2006 by Taylor & Francis Group, LLC.
Diet
1046
Enterohepatic
5351
GI Tract
Marrow
Viscera
PteGlu1
RBC
1429
415
FABP
2.6
Plasma
PteGlu1
Plasma
p-ABA-Glu
55
6
75
Feces
Urine
556
1985
10.1
82
59
97
58
Viscera
PteGlun
PteGlu1 = Pteroylmonoglutamate
PteGlun = Pteroylpolyglutamate
FABP = Folate-binding protein
p -ABA-Glu = p -Aminobenzoylglutamate
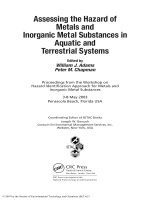
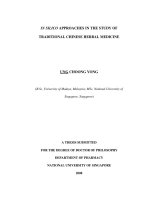
FIGURE 17.2 Kinetic model of folate metabolism. The numbers represent steady-state folate fluxes
(nanomoles per day).
We investigated short- and long-range human folate metabolism with AMS following an
oral dose of 14 C-pteroylmonoglutamate in healthy adults.38 Thirteen free-living adults received 0.5 nmol 14 C-pteroylmonoglutamate (100 nCi) plus 79.5 nmol nonlabeled pterolylmonoglutamate orally in water. The subjects were typical American adults with no known
disease and had a mean dietary folate intake of 1046 nmol=day. 14 C was followed in plasma,
erythrocytes, urine, and feces for 40 days. Kinetic models were used to analyze and interpret
the data. Model parameters were optimized using the SAAM II kinetic analysis software such
that hypotheses that were inconsistent with the datasets observed for each of the 13 subjects
could be rejected. A diagram of the final model is shown in Figure 17.2. Our model consisted
of four pools of folate: gastrointestinal tract (lumen), plasma, erythrocyte, and viscera (all
other tissues).
Apparent absorption of 14 C-pteroylmonoglutamate was 79%. Mean total body folate
was 225 mmol. Pteroylpolyglutamate synthesis, recycling, and catabolism were 1985, 1429,
and 556 nmol=day, respectively. Mean residence times were 0.525 day as visceral pteroylmonoglutamate, 119 days as visceral pteroylpolyglutamate, 0.0086 day as plasma folate, and 0.1
day as gastrointestinal folate.
The kinetic model predicted that only 0.25% of plasma folate was destined for bone
marrow, even though folate metabolism is important for healthy bones. It also predicted an
important role for bile in folate metabolism. Most folate was recycled in tissues through bile.
Visceral pteroylmonoglutamate, which is transported to the gastrointestinal tract via bile,
provided a large pool of extracellular pteroylmonoglutamate (5351 nmol=day) that could
blunt between-meal fluctuations in folate supply to the cells to sustain folate concentrations
during periods of folate deprivation. Therefore, the digestibility of the dietary folate plus
the folate recovered in the bile (1046 þ 5351 nmol=day, respectively) was 92%. We accounted
for the gastric transit time of 1 day to the absorption site. The 6.15 days erythron transit
time was a new observation that fit well with the week-long maturation of hematopoietic
progenitor cells.53
Intact pteroylmonoglutamate that was eliminated in the urine represented ~6%
of ingested folate, a value that compared well with already published values.54–56 However,
the novel and testable hypothesis represented by our model is that fully one-half of
excreted folate was derived from visceral pteroylpolyglutamate and appeared in the urine as
p-aminobenzoylglutamate (and its metabolic successors).
ß 2006 by Taylor & Francis Group, LLC.
The model makes several important predictions. First, the fractional absorption
of folate was high and independent of the gastrointestinal folate load. Second, ~33% of
visceral pteroylmonoglutamate was converted to the polyglutamate form. Third, most of the
body folate was visceral (>99%), and most of the visceral folate was pteroylpolyglutamate
(>98%). Fourth, the model predicted that bile folate was 25 times greater than prior estimates
and that steady-state folate distributions were approximately fivefold larger than prior
estimates.57
In addition, the model predicted two distinct chemical forms of folate in plasma:
pteroylmonoglutamate and p-aminobenzoylglutamate. For visceral pteroylglutamate to be
recycled by conversion to visceral pteroylmonoglutamate was no surprise, but for visceral
pteroylpolyglutamate to also be converted directly to p-aminobenzoylglutamate is a new pathway that fits nicely with other recent discoveries in pteroylpolyglutamate catabolism.58
HUMAN VITAMIN A AND b-CAROTENE METABOLISM
Vitamin A (retinol and its metabolites) plays an important role in vision, growth, cell
division, and differentiation.59 Retinol status has been difficult to assess using nonisotopic
methods, because its serum concentrations are tightly regulated and 90% or more of its body
stores are in inaccessible tissues such as liver and kidney.60–64 Therefore, much of what is
known about the human absorption and metabolism of retinoids is based on one small
radioisotope study.65
Recently we fed deuterated retinyl acetate to adult men and women. Our results show that
a single large peak appears in the blood at ~4 –8 h postdose, reaching its maximum at
12–24 h postdose.66 The vitamin A half-lives ranged from 75 to 241 days for men fed
a vitamin A-deficient diet65 and 56 to 243 days for men and women fed a vitamin A-adequate
diet.36,67,68
The reasons for the large variations in metabolic half-life are unknown, but the main
factors that appear to influence vitamin A metabolism are the individual’s vitamin A nutritional status and dietary intake. People with higher retinol status appear to absorb retinol
more efficiently than people with lower retinol status.36,65,66 Very low intakes of retinol
appear to reduce (rather than increase) retinol utilization, even when retinol stores are still
adequate.65 Other factors, such as, gender, race, and body composition, did not have a strong
influence on vitamin A metabolism in our studies, but might well have an impact in more
heterogeneous groups.66
Although retinoids are key essential nutrients, they are not widely dispersed among
foods. In developing countries, b-carotene, found in yellow-orange fruits and vegetables, is
the major source of vitamin A.69 b-carotene has also been reported to have various
biological effects; among them are enhancement of the immunological system, to
stimulate gap junction communication between cells in vitro, and a possible antioxidant
activity.70–72 We conducted a long-term kinetic study of b-carotene30 using 14 C-b-carotene
derived by growing spinach in an atmospherically sealed chamber pulsed with 14 CO2 .
A healthy 35 year old male received a single oral dose of 14 C-b-carotene (306 mg; 200
nCi) and the tracer was followed for 209 days in plasma, 17 days in urine, and 10 days in
feces. Aliquots of plasma (30 mL), urine (100 mL), and stool (150 mL) samples were
analyzed. Plasma 14 C-b-carotene, 14 C-retinyl esters, 14 C-retinol, and several 14 C-retinoic
acids were separated by reversed phase HPLC.
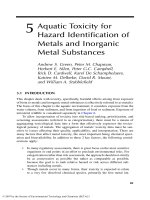
The results showed that 57.4% of the administered dose was recovered in the stool
within 48 h postdose; therefore, 42.6% of b-carotene was bioavailable. Urine was not a
major excrete route for intact b-carotene. There was a 5.5 h delay between dosing and the
ß 2006 by Taylor & Francis Group, LLC.
Fraction of 14C-dose/L plasma analytes
0.030
14
In C-total
14
In C-retinyl esters
14
In C-retinol
14
In C-β-carotene
0.025
0.020
0.015
0.010
0.005
0.000
−0.005
0.01
0.1
1
10
Days postdose, log scale
100
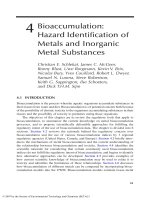
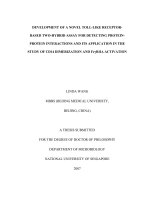
FIGURE 17.3 Patterns of 14 C in plasma following an oral dose of 14 C-b-carotene to a normal adult.
(From Burri, B.J. and Clifford, A.J., Arch. Biochem. Biophys., 430 (1), 110, 2004.) The 14 C in plasma,
which is associated with the labeled retinyl esters, retinol, and b-carotene fractions, accounts for about
one-half of the total radioactivity. The remainder is associated with yet-unidentified carotenoid and
retinoid metabolites, possibly epoxides, apo-carotenals, and retinoic acids.
0.24
0.6
Feces
0.5
0.20
0.4
0.16
Urine
0.3
0.12
0.2
0.08
0.1
0.04
0.0
0.00
−0.1
−0.04
−5
0
5
10
15
20
25
30
35
Cumulative fraction of 14C-dose in urine
Cumulative fraction of 14C-dose in feces
appearance of 14 C in plasma. The losses of 14 C-b-carotene and its metabolites after an oral dose
of 14 C-b-carotene are shown in Figure 17.3. 14 C-b-carotene and 14 C-retinyl esters presented
similar kinetic profiles for the first 24 h. Both 14 C-b-carotene and 14 C-retinyl esters rose to
a plateau spanning between 14 and 21.3 h. The concentration of 14 C-retinol rose linearly for
28 h postdose before declining. Therefore, the substantial disappearance of retinyl esters
from plasma between 21 and 25 h closely preceded the transition from increasing
retinol concentrations. This observation suggests that retinyl ester was handed off to retinol
into circulation. The area under the curve suggested a molar vitamin A value of 0.53 for
b-carotene, with a minimum of 62% of the absorbed b-carotene cleaving to vitamin A. The
pattern of total 14 C,14 C-b-carotene, 14 C-retinyl esters, and 14 C-retinol in plasma is shown in
Figure 17.4.
Days postdose
FIGURE 17.4 Loss of 14 C in feces and urine from oral 14 C-b-carotene in a healthy adult. (From Lemke,
S.L., Dueker, S.R., Follett, J.R., Lin, Y., Carkeet, C., Buchholz, B.A., Vogel, J.S., and Clifford, A.J.,
J. Lipid Res., 44 (8), 1591, 2003.)
ß 2006 by Taylor & Francis Group, LLC.
In addition, the effect of vitamin A nutritional status on b-carotene metabolism was
elucidated.36 Two healthy adult women received an oral dose of 14 C-b-carotene
(0.5–1.0 nmol with specific activity of 98.8 mCi=mmol) in a banana ‘‘milk shake.’’ Seven
weeks after this first dose, both women began taking a vitamin A supplement, 3000 RE
(10,000 IU) retinyl palmitate per day. They consumed the supplement for 21 days and then
received a second dose of 14 C-b-carotene. The women continued taking the 3000 RE supplements for 14 days after the second dose was given, then the amount of vitamin A supplement
was decreased to 1500 RE (5000 IU) per day for the remainder of the study. Concentrations
of 14 C-b-carotene, 14 C-retinyl esters, and 14 C-retinol in plasma were measured for 46 days
after the first dose and 56 days after the second dose.
Using AUCs and irreversible losses of 14 C in feces and urine, a yield of 0.54 mol 14 C-vitamin
A from 1 mol of 14 C-b-carotene before supplementation and 0.74 mol 14 C-vitamin A after
supplementation was calculated. These data indicate that more vitamin A was formed from
b-carotene when subjects were taking vitamin A supplementation. This suggests that retinoid
status can influence carotenoid status and vice versa.
CALCIUM
Calcium is the most abundant divalent cation of the human body and is important
for the maintenance of bone mineral density, blood clotting, nerve conduction, muscle
contraction, enzyme regulation, and membrane permeability.73 Calcium has three radioisotopes, 47 Ca, 45 Ca, and 41 Ca:47 Ca and 45 Ca have relatively short half-lives (4.5 and 165
days, respectively) but 41 Ca is a very long-lived radioisotope (t1=2 $ 116,000 years). Osteoporosis, the decrease in bone mass and density due in part to loss of calcium, is a growing
problem as people age; therefore, long-term studies on bone calcium turnover and bone
resorption are extremely important.74,75 Short-term studies of calcium metabolism can be
done by a variety of stable and radioisotope techniques, using 47 Ca and 45 Ca, but these cannot
resolve long-term small but significant differences in bone resorption. The advent of AMS
has made possible the use of the long-lived radioisotope 41 Ca, which potentially could be
traced for decades.76 In 1990, Elmore et al. assessed the potential for using 41 Ca for bone
resorption study by measuring 41 Ca by AMS in dogs.77 The authors demonstrated that 41 Ca
behaves identically to 45 Ca in vivo. Freeman et al. developed an improved protocol,78 then
administered 5 nCi of 41 Ca dissolved in orange juice to 25 subjects and measured the tracer
in urine by AMS.24 Fink et al. described the protocols for measuring 41 Ca=40 Ca ratios to a
sensitivity of 6 Â 10À16 .79 These studies have clearly demonstrated the feasibility of the AMS
approach. Freeman et al. have also shown that the osteoporosis drug, alendronate, markedly
suppressed bone resorption by effecting 41 Ca loss in urine.24 The use of 41 Ca and AMS to
better understand long-term calcium metabolism in humans, and to trace the impact on
osteoporosis of minute differences in calcium metabolism, occurring over many years, offers
many exciting possibilities.
SUMMARY
AMS is an isotope ratio method ideal for measuring the ratios of long-lived radioisotopes
such as 14 C=12 C for biological and chemical research. It is capable of measuring nutrients and
their metabolites in attomol (10À18 ) concentrations in milligram-sized samples. The detection
sensitivity and small sample size requirements of AMS satisfies both the analytical and ethical
requirements for tracer applications in human subjects.
ß 2006 by Taylor & Francis Group, LLC.
ACKNOWLEDGMENTS
The literature on the AMS method has been published mostly by the researchers at the Center for
Accelerator Mass Spectrometry at Lawrence National Laboratory (LLNL) in the United States,
the Center for Biomedical Accelerator Mass Spectrometry in York, UK, and the Radiocarbon
Laboratory of the GeoBiosphere Center in Lund, Sweden. All of the work reported by our
laboratory was performed in collaboration with the researchers at the Center for AMS at
LLNL. The best current description of the method for preparing AMS samples is given in:
Getachew, G., Kim, S.H., Burri, B.J., Kelly, P.B., Haack, K.W., Ognibene, T.J., Buchholz,
B.A., Vogel, J.S., Modrow, J., and Clifford, A.J. How to convert biological carbon into graphite
for AMS. Radiocarbon, 48, 325–336, 2006.
REFERENCES
1. Glasstone, S., Source Book on Atomic Energy, 3rd ed. D. Van Nostrand Company, Inc., New York,
1967, chap. 2.
2. Faires, R.A. and Parks, B.H., Radioisotope Laboratory Techniques, 1st ed. George Newnes, Ltd.,
London, 1958, chap. 1.
3. Wilson, R.R. and Littauer, R., Accelerators: Machines of Nuclear Physics, 1st ed. Anchor Books,
New York, 1960, chap. 3.
4. Heilbron, J.L. and Seidel, R.W., Lawrence and his Laboratory: A History of the Lawrence Berkley
Laboratory, 1st ed. University of California Press, Berkley and Los Angeles, 1989, chap. 1.
5. Muller, R.A., Radioisotope dating with a cyclotron, Science, 196, 489–494, 1977.
6. Nelson, D.E., Korteling, R.G., and Stott, W.R., Carbon-14: direct detection at natural concentrations, Science, 198, 507–508, 1977.
7. Bennett, C.L. et al., Radiocarbon dating using electrostatic accelerators: negative ions provide the
key, Science, 198, 508–510, 1977.
8. Garner, R.C., Barker, J., Flavell, C., Garner, J.V., Whattam, M., Young, G.C., Cussans, N.,
Jezequel, S., and Leong, D., A validation study comparing accelerator MS and liquid scintillation
counting for analysis of 14C-labelled drugs in plasma, urine and faecal extracts, J. Pharm. Biomed.
Anal., 24 (2), 197–209, 2000.
9. Broecker, W.S., Schulert, A., and Olson, E.A., Bomb carbon-14 in human beings, Science, 130
(3371), 331–332, 1959.
10. Libby, W.F., Berger, R., Mead, J.F., Alexander, G.V., and Ross, J.F., Replacement rates for human
tissue from atmospheric radiocarbon, Science, 146, 1170–1172, 1964.
11. Goodman, D.S., Blomstrand, R., Werner, B., Huang, H.S., and Shiratori, T., The intestinal
absorption and metabolism of vitamin A and beta-carotene in man, J. Clin. Invest., 45 (10),
1615–1623, 1966.
12. Blomstrand, R. and Werner, B., Studies on the intestinal absorption of radioactive beta-carotene
and vitamin A in man. Conversion of beta-carotene into vitamin A, Scand. J. Clin. Lab. Invest., 19
(4), 339–345, 1967.
13. Keilson, J. and Waterhouse, C., First Conference on Radiocarbon Dating with Accelerators. H.E.
Gove University of Rochester, Rochester, 1978.
14. Elmore, D. and Phillips, F.M., Accelerator mass spectrometry for measurement of long-lived
radioisotopes, Science, 236, 543–550, 1987.
15. Turteltaub, K.W., Felton, J.S., Gledhill, B.L., Vogel, J.S., Southon, J.R., Caffee, M.W., Finkel,
R.C., Nelson, D.E., Proctor, I.D., and Davis, J.C., Accelerator mass spectrometry in biomedical
dosimetry: relationship between low-level exposure and covalent binding of heterocyclic amine
carcinogens to DNA, Proc. Natl. Acad. Sci., USA 87 (14), 5288–5292, 1990.
16. Shapiro, S.D., Endicott, S.K., Province, M.A., Pierce, J.A., and Campbell, E.J., Marked longevity
of human lung parenchymal elastic fibers deduced from prevalence of D-aspartate and nuclear
weapons-related radiocarbon, J. Clin. Invest., 87 (5), 1828–1834, 1991.
17. Turteltaub, K.W., Frantz, C.E., Creek, M.R., Vogel, J.S., Shen, N., and Fultz, E., DNA adducts in
model systems and humans, J. Cell Biochem. Suppl., 17F, 138–148, 1993.
ß 2006 by Taylor & Francis Group, LLC.
18. Felton, J.S. and Turteltaub, K.W., Accelerator mass spectrometry for measuring low-dose carcinogen binding to DNA, Environ. Health Perspect., 102 (5), 450–452, 1994.
19. Turteltaub, K.W., Mauthe, R.J., Dingley, K.H., Vogel, J.S., Frantz, C.E., Garner, R.C., and
Shen, N., MeIQx–DNA adduct formation in rodent and human tissues at low doses, Mutat. Res.,
376 (1–2), 243–252, 1997.
20. Vogel, J.S. and Turteltaub, K.W., Accelerator mass spectrometry as a bioanalytical tool for
nutritional research, Adv. Exp. Med. Biol., 445, 397–410, 1998.
21. Vogel, J.S., Turteltaub, K.W., Finkel, R., and Nelson, D.E., Accelerator mass spectrometry–isotope
quantification at attomole sensitivity, Anal. Chem., 67 (11), 353A–359A, 1995.
22. Hotchkis, M., Fink, D., Tuniz, C., and Vogt, S., Accelerator mass spectrometry analyses of environmental radionuclides: sensitivity, precision and standardisation, Appl. Radiat. Isot., 53 (1–2), 31–37, 2000.
23. Priest, N.D., The biological behaviour and bioavailability of aluminium in man, with special
reference to studies employing aluminium-26 as a tracer: review and study update, J. Environ.
Monit., 6 (5), 375–403, 2004.
24. Freeman, S.P.T.H. et al., The study of skeletal calcium metabolism with 41 Ca and 45 Ca, Nucl. Instr.
Meth. Phys. Res. B, 172, 930–933, 2000.
25. Vogel, J.S., Rapid production of graphite without contamination for biomedical AMS, Radiocarbon, 34, 344–350, 1992.
26. Ognibene, T.J., Bench, G., Vogel, J.S., Peaslee, G.F., and Murov, S., A high-throughput method for
the conversion of CO2 obtained from biochemical samples to graphite in septa-sealed vials for
quantification of 14 C via accelerator mass spectrometry, Anal. Chem., 75 (9), 2192–2196, 2003.
27. Barker, J. and Garner, R.C., Biomedical applications of accelerator mass spectrometry–isotope
measurements at the level of the atom, Rapid. Commun. Mass Spectrom., 13 (4), 285–293, 1999.
28. Lappin, G. and Garner, R.C., Current perspectives of 14 C-isotope measurement in biomedical
accelerator mass spectrometry, Anal. Bioanal. Chem., 378 (2), 356–364, 2004.
29. Roberts, M.L., Velsko, C., and Turteltaub, K.W., Tritium AMS for biomedical applications, Nucl.
Instr. Meth. Phys. Res. B, 92, 459–462, 1994.
30. Hamm, R.W. et al., A Compact Tritium Analysis System. John Wiley & Sons, Boston, 2001.
31. Dingley, K.H., Roberts, M.L., Velsko, C.A., and Turteltaub, K.W., Attomole detection of 3 H
in biological samples using accelerator mass spectrometry: application in low-dose, dual-isotope
tracer studies in conjunction with 14 C accelerator mass spectrometry, Chem. Res. Toxicol., 11 (10),
1217–1222, 1998.
32. Ognibene, T.J. and Vogel, J.S., Highly Sensitive 14 C and 3 H Quantification of Biochemical Samples
using Accelerator Mass Spectrometry. John Wiley & Sons, Boston, 2003.
33. MacMahon, M.T. and Neale, G., The absorption of alpha-tocopherol in control subjects and in
patients with intestinal malabsorption, Clin. Sci., 38 (2), 197–210, 1970.
34. Kelleher, J. and Losowsky, M.S., The absorption of alpha-tocopherol in man, Br. J. Nutr., 24 (4),
1033–1047, 1970.
35. Buchholz, B.A., Arjomand, A., Dueker, S.R., Schneider, P.D., Clifford, A.J., and Vogel, J.S.,
Intrinsic erythrocyte labeling and attomole pharmacokinetic tracing of 14C-labeled folic acid with
accelerator mass spectrometry, Anal. Biochem., 269 (2), 348–352, 1999.
36. Dueker, S.R., Lin, Y., Buchholz, B.A., Schneider, P.D., Lame, M.W., Segall, H.J., Vogel, J.S., and
Clifford, A.J., Long-term kinetic study of beta-carotene, using accelerator mass spectrometry in an
adult volunteer, J. Lipid Res., 41 (11), 1790–1800, 2000.
37. Lemke, S.L., Dueker, S.R., Follett, J.R., Lin, Y., Carkeet, C., Buchholz, B.A., Vogel, J.S., and
Clifford, A.J., Absorption and retinol equivalence of beta-carotene in humans is influenced by
dietary vitamin A intake, J. Lipid Res., 44 (8), 1591–1600, 2003.
38. Lin, Y., Dueker, S.R., Follett, J.R., Fadel, J.G., Arjomand, A., Schneider, P.D., Miller, J.W.,
Green, R., Buchholz, B.A., Vogel, J.S., Phair, R.D., and Clifford, A.J., Quantitation of in vivo
human folate metabolism, Am. J. Clin. Nutr., 80 (3), 680–691, 2004.
39. Burri, B.J. and Clifford, A.J., Carotenoid and retinoid metabolism: insights from isotope studies,
Arch. Biochem. Biophys., 430 (1), 110–119, 2004.
40. U.S. Code Fed. Reg., Prescription drugs for human use generally recognized as safe and effective
and not misbranded: drugs used in research. U.S. Code Title 21, chapter 1 (4-1-03 ed.), Part 361,
pp. 300–305.
ß 2006 by Taylor & Francis Group, LLC.
41. Abumrad, N., Mathematical models in experimental nutrition, J. Parenter. Enteral Nutr., 15, 44–98,
1991.
42. Canolty, N. and Cain, T., Mathematical Models in Experimental Nutrition. University of Georgia,
Athens, GA, 1985.
43. Coburn, S. and Townsend, D., Mathematical modeling in experimental nutrition, Adv. Food Nutr.
Res., 40, 1, 1996.
44. Hoover-Plow, J. and Chandra, R., Mathematical modeling in experimental nutrition, Prog. Food
Nutr. Sci., 12, 211, 1988.
45. Siva Subramanian, K. and Wastney, M., Kinetics Model of Trace Element and Mineral Metabolism
during Development. CRC Press, New York, 1955.
46. Clifford, A. and Mueller, H., Mathematical modeling in nutrition research, Adv. Exp. Med. Biol., 445,
1–423, 1998.
47. Novotny, J., Green, M., and Boston, R., Mathematical modeling in nutrition research and the
health sciences, Adv. Exp. Med. Biol., 537, 1–420, 2003.
48. Anderson, B., Belcher, E.H., Chanarin, I., and Mollin, D.L., The urinary and faecal excretion of
radioactivity after oral doses of H3-folic acid, Br. J. Haematol., 6, 439–455, 1960.
49. Baker, S.J., Kumar, S., and Swaminathan, S.P., Excretion of folic acid in bile, Lancet, 10, 685, 1965.
50. Butterworth, C.E., Jr., Baugh, C.M., and Krumdieck, C., A study of folate absorption and
metabolism in man utilizing carbon-14-labeled polyglutamates synthesized by the solid phase
method, J. Clin. Invest., 48 (6), 1131–1142, 1969.
51. Perry, J. and Chanarin, I., Intestinal absorption of reduced folate compounds in man, Br. J.
Haematol., 18 (3), 329–339, 1970.
52. Krumdieck, C.L., Fukushima, K., Fukushima, T., Shiota, T., and Butterworth, C.E., Jr., A long-term
study of the excretion of folate and pterins in a human subject after ingestion of 14 C folic acid, with
observations on the effect of diphenylhydantoin administration, Am. J. Clin. Nutr., 31 (1), 88–93, 1978.
53. Steinberg, S.E., Campbell, C.L., and Hillman, R.S., Kinetics of the normal folate enterohepatic
cycle, J. Clin. Invest., 64 (1), 83–88, 1979.
54. Cooperman, J.M., Pesci-Bourel, A., and Luhby, A.L., Urinary excretion of folic acid activity in
man, Clin. Chem., 16 (5), 375–381, 1970.
55. Sauberlich, H.E., Kretsch, M.J., Skala, J.H., Johnson, H.L., and Taylor, P.C., Folate requirement
and metabolism in nonpregnant women, Am. J. Clin. Nutr., 46 (6), 1016–1028, 1987.
56. Kownacki-Brown, P.A., Wang, C., Bailey, L.B., Toth, J.P., and Gregory, J.F., III, Urinary
excretion of deuterium-labeled folate and the metabolite p-aminobenzoylglutamate in humans,
J. Nutr., 123 (6), 1101–1108, 1993.
57. Institute of Medicine, Dietary reference intakes for Thiamin, Riboflavin, Niacin, Vitamin B6, Folate,
Vitamin B12, Pantothenic acid, Biotin, and Choline. National Academy of Sciences Press, Washington,
DC, 1998.
58. Suh, J.R., Oppenheim, E.W., Girgis, S., and Stover, P.J., Purification and properties of a folatecatabolizing enzyme, J. Biol. Chem., 275 (45), 35646–35655, 2000.
59. Institute of Medicine, Dietary reference intakes for Vitamin A, Vitamin K, Arsenic, Boron, Chromium,
Copper, Iodine, Iron, Manganese, Molybdenum, Nickel, Silicon, Vanadium, and Zinc. National
Academy of Sciences Press, Washington, DC, 2000.
60. Azais-Braesco, V. and Pascal, G., Vitamin A in pregnancy: requirements and safety limits,
Am. J. Clin. Nutr., 71 (5 Suppl), 1325S–1333S, 2000.
61. Berdanier, C.D., Everts, H.B., Hermoyian, C., and Mathews, C.E., Role of vitamin A in mitochondrial gene expression, Diabetes Res. Clin. Pract., 54 (Suppl 2), S11–S27, 2001.
62. Clagett-Dame, M. and DeLuca, H.F., The role of vitamin A in mammalian reproduction and
embryonic development, Annu. Rev. Nutr., 22, 347–381, 2002.
63. Harrison, E.H. and Hussain, M.M., Mechanisms involved in the intestinal digestion and absorption
of dietary vitamin A, J. Nutr., 131 (5), 1405–1408, 2001.
64. Olson, J.A., Serum levels of vitamin A and carotenoids as reflectors of nutritional status, J. Natl.
Cancer Inst., 73 (6), 1439–1444, 1984.
65. Sauberlich, H.E., Hodges, R.E., Wallace, D.L., Kolder, H., Canham, J.E., Hood, J., Raica, N., Jr.,
and Lowry, L.K., Vitamin A metabolism and requirements in the human studied with the use of
labeled retinol, Vitam. Horm., 32, 251–275, 1974.
ß 2006 by Taylor & Francis Group, LLC.
66. Burri, B.J. and Park, J.Y., Compartmental models of vitamin A and beta-carotene metabolism in
women, Adv. Exp. Med. Biol., 445, 225–237, 1998.
67. Novotny, J.A., Dueker, S.R., Zech, L.A., and Clifford, A.J., Compartmental analysis of the
dynamics of beta-carotene metabolism in an adult volunteer, J. Lipid Res., 36 (8), 1825–1838, 1995.
68. Novotny, J.A., Zech, L.A., Furr, H.C., Dueker, S.R., and Clifford, A.J., Mathematical modeling in
nutrition: constructing a physiologic compartmental model of the dynamics of beta-carotene
metabolism, Adv. Food Nutr. Res., 40, 25–54, 1996.
69. Bender, D.A., Nutritional Biochemistry of Vitamins, 2nd ed. Cambridge University Press,
Cambridge, 2003.
70. Santos, M.S., Meydani, S.N., Leka, L., Wu, D., Fotouhi, N., Meydani, M., Hennekens, C.H., and
Gaziano, J.M., Natural killer cell activity in elderly men is enhanced by beta-carotene supplementation, Am. J. Clin. Nutr., 64 (5), 772–777, 1996.
71. Sies, H. and Stahl, W., Carotenoids and intercellular communication via gap junctions, Int. J.
Vitam. Nutr. Res., 67 (5), 364–367, 1997.
72. Mosca, L., Rubenfire, M., Mandel, C., Rock, C., Tarshis, T., Tsai, A., and Pearson, T., Antioxidant
nutrient supplementation reduces the susceptibility of low density lipoprotein to oxidation in
patients with coronary artery disease, J. Am. Coll. Cardiol., 30 (2), 392–399, 1997.
73. Groff, J.L. and Gropper, S.S., Advanced Nutrition and Human Metabolism, 3rd ed. Wadsworth,
Belmont, 2000.
74. Heaney, R.P., Factors influencing the measurement of bioavailability; taking calcium as a model,
J. Nutr., 131, 1344S–1348S, 2001.
75. Heaney, R.P., Long-lasting deficiency diseases: insights from calcium and vitamin D, Am. J. Clin.
Nutr., 78, 912–919, 2003.
76. Weaver, C.M. and Liebman, M., Biomarkers of bone health appropriate for evaluating functional
foods designed to reduce risk of osteoporosis, Br. J. Nutr., 88 (Suppl 2), S225–S232, 2002.
77. Elmore, D. et al., Calcium-41 as a long-term biological tracer for bone resorption, Nucl. Instr. Meth.
Phys. Res. B, 52, 531–535, 1990.
78. Freeman, S.P.H.T. et al., Biological sample preparation and 41 Ca AMS measurement at LLNL,
Nucl. Instr. Meth. Phys. Res. B, 99, 557–561, 1995.
79. Fink, D., Middleton, R., Klein, J., and Sharma, P., 41 Ca: measurement by accelerator mass
spectrometry and applications, Nucl. Instr. Meth. Phys. Res. B, 47, 79–96, 1990.
ß 2006 by Taylor & Francis Group, LLC.
ß 2006 by Taylor & Francis Group, LLC.