Chapter 21 determination of the water soluble vitamins by HPLC
Bạn đang xem bản rút gọn của tài liệu. Xem và tải ngay bản đầy đủ của tài liệu tại đây (818.34 KB, 149 trang )
21
Determination of the Water-Soluble
Vitamins by HPLC
21.1 HPLC Systems
21.1.1
The Column
HPLC columns used for the analysis of water-soluble vitamins are of the
same type as those used in fat-soluble vitamin assays (see Chapter 20,
Section 20.4.3).
21.1.2
Chromatographic Modes
The choice of chromatographic mode for quantitative analysis
depends on the extraction and cleanup procedures employed and the
vitamins required to be measured. Chromatographic modes used in
water-soluble vitamin assays include normal- and reversed-phase
chromatography (see Section 20.4.4), ion exchange chromatography, ion
exclusion chromatography, and reversed-phase ion-pair (ion interaction)
chromatography.
21.1.2.1 Ion Exchange Chromatography
An ion exchange material comprises a porous support bearing fixed ionogenic groups, which, when ionized, function as the ion exchange sites.
Depending on their function, ion exchange materials are either anion
exchangers or cation exchangers, bearing positively charged and negatively charged functional groups, respectively. The positive charges of
anion exchangers result from the protonation of basic groups, while the
negative charges of cation exchangers are produced by the protolysis of
acidic groups (Table 21.1). The functional groups are located mainly
within the extensive pore structure of the matrix. To preserve electrical
neutrality, each fixed ion is paired with an exchangeable counterion of
© 2006 by Taylor & Francis Group, LLC
585
586
Determination of the Water-Soluble Vitamins by HPLC
TABLE 21.1
Characterization of Ion Exchangers
Type
Strong cation exchanger (SCX)
Strong anion exchanger (SAX)
Weak cation exchanger (WCX)
Weak anion exchanger (WAX)
Functional Group
2
Sulfonic acid (SO3 )
Quaternary amine (NR3 þ)
Carboxylic acid (COO2)
Primary amine (NH3 þ)
Usable pH Range
.1
,11
.6
,8
opposite charge. The type of counterion specifies the “form” of the ion
exchanger; for example, a strong anion exchanger is usually supplied in
the chloride form, that is, the counterion is Cl2.
In ion exchange chromatography, the separation of sample ions
depends on the selectivity at the numerous sorption – desorption cycles
that take place as the sample material passes through the column. Ions
having a strong affinity for the functional groups will be retained on the
column, whereas ions that interact only weakly will be easily displaced
by competing ions and eluted early.
Ion exchangers are further classified as strong or weak according to the
ionization properties of the basic or acidic functional groups (Table 21.1).
The degree of ionization depends on the pKa of the functional group and
on the pH of the mobile phase, and is directly proportional to the ion
exchange capacity. The capacity is maximal when all of the functional
groups are ionized. The maximum exchange capacity for strong anion
and cation exchangers is maintained over a wide pH range, whereas for
weak exchangers the usable pH range is limited (Table 21.1).
Most classical ion exchange resins are polystyrene-divinylbenzene
(PS-DVB) copolymers to which the ionogenic functional groups are
attached. Such resins exhibit a relatively slow diffusion of solutes
within the deep pores containing stagnant mobile phase, and this
leads to major band broadening. For this reason, such resins were
often operated at elevated temperatures to speed mass transfer
through a decrease in mobile phase viscosity. One way of minimizing
the diffusion path and improving the efficiency of the separation is to
use pellicular particles, which have a nonporous, impervious solid
core surrounded by a thin coating of active stationary phase. Pellicular
packings have been superseded by totally porous microparticulate
silica-based packings. Silica-based packings are stable at temperatures
up to 808C, but strongly acidic (pH , 2) or mildly basic (pH . 7.5) conditions destroy the silicon structure, leading to a drastic increase in
column resistance and loss of efficiency. This problem has prompted
investigation into new supports for a second generation of microparticulate column packings.
© 2006 by Taylor & Francis Group, LLC
Vitamins in Foods: Analysis, Bioavailability, and Stability
587
The chief mobile phase parameters that control sample retention and
separation selectivity are ionic strength and pH. The role of the buffer
component is to maintain the pH at the selected value and to provide
the desired solvent strength in terms of the appropriate type of counterion at the right concentration. The ionic strength can be regarded as a
measure of the number of counterions present. The sample ions and
mobile phase counterions of the same charge compete for the ion
exchange sites, and hence an increase in ionic strength will proportionately decrease solute retention and vice versa. In other words, the
solvent strength increases with increasing ionic strength, accompanied
by a minimal change in solute selectivity. The ionic strength of the
mobile phase can be increased by either increasing the molarity of the
buffer solution while holding the pH constant, or adding a nonbuffer
salt such as sodium nitrate when it is undesirable to increase the buffer
concentration. The primary effect of pH is to control the ionization of
weak organic acids and bases in the sample. Increasing the pH leads to
an increased ionization of weak acids and decreased ionization of weak
bases, and vice versa for a decrease in pH. An increase in ionization in
each case leads to increased solute retention.
Water-miscible organic solvents such as acetonitrile, 2-propanol, and
ethanol are frequently added as modifiers to the aqueous mobile phase
as a means of lowering the viscosity and improving mass transfer kinetics.
Typical amounts of added solvent range between 3 and 10% by volume.
The effect of the organic modifier on the ion exchange equilibria is relatively minor, and any significant changes that result from such additions
are mainly attributed to hydrophobic mechanisms. In weak anion
exchange chromatography, an appreciable proportion of an organic acid
solute will exist in the nonionized form, and thus behave differently to
the ionized form (anion). The resultant peak tailing caused by the
mixed-mode chromatography can be eliminated by use of an organic
modifier, which also decreases the retention time. In general, using a
modifier can dramatically improve a separation, although the effect is
unpredictable and has to be determined empirically. It is obviously
important to ascertain beforehand that the column packing material is
compatible with the proposed organic solvent.
21.1.2.2 Ion Exclusion Chromatography
In this technique, an ion exchange resin is employed for separating ionic
molecules from nonionic or weakly ionic molecules. Ions having the
same charge as the functional groups of the support (i.e., co-ions) are
repelled by the electrical potential across the exchanger – solution interface (Donnan potential) and excluded from the aqueous phase within
© 2006 by Taylor & Francis Group, LLC
588
Determination of the Water-Soluble Vitamins by HPLC
the pore volume of the resin beads. Nonionic or weakly ionic molecules
are not excluded and, provided they are small enough, may freely diffuse
into the matrix, where they can partition between the aqueous phase
within the resin beads and the aqueous phase between the resin beads.
Therefore, ionized sample solutes pass quickly through the column,
whereas nonionic or weakly ionic solutes pass through more slowly.
The retention mechanisms of the nonionic solutes include polar attraction between the solute and the resin functional groups (i.e., adsorption),
van der Waal’s forces between the solute and the hydrocarbon portion of
the resin (primarily the benzene rings), and size exclusion. The overall
separation is accomplished without any exchange of ions, so the
column does not require regeneration after use.
Ion exclusion chromatography using a strong cation exchange resin has
been successfully applied to the separation of organic acids, including
ascorbic acid. The technique here is to suppress the ionization of the
weak organic acid by adding sulfuric acid to the water mobile phase so
that the highly ionized sulfate ion is excluded and quickly eluted, while
the undissociated organic acid enters the resin pore structure and is
retained. The mobile phase pH should be lower than the pKa of the
organic acid to ensure that the acid is undissociated. The volume of
aqueous phase within the resin bead must be sufficient to allow partition
of the nonionic solutes to take place and, to achieve optimum separation,
must be greater than the sample volume. For this reason, PS-DVB types of
resin, which are capable of swelling, are used in preference to silica-based
exchangers.
21.1.2.3
Reversed-Phase Chromatography
Ionic compounds cannot be analyzed as such by reversed-phase HPLC,
since they elute near the void volumes. Ion suppression is a reversedphase chromatographic technique in which the ionic equilibrium of the
sample is controlled by adjusting the pH of the mobile phase to obtain
retention and separation of the components according to their pKa
values [1]. By buffering of the mobile phase at 1– 2 units below the
pKa value for a weak acid, and a corresponding amount above the pKb
value for a weak base, the ionization is suppressed and the undissociated
compound, having a greater affinity for the stationary phase, is retained.
Thus, weak acids and weak bases can be retained in the pH regions 2– 5
and 7– 8, respectively.
A potential problem with silica-based reversed-phase column packings
is that the siloxane bond linking the alkyl ligand to the silica support is
prone to hydrolysis at low pH, resulting in a progressive loss of bonded
© 2006 by Taylor & Francis Group, LLC
Vitamins in Foods: Analysis, Bioavailability, and Stability
589
phase. Although longer-chain ligands such as C18 are relatively stable at
pH 3 and below, short-chain bonded phases, including small endcapping
groups, are especially susceptible. The problem of loss of column performance due to hydrolysis can be largely overcome by the use of ‘shielded’
stationary phases, which are sterically protected from attack by hydrolyzing protons. One such material is Zorbax SB-C18, which has large, bulky
diisobutyl groups on the silane silicon atom and is nonendcapped. Outstanding long-term ruggedness under highly aggressive low-pH conditions (pH 2) has been demonstrated using Zorbax SB-C18 [2]. Another
approach is to use a totally polymeric column packing such as PLRP-S, a
PS-DVB copolymer. Such materials are not attacked by extremes of pH,
but they exhibit appreciably lower separation efficiencies than reversedphase silica-based packings for small molecules such as vitamins [3].
21.1.2.4 Reversed-Phase Ion-Pair Chromatography
Reversed-phase ion-pair chromatography (also known as ion interaction
chromatography) employs the same types of column packing and water/
organic mobile phases as those used in conventional reversed-phase
HPLC. The pH of the mobile phase is adjusted to encourage ionization
of the ionogenic solutes, and retention is controlled by adding to the
mobile phase an amphiphilic ion-pairing agent bearing an opposite
charge to that of the analyte. The ion-pairing agent should be univalent,
aprotic, and soluble in the mobile phase. It should ideally give a low
UV-absorbing background, although for special applications a reagent
with a strong chromophore can be used to enhance the response of an
absorbance detector. The retention behavior of nonionic solutes is not
affected by the presence of the ion-pairing agent, so both ionized and nonionized solutes may be resolved in the same chromatographic run. Use of
ion-pair chromatography is advantageous for determining water-soluble
vitamins because many polar interferences elute in the dead volume, and
hydrophobic compounds would be in low concentration in the aqueous
extract of the sample.
For the determination of anionic solutes such as ascorbic acid, a variety
of organic amines have been used as ion pairing agents, representing
primary, secondary, tertiary, and quaternary amines. One of the more
popular of these is tetrabutylammonium (Bu4Nþ) phosphate, which is
commercially available as a prepared 5 mM solution in pH 7.5 buffer
(PIC A reagent, Waters Associates). This aprotic quaternary amine interacts with strong and weak acids, and the buffering to pH 7.5 suppresses
weak base ions.
For the determination of cationic solutes such as thiamin (a protonated
amine), a range of alkyl sulfonates having the formula CH3(CH2)nSO3 2
© 2006 by Taylor & Francis Group, LLC
590
Determination of the Water-Soluble Vitamins by HPLC
(n ¼ 4– 7) predominates. Selection of the appropriate reagent is based
on solute retention time, which increases with an increase in the length
of the alkyl chain. Prepared 5 mM solutions of the sodium salts in pH
3.5 buffer are available from Waters Associates; namely, pentane sulfonic
acid (PIC B5), hexane sulfonic acid (PIC B6), heptane sulfonic acid (PIC
B7), and octane sulfonic acid (PIC B8). These reagents interact with
strong and weak bases, and the buffering to pH 3.5 suppresses weak
acid ions.
Most ion-pair chromatographic applications reported for water-soluble
vitamin assays up to the present day have utilized 5- or 10-mm silicabased C18 bonded-phase packings. Monomeric phases yield bettershaped peaks than do polymeric phases, and high carbon loadings
ensure good retention properties [4]. PS-DVB copolymers developed for
HPLC have also been utilized for ion-pair chromatography [5].
The practice of ion-pair chromatography has been discussed by Gloor
and Johnson [6]. Retention and selectivity are optimized mainly by altering the concentration of the ion-pairing agent and the pH of the mobile
phase. Ionic strength is not a variable for controlling retention and it
should be kept as low as possible, commensurate with satisfactory retention characteristics and reproducibility.
Variation of the concentration of ion-pairing agent in the mobile
phase provides a simple means of controlling solvent strength. An
increase in the concentration causes an increase in solute retention but,
beyond a certain limit, a further increase in concentration causes a
decrease in retention. A possible explanation for this reversal effect
is that the increased amount of adsorbed surfactant lowers the interfacial tension between the modified stationary phase and the surrounding aqueous medium to a point at which solute retention is decreased
[7]. This nonionic theory also accounts for the observed decrease in
retention of neutral solutes with increasing concentration of ionpairing agent.
Alterations in the pH of the mobile phase will have a pronounced
effect on separation selectivity for weak acids and weak bases because
of the effect of pH on solute ionization. Maximal retention is obtained
where the solute and ion-pairing agent are completely ionized. The
reagents, being strong acids or salts of strong bases, remain completely
dissociated over a wide pH range, so that the pH can be adjusted to an
optimal value for the separation. Weak acid solutes (pKa . 2) are usually
separated at a pH of 6 –7.4, and weak bases at pH 2 – 5, using a buffer to
hold the pH constant. Buffer salts should have poor ion association
properties, but good solubilities in the mobile phase. An excessive concentration of buffer salt, or the addition of neutral salt to the mobile
phase, results in the surplus ions of such salts competing successfully
with analyte ions for association with the adsorbed ion-pairing agent,
© 2006 by Taylor & Francis Group, LLC
Vitamins in Foods: Analysis, Bioavailability, and Stability
591
thus causing a decrease in retention. Solute pKa values are affected by a
change in temperature, so significant changes in selectivity can occur
with relatively small changes in column temperature. To ensure reproducible separations, it is thus good practice to maintain a constant
column temperature with the aid of a column heating oven. Ionpair chromatography is usually carried out at a few degrees above
ambient, although operation at 50 –608C will improve peak resolution
(with a slight decrease in retention) by reducing the viscosity of the
mobile phase.
Increasing the proportion of organic modifier increases the solvent
strength, resulting in an overall lowering of solute retention. The concentration of organic modifier affects the surface potential (and hence solute
retention) by influencing the sorption of the ion-pairing agent onto the
stationary phase [8].
The general strategy for separating complex mixtures of nonionic and
ionic solutes is firstly to adjust the percentage of organic modifier
(usually methanol) to obtain optimum retention and separation of nonionic solutes. One then adds a suitable ion-pairing reagent in the appropriate buffer to the previously established mobile phase to separate the
ionic compounds isocratically. Gradient elution programs usually
involve a decrease in the concentration of ion-pairing agent with time
as a means of decreasing solute retention.
Ion-pairing agents may irreversibly adsorb onto the stationary phase,
thereby changing the phase chemistry and reducing the apparent pore
volume. Columns used for ion-pair chromatography should therefore
be reserved exclusively for this purpose.
21.1.3
Derivatization
It is sometimes necessary to make a chemical derivative of an analyte
in order to facilitate the use of a more suitable means of detection
and/or a more suitable chromatographic mode. Either pre- or postcolumn derivatization may be employed, depending on whether one
wishes to chromatograph the derivatized analyte or the underivatized
analyte. In precolumn derivatization, the reaction is carried out before
the sample is analyzed by HPLC, so it is the derivatized compounds
that are actually chromatographed. In postcolumn derivatization, the
test solution is injected into the chromatograph, and the separated
compounds in the column effluent are reacted with the derivatizing
agent in a heated reaction coil located between a mixing tee and the
detector [9].
A postcolumn derivatization system requires a second pump to introduce the derivatizing agent but, once set up, the system provides an
© 2006 by Taylor & Francis Group, LLC
Determination of the Water-Soluble Vitamins by HPLC
592
automatic and standardized means of preparing the derivatives. There
will inevitably be some degree of peak broadening due to the increased
distance between the HPLC column and the detector. Another disadvantage is that there is no opportunity to remove or separate excess reagent or
impurities within the reagent that might impair the sensitivity of detection. Precolumn derivatization requires manual manipulations, and
hence more skill and nonstandardized reaction conditions, unless rigorously controlled. Advantages are the opportunity to clean up the reaction
mixture before injection, and the operation of a simpler and more efficient
chromatographic system.
21.2 Applications of HPLC
In this section, applications are arbitrarily divided into single vitamin
analyses and multiple vitamin analyses. The requirement to determine
the naturally occurring vitamin of a foodstuff allows little scope for determining more than one vitamin at a time. This is because of difficulties
of quantitatively extracting the vitamins from their various bound forms,
the need to measure low indigenous concentrations in the presence of a
complex matrix, and the requirement to determine several vitamers of
some vitamins.
21.2.1
Thiamin
21.2.1.1 Detection
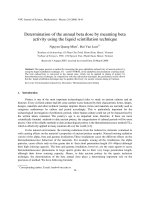
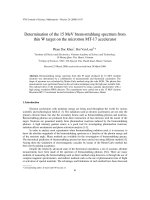
The absorption spectrum of thiamin hydrochloride is pH-dependent, as
shown in Figure 21.1. At pH 2.9 a single maximum at 246 nm occurs;
the 1 value at this wavelength is 11,305. At pH 5.5 two maxima occur at
234 and 264 nm, which correspond to the substituted pyrimidine and
thiazole moieties, respectively.
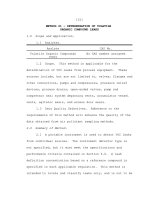
Thiamin itself does not fluoresce, but the vitamin and its phosphate
esters can be reacted with alkaline potassium hexacyanoferrate(III) [potassium ferricyanide, K3Fe(CN)6] to form the corresponding thiochrome
compound (Figure 7.2), which displays a strong blue fluorescence. The
fluorescence excitation and emission spectra of thiochrome possess wavelength maxima at 375 and 432 –435 nm, respectively (Figure 21.2). Equimolar amounts of the thiochrome derivatives of thiamin, TMP, TDP,
and TTP produce different fluorescence intensities [10].
© 2006 by Taylor & Francis Group, LLC
Vitamins in Foods: Analysis, Bioavailability, and Stability
593
A
Absorbance
B
C
200
250
Wavelength (nm)
300
FIGURE 21.1
UV absorption spectra of thiamin hydrochloride in 0.1 M phosphate buffer at pH 2.9 (solid
line) and 5.5 (broken line) (lmax of peak A ¼ 246 nm; B ¼ 234 nm; C ¼ 264 nm).
Fluorescence intensity
A
300
B
em.
ex.
400
500
Wavelength (nm)
FIGURE 21.2
Fluorescence excitation and emission spectra of thiochrome (lmax of peak A ¼ 375 nm;
B ¼ 432–435 nm).
© 2006 by Taylor & Francis Group, LLC
594
21.2.1.2
Determination of the Water-Soluble Vitamins by HPLC
Methodology
HPLC methods used for determining thiamin per se are summarized in
Table 21.2. Methodology has been well discussed in a review by Lynch
and Young [15].
When determining the total thiamin content of a food commodity, the
test material is extracted by autoclaving with dilute mineral acid
(usually 0.1 N hydrochloric acid) followed by enzymatic hydrolysis, in
order to convert protein-bound and phosphorylated forms of the
vitamin to free thiamin. Although thiamin exhibits a rather low molar
absorptivity (1 ¼ 11,305 at lmax 246 nm), absorbance detection has adequate sensitivity for fortified foods [16,17] and also for foods that are
relatively rich in the vitamin, such as legumes and pork muscle [14].
For other food commodities, absorbance detection is inadequate, and it
is necessary to employ the more sensitive fluorescence detection after oxidation of the thiamin to thiochrome by pre- or postcolumn reaction with
alkaline hexacyanoferrate(III).
Precolumn derivatization allows the relatively nonpolar thiochrome to
be determined using conventional reversed-phase chromatography, with
its attendant ease of operation and long-term stability. Some workers
[18 –20] added orthophosphoric acid 45 sec after treatment with alkaline
hexacyanoferrate(III) to minimize formation of thiamin disulfide, a pHdependent side reaction of the thiamin to thiochrome oxidation.
Cleanup of the reaction mixture prior to HPLC has been effected using
C18 solid-phase extraction cartridges [18,19,21]. An alternative approach
is to selectively extract the thiochrome into isobutanol, and then to
inject an aliquot of the organic solution onto an HPLC column of underivatized silica eluted with chloroform/methanol (80:20) [11]. An oncolumn fluorescence detection limit of 0.05 ng thiamin was reported
using this approach [22].
If the derivatization is carried out postcolumn, it is actually thiamin
that is being chromatographed, and this compound in the ionized state
is not retained under simple reversed-phase conditions. However,
reversed-phase columns can be utilized for thiamin assay by means of
ion-pair chromatography using hexane (or heptane) sulfonic acid as
the ion-pairing reagent, either after postcolumn derivatization of
thiamin and fluorescence detection, or without derivatization, using
UV detection. Reversed-phase columns can also be used with ion suppression [23,24].
Postcolumn derivatization is not only more reproducible and convenient than precolumn derivatization, but the alkaline pH of the effluent
is more conducive to the fluorometric detection of thiochrome. This is
because the fluorescence intensity of thiochrome is pH-dependent and
reaches a steady state at pH above 8 [10].
© 2006 by Taylor & Francis Group, LLC
HPLC Methods Used for the Determination of Thiamin in Food
Quantitative HPLC
Food
Sample Preparation
Normal-phase chromatography
Liver,
Acid and enzymatic hydrolysis:
semi-synthetic
digest homogenized sample
animal diet
with 0.1 N HCl at 95–1008C for
1 h. Cool, adjust pH to 4.5.
Incubate with Takadiastase and
papain at 45 –508C for 3 h. Cool,
dilute to volume with 0.1 M
HCl, centrifuge, filter
Derivatization: oxidize thiamin to
thiochrome with alkaline
K3Fe(CN)6, partition into
isobutanol, centrifuge
Reversed-phase chromatography
Cooked sausages
Acid and enzymatic hydrolysis:
autoclave ground sample with
0.1 N HCl at 1208C for 20 min.
Cool, adjust pH to 4.0–4.5.
Incubate with Claradiastase at
508C for 3 h. Precipitate
proteins by heating at 908C
with 50% (w/v) TCA, dilute to
volume with water, filter
Column
Mobile Phase
Compounds
Separated
Detection
Ref.
LiChrosorb Si-60
5 mm
250 Â 4 mm
CHCl3/MeOH,
80:20
Thiochrome
Fluorescence
ex 375 nm
em 430 nm
[11]
Spherisorb C8 (octyl)
5 mm
250 Â 4 mm
Column
temperature 358C
5 mM phosphate
buffer,
pH 7.0/MeCN,
70:30
Thiochrome
Fluorescence
ex 360 nm
em 430 nm
[12]
© 2006 by Taylor & Francis Group, LLC
595
(Table continued )
Vitamins in Foods: Analysis, Bioavailability, and Stability
TABLE 21.2
596
TABLE 21.2 Continued
Quantitative HPLC
Sample Preparation
Column
Mobile Phase
mBondapak C18
10 mm
300 Â 3.9 mm
Column
temperature 508C
Water/MeOH
(80:20) containing
0.15% sodium
hexane sulfonate,
0.75% acetic
acid and 0.1%
EDTA
Compounds
Separated
Detection
Ref.
Derivatization: oxidize thiamin to
thiochrome with alkaline
K3Fe(CN)6
Cleanup and concentration: pass
oxidized extract through a C18
solid-phase extraction
cartridge, wash cartridge with
5 mM phosphate buffer, pH
7.0/MeOH (95:5). Elute thiamin
with 3 ml MeOH, dilute to 5 ml
with MeOH
Reversed-phase ion-pair chromatography
Infant formula,
Stir sample with water.
Precipitate proteins by pH
milk, low-fat
adjustment to 1.7–2.0 and then
yoghurt, eggs,
salad dressing
to 4.0–4.2. Dilute to volume
with water, filter
© 2006 by Taylor & Francis Group, LLC
Thiamin
UV 248 nm
[13]
Determination of the Water-Soluble Vitamins by HPLC
Food
Acid and enzymatic hydrolysis:
autoclave ground sample with
dilute HCl at 1218C for 15 min.
Cool, adjust pH to 4.0–4.5.
Incubate with Takadiastase at
488C for 3 h. Cool, dilute to
volume with water, filter
Cleanup and concentration: readjust
pH of extract to
5.0 –5.5 and keep at 08C. Pass
aliquot of extract through an
Amberlite CG-50 ion exchange
column, wash column bed with
water, elute thiamin with
0.15 M HCl. Evaporate eluate to
dryness, dissolve residue in
water, adjust pH to 5.5 –6.0.
Pass aliquot of solution
through a C18 solid-phase
extraction cartridge, wash
cartridge with aqueous 5 mM
sodium hexane sulfonate, elute
thiamin with methanolic 5 mM
sodium hexane sulfonate
mBondapak C18
10 mm
300 Â 3.9 mm
Column
temperature 308C
(legumes) or 508C
(pork and milk
products)
Water/MeOH
(69:31) containing
5 mM sodium
hexane
sulfonate/5 mM
sodium heptane
sulfonate
(75 þ 25) and
0.5% acetic acid
Thiamin
UV 254 nm
[14]
Vitamins in Foods: Analysis, Bioavailability, and Stability
Legumes, pork
muscle, full
cream milk
powder
Note: K3Fe(CN)6, potassium hexacyanoferrate(III); MeOH, methanol; MeCN, acetonitrile; CHCl3, chloroform; trichloroacetic acid, TCA; EDTA, ethylenediaminetetraacetic acid.
597
© 2006 by Taylor & Francis Group, LLC
Determination of the Water-Soluble Vitamins by HPLC
598
21.2.2
Vitamin B2
21.2.2.1 Detection
Riboflavin in aqueous solution exhibits a UV – visible spectrum containing
four major bands centered around 223, 266, 373, and 445 nm (Figure 21.3).
The positions of the maxima and their absorbance coefficients vary somewhat according to the nature of the solvent. The 373-nm band is the most
affected by solvents, generally shifting to shorter wavelengths with
decreasing solvent polarity. The position of the visible 445-nm band is
not greatly affected. The spectra of riboflavin and FMN are practically
identical to one another under similar conditions, but the spectrum of
FAD is slightly different. All three flavins lose their absorbance in the
visible region when they are reduced to their colorless 1,5-dihydro
forms, known as leuco bases. Molar absorptivity (1) values of flavins
dissolved in 0.1 M phosphate buffer, pH 7.0, are given in Table 21.3.
Riboflavin, FMN, and FAD in aqueous solution exhibit an intense
yellowish-green fluorescence with an emission maximum at around
530 nm when excited at 440 –500 nm. The fluorescence spectra of
B
Absorbance
A
D
C
200
300
400
500
Wavelength (nm)
FIGURE 21.3
UV-visible absorption spectrum of riboflavin dissolved in water (pH 7.4) (lmax of peak
A ¼ 223 nm; B ¼ 266 nm; C ¼ 373 nm; D ¼ 444 nm).
© 2006 by Taylor & Francis Group, LLC
Vitamins in Foods: Analysis, Bioavailability, and Stability
599
TABLE 21.3
The Molar Absorptivity (1) Values of Flavins Dissolved in
0.1 M Phosphate Buffer, pH 7.0
Wavelength (nm)
Flavins
260
375
450
Riboflavin
FMN
FAD
27,700
27,100
37,000
10,600
10,400
9,300
12,200
12,200
11,300
Source: Yagi, K., Chemical determination of flavins, in Methods of
Biochemical Analysis, Glick, D., Ed., Vol. 10, John Wiley & Sons,
New york, 1962, p. 319. With Permission.
riboflavin are shown in Figure 21.4. The fluorescence of flavins is a characteristic of uncharged neutral forms of isoalloxazines; anionic and cationic
forms do not fluoresce. Riboflavin shows a maximum and equal fluorescence in the pH range between 3.5 and 7.5. The same is true for FMN,
but FAD displays maximal intensity at pH 2.7 –3.1. In equimolar neutral
Fluorescence intensity
B
300
C
A
ex.
350
400
em.
450
500
550
600
Wavelength (nm)
FIGURE 21.4
Fluorescence excitation and emission spectra of riboflavin dissolved in water (pH 7.4) (lmax
of peak A ¼ 360 nm; B ¼ 465 nm; C ¼ 521 nm).
© 2006 by Taylor & Francis Group, LLC
600
Determination of the Water-Soluble Vitamins by HPLC
aqueous solutions, riboflavin and FMN exhibit practically the same fluorescence intensity, whereas the intensity of FAD is only about 15% of that of
riboflavin. The fluorescence property of riboflavin depends on the
3-imino group being free. Because protein binding takes place via the
3-imino group, protein-bound forms of the vitamin do not fluoresce. It
is therefore essential to release flavins from proteins if the quantification
is to rely on fluorescence detection.
21.2.2.2
Methodology
HPLC methods for determining riboflavin per se are summarized in
Table 21.4.
A standard extraction technique suitable for HPLC, and applicable to
any kind of foodstuff, is to convert the bound flavins to free riboflavin
by autoclaving the sample with dilute mineral acid, followed by enzymatic digestion at the optimum pH. In some applications, the hydrolyzed
extract is heated with 50% (w/v) trichloroacetic acid to deactivate and
precipitate the previously added enzyme. The total vitamin B2 content
(excluding covalently bound flavins) is then calculated, based on
measurement of the riboflavin peak. The chromatography is capable of
separating FMN and riboflavin, so a valid estimate of the total vitamin
B2 using this technique depends on the conversion of FMN to riboflavin
being complete. If the hydrolysis is incomplete, as indicated by the presence of an FMN peak in the sample chromatogram, an alternative
enzyme preparation and/or a longer incubation period can be tried. If
these steps fail to achieve a complete hydrolysis, the FMN peak must
be measured in addition to the riboflavin peak. Summation of FMN and
riboflavin peak heights provides a total vitamin B2 content without significant error, provided that the FMN peak height is ,25% of the sum
of the FMN and riboflavin peak heights [37]. An unavoidable source of
error is the formation during acid digestion of biologically active isomeric
riboflavin monophosphates, which are chromatographically separated
from FMN.
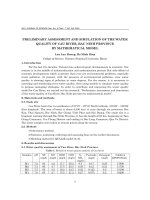
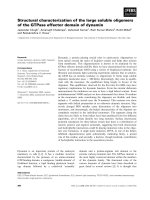
The above extraction technique has been used for the determination of
total vitamin B2 in a wide range of foods, and the results compared with a
standard microbiological assay using Lactobacillus rhamnosus [34]. The
importance of the enzyme treatment in converting FMN to riboflavin is
illustrated in Figure 21.5. High correlations were obtained between the
two assay techniques for vitamin-enriched samples such as baby foods,
gruels, porridges, breakfast cereals, and flour (r ¼ 0.9996) and for milk
products (r ¼ 0.9999). This work was reported from Sweden, where
FMN, rather than riboflavin, is generally used for enrichment. In contrast,
the riboflavin values found with the HPLC method in nonenriched flours
and flours with a high rate of extraction were 25 –50% lower than those
© 2006 by Taylor & Francis Group, LLC
HPLC Methods Used for the Determination of Riboflavin and Other Flavins in Food
Quantitative HPLC
Food
Sample Preparation
Reversed-phase chromatography
Italian cheeses
Homogenize sample with
water/MeOH, 2:1. Add acetic
acid, mix, centrifuge.
Resuspend the pellet three
times in water/MeOH/acetic
acid, 65:25:10. Dilute pooled
supernatants to volume
with the same solvent,
centrifuge
Milk, yoghurt,
cheese
Milk: pass sample through C18
solid-phase extraction
cartridge, wash column bed
twice with water, elute
riboflavin with 20 mM acetate
buffer (pH 4.0)/MeOH, 1 þ 1
Yoghurt and cheese: blend
sample with acetate buffer,
filter, then solid-phase
extraction as for milk
Column
Mobile Phase
Compounds
Separated
Detection
Ref.
LiChrosorb RP-18
5 mm
250 Â 4 mm
Water/MeCN,
80:20
Riboflavin (free)
Visible 446 nm
[26]
Bio-Sil ODS-5S
250 Â 4 mm
Water containing
0.1% acetic acid/
MeOH, 65:35
Riboflavin (free)
UV 270 nm
[27]
Vitamins in Foods: Analysis, Bioavailability, and Stability
TABLE 21.4
(Table continued)
601
© 2006 by Taylor & Francis Group, LLC
Continued
602
TABLE 21.4
Quantitative HPLC
Food
Sample Preparation
Column
Mobile Phase
Compounds
Separated
Acid hydrolysis: autoclave
ground sample with 0.1 N
HCl at 1218C for 30 min, cool,
centrifuge. Resuspend the
pellet twice in 0.1 N HCl.
Dilute pooled supernatants
to volume
mBondapak C18
10 mm
300 Â 3.9
(1) Water/MeOH/
acetic acid,
56:43:1
(2) Water/MeOH/
acetic acid, 50/
49/1
(1) Riboflavin
(2) Lumichrome
Wines, beers,
fruit juices
Filter (0.22 mm), inject directly
or after dilution with water
Hypersil C18 5 mm
200 Â 2.1 mm
Gradient of solvent
(A) 0.05 M
phosphate buffer,
pH 3.0 and
(B) MeCN
FAD, FMN,
riboflavin
Dairy products
(milk, whole
milk powder,
cheese)
Homogenize sample with 6%
formic acid containing 2 M
urea, centrifuge. Mix a 2-ml
aliquot with sorboflavin
(internal standard)
Cleanup and concentration: pass
solution through C18 solidphase extraction column,
wash column bed with 10%
formic acid, elute the flavins
with 10% formic acid/
MeOH, 4:1
LC-18 3 mm
(Supelco)
75 Â 4.6 mm
14% MeCN in 0.1 M
KH2PO4 (final pH
2.9)
FAD, FMN,
sorboflavin
(internal
standard),
riboflavin
© 2006 by Taylor & Francis Group, LLC
Ref.
Fluorescence
(1) ex
450 nm
em 510 nm
(filters)
(2) ex 300–
350 nm
em 479 nm
(filters)
Fluorescence
ex 265 nm
em 525 nm
with a
500 nm
cut-off filter
Fluorescence
ex 450 nm
em 530 nm
[28]
[29]
[30]
Determination of the Water-Soluble Vitamins by HPLC
Pasta (enriched)
Detection
Boil 1.0 g milk to inactivate
pyrophosphatase. Digest
with buffered pronase
(pH 6.8) for 1 h at 458C to
simultaneously release the
flavins bound to milk
proteins and deproteinize.
Cool, adjust volume with
phosphate buffer, adjust pH
to 5.5. Centrifuge, filter
Capcell Pak C18
5 mm
250 Â 4.6 mm
Column
temperature 408C
90% MeOH in water
(Solvent A) and
0.01 M phosphate
buffer, pH 5.5
(Solvent B). Linear
gradient from
35% of A and 65%
of B to 95% of A
and 5% of B over
8 and 5 min
FAD, FMN,
riboflavin
Fluorescence
ex 462 nm
em 520 nm
[31]
Raw and cooked
meats, dairy
products,
eggs, cereal
products
Homogenize sample with
MeOH/CH2Cl2 (9 þ 10) and
7-ethyl- 8-methyl-riboflavin
(internal standard). Add
0.1 M citrate-phosphate
buffer, pH 5.5 containing 0.1%
sodium azide, rehomogenize,
filter
Online system consisting of
microwave extraction,
dialysis and trace enrichment
with a C18 mini-column
2 PLRP-S 5 mm
(Polymer
Laboratories)
columns in series
250 Â 4.6 mm
Column
temperature 408C
MeCN/0.1% sodium
azide in 0.01 M
citrate-phosphate
buffer (pH 5.5) in
multistep gradient
elution program
FAD, FMN,
riboflavin, 7-Et-8Me-RF (internal
standard)
Fluorescence
ex 450 nm
em 522 nm
[32]
Spherisorb ODS-2
5 mm
250 Â 4.6 mm
Initial: 94% of 0.1 M
sodium acetate
buffer (pH 4.8)
and 6% of water/
MeCN/MeOH
(50 þ 40 þ 10)
Linear gradient
elution:
proportion of
water/MeCN/
MeOH mixture
FMN, riboflavin
Fluorescence
ex 450 nm
em 520 nm
(cut-off filter
400 nm)
[33]
Cereals, milk
(whole, semi
skimmed,
skimmed,
evaporated)
© 2006 by Taylor & Francis Group, LLC
603
(Table continued)
Vitamins in Foods: Analysis, Bioavailability, and Stability
Bovine milk
604
TABLE 21.4 Continued
Quantitative HPLC
Food
Sample Preparation
Column
Acid and enzymatic hydrolysis:
autoclave homogenized
sample with 0.1 N HCl at
1218C for 30 min. Cool, adjust
pH to 4.5. Incubate with acid
phosphatase at 458C
overnight. Precipitate
proteins by heating at 1008C
with 50% (w/v) TCA for
5 min. Adjust pH to 4.5, dilute
to volume with water, filter
Hypersil-ODS 5 mm
250 Â 4.6 mm
Dairy products,
meat
products, fish,
fruit,
vegetables,
flour, baked
products,
beer, coffee
Acid and enzymatic hydrolysis:
autoclave homogenized
sample with 0.1 N H2SO4 at
1218C for 20 min. Cool, adjust
pH to 4.5. Incubate with
Claradiastase at 458C
overnight. Cool, dilute to
volume, filter
Cleanup and concentration: pass
aliquot of filtrate through C18
solid-phase
Spherisorb ODS-2
5 mm
250 Â 4.6 mm
© 2006 by Taylor & Francis Group, LLC
increased from
6% to 100% over
30 min
Water/MeOH
(3 þ 2) adjusted
to pH 4.5 with
acetic acid
Water/MeOH, 65:35
Compounds
Separated
Detection
Ref.
Riboflavin
(representing
total vitamin B2)
Fluorescence
ex 440 nm
em 520 nm
[34]
Riboflavin
(representing
total vitamin B2)
Fluorescence
ex 445 nm
em 525 nm
[35]
Determination of the Water-Soluble Vitamins by HPLC
Baby foods,
breakfast
cereals,
enriched
flours, dairy
products,
health foods
Mobile Phase
Milk- and soybased infant
formula, beer,
fruit juices,
juice with
milk, honey,
milk powder
CRM 421
and pig’s
liver CRM
487
Solid samples and CRMs:
homogenize with MeCN,
add 10 mM phosphate buffer
(pH 5), homogenize,
centrifuge, dilute to volume
Liquid samples: filter (0.45 mm
nylon)
Reversed-phase ion-pair chromatography
Flour, bread, raw Acid hydrolysis: defat high-fat
samples with hexane.
beef, corned
Autoclave homogenized
beef, chicken
sample with 0.1 N HCl at
liver, mush1218C for 30 min. Adjust pH
rooms, milk
to 6.0, dilute to volume, filter
and milk
products,
cereals
Fresh fruit and
vegetables
Acid and enzymatic hydrolysis:
digest ground dry sample
with 0.1 N HCl at 998C for
Discovery
RP-AmideC16
(hexadecyl) 5 mm
150 Â 4.6 mm
10 mM phosphate
buffer, pH 5/
MeCN, 90:10
FAD, FMN,
riboflavin
Fluorescence;
two
channels at
wavelengths
of 270/516
and 452/
516 nm
(ex/em)
[36]
LiChrosorb RP-8
(octyl) 10 mm
250 Â 4.0 mm
Water/MeOH, 60:40
containing 5 mM
sodium hexane
sulfonate
FMN, riboflavin
(representing
total vitamin B2)
Fluorescence
ex 440 nm
(filter),
em 565 nm
(filter)
[37]
Ultrasphere-ODS
5 mm
250 Â 4.6 mm
MeOH/water
(40:60) containing
5 mM sodium
Riboflavin
(representing
total vitamin B2)
Fluorescence
ex 450 nm,
em 530 nm
[38]
Vitamins in Foods: Analysis, Bioavailability, and Stability
extraction cartridge, wash
cartridge with water, elute the
riboflavin with 40–70%
MeOH
(Table continued)
605
© 2006 by Taylor & Francis Group, LLC
606
TABLE 21.4 Continued
Quantitative HPLC
Food
Sample Preparation
Column
© 2006 by Taylor & Francis Group, LLC
Detection
Ref.
Spherisorb ODS-2
5 mm
250 Â 4 mm
Column
temperature 358C
5 mM
heptanesulfonic
acid adjusted to
pH 2.7 with
phosphoric acid/
MeCN, 75:25
Riboflavin
(representing
total vitamin B2)
Fluorescence
ex 227 nm
em 520 nm
[39]
mBondapak C18
10 mm
300 Â 3.9 mm
(1) Water/MeOH/
acetic acid
(67:32:1)
containing 5 mM
sodium hexane
sulfonate
Riboflavin
(representing
total vitamin B2)
UV 254 nm
[40]
Determination of the Water-Soluble Vitamins by HPLC
Chick peas,
green beans,
full cream
milk powder
Acid and enzymatic hydrolysis:
autoclave ground sample
with 0.1 N HCl at 1208C for
20 min. Cool, adjust pH to
4.0–4.5; incubate with
Claradiastase at 508C for 3 h.
Precipitate proteins by
heating at 908C with 50%
(w/v) TCA, dilute to volume
with water, filter
Acid and enzymatic hydrolysis:
autoclave ground sample with
dilute HCl at 1218C for 15 min.
Cool, adjust pH to 4.0–4.5.
Incubate with
Compounds
Separated
heptane
sulfonate;
adjusted to pH
4.5 with H3PO4
30 min, cool. Incubate with
buffered Mylase at 388C
overnight. Precipitate
proteins by heating at 608C
with 50% (w/v) TCA for
5 min. Adjust pH to 4.0, dilute
to volume with water, filter
Cooked
sausages
Mobile Phase
Note: TCA, trichloroacetic acid; MeOH, methanol; MeCN, acetonitrile.
(2) Water/MeOH/
acetic acid
(68.5:31:0.5)
containing 5 mM
sodium heptane
sulfonate/5 mM
sodium hexane
sulfonate, 25:75
Vitamins in Foods: Analysis, Bioavailability, and Stability
Takadiastase at 488C for 3 h.
Cool, dilute to volume with
water, filter
Cleanup and concentration:
readjust pH of extract to 4.0 –
4.5. Pass through Florisil
column, wash column bed
with water, elute riboflavin
with triethylamine/MeOH/
water, 7:30:13. Evaporate
eluate to dryness, dissolve
residue in MeOH/water
(same proportion as mobile
phase). Pass aliquot of
solution through C18 solidphase extraction cartridge,
wash cartridge with aqueous
5 mM sodium hexane
sulfonate, elute riboflavin
with methanolic 5 mM
sodium hexane sulfonate
607
© 2006 by Taylor & Francis Group, LLC
Determination of the Water-Soluble Vitamins by HPLC
608
(a)
(b)
1
2
2
0
1
2
3
4
5
Retention time (min)
0
1
2
3
4
5
Retention time (min)
FIGURE 21.5
Reversed-phase HPLC with fluorescence detection of the flavins extracted from a typical
foodstuff by treatment with (a) 0.1 N hydrochloric acid and (b) acid and enzyme.
Operating parameters as in Table 21.4 [34]. Peaks: (1) FMN; (2) riboflavin. (From Johnsson,
H. and Branzell, C., Int. J. Vitam. Nutr. Res., 57, 53, 1987. With permission.)
found with the microbiological assay. A possible reason for this
disparity was the loss of fluorescence by the inner filter effect. This
refers to the absorption of incident or emitted radiation by substances
in the complex food matrix which coeluted with riboflavin. Further purification of the filtered extract using C18 solid-phase extraction failed to
increase the fluorescence signal, and unchanged results were obtained.
Vidal-Valverde and Reche [40] reported that C18 solid-phase extraction
was inadequate for removing all interfering substances present in hydrolyzed food extracts. These authors employed a cleanup procedure involving adsorption chromatography on a Florisil (fuller’s earth) column,
followed by C18 solid-phase extraction, which removed the major interfering substances present in legumes, and made absorbance detection at
254 nm sufficiently sensitive for these products (detection limit: 0.4 ng
per injection).
An alternative technique for determining total vitamin B2 is to measure
the FMN and riboflavin liberated during autoclaving with dilute mineral
acid, after precipitation of proteinaceous material by pH adjustment to
about 4.5 (as in the AOAC fluorometric procedure). The enzymatic
hydrolysis step is omitted. For acid extracts containing significant
© 2006 by Taylor & Francis Group, LLC
Vitamins in Foods: Analysis, Bioavailability, and Stability
609
amounts of FMN, that is, where the FMN peak height is .25% of the
sum of the FMN and riboflavin peak heights (such as were obtained
from raw beef, corned beef, fresh and cooked liver, and canned mushrooms), FMN and riboflavin were calculated separately, using their
corresponding response factors (ratio of concentration of standardto-peak height), and the results were summed to obtain total vitamin
B2. For smaller amounts of FMN, the total vitamin B2 could be obtained
by summation of FMN and riboflavin peak heights without significant
error [37]. The necessity of applying a correction factor to compensate
for the lack of purity of commercial FMN preparations has been stressed
by Russell and Vanderslice [32]. It is important to understand that
the quantity of FMN found does not represent the original FMN
content of the food sample, as the FMN peak originates largely from
hydrolyzed FAD.
For the analysis of milk, eggs, and dairy products, in which free or
loosely bound riboflavin is considered to be the predominant naturally
occurring flavin present, riboflavin can be determined specifically
without the need for acid and enzyme hydrolysis. A common extraction
procedure for milk entails precipitation of the protein to below pH 4.5
(the isoelectric point of most proteins) and filtration. This procedure
has been employed using acetic acid [41,42], trichloroacetic acid
[43,44], and acidified lead acetate solution [45] as the deproteinizing
agent.
Most published riboflavin HPLC assays utilize C18 stationary phases,
either with aqueous/organic mobile phases in the reversed-phase mode
or using ion-pairing agents (hexane or heptane sulfonic acid). Fluorescence monitoring is the preferred means of detection in most cases.
The limits of fluorescence detection at 450/522 nm (excitation/emission)
for the biologically active flavins at a signal-to-noise ratio of 3:1 were
0.55 pmol or 0.21 ng riboflavin; 1.96 pmol or 0.89 ng FMN; 14.9 pmol or
11.15 ng FAD [32]. The sensitivity can be increased even further to
achieve a detection limit of 0.02 ng per injection by irradiating the riboflavin at high pH to form lumiflavin [22], but this technique has not
been widely adopted.
The use of a 254-nm fixed-wavelength absorbance detector provided a
minimum on-column detection limit of 0.4 ng riboflavin [40], which was
adequate for the analysis of legumes and full cream milk powder.
Absorbance monitoring at 270 nm was also sufficiently sensitive for
the analysis of milk and milk products after cleanup and concentration
using C18 solid-phase extraction [27] and has the advantage in simultaneously detecting riboflavin decomposition products [42]. Stancher
and Zonta [26] utilized visible absorbance detection at 446 nm to
avoid detection interference in the analysis of Italian cheeses.
© 2006 by Taylor & Francis Group, LLC