IELTS bar and line graph
Bạn đang xem bản rút gọn của tài liệu. Xem và tải ngay bản đầy đủ của tài liệu tại đây (229.97 KB, 7 trang )
Lesson 4:
IELTS Bar and Line Graph
Take a look at the question and the graph:
You should spend about 20 minutes on this task.
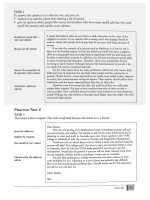
The line graph shows visits to and from the UK from 1979 to 1999, and the bar
graph shows the most popular countries visited by UK residents in 1999.
Summarize the information by selecting and reporting the main features and
make comparisons where relevant.
Write at least 150 words.
These are the steps you need to take to describe a bar and line graph together (or any
two graphs) that may differ slightly from when you describe one graph.
Introduction
When you state what the graph shows, mention both of them. Here is a sample first
sentence of the introduction:
The line graph illustrates the number of visitors in millions from the UK who went
abroad and those that came to the UK between 1979 and 1999, while the bar chart
shows which countries were the most popular for UK residents to visit in 1999.
Remember to write this in your own words and not to copy from the question.
Next you need to mention the key points from the graph. When you do this, mention
the most interesting things from each:
Overall, it can be seen that visits to and from the UK increased, and that France was
the most popular country to go to.
Body Paragraphs
If there are two graphs and a lot of information, you will have to be careful not to
describe everything as you may then have too much information.
Also, the examiner is looking to see that you can select the important things and not
describe every single detail.
So the key skill when you have two graphs is being able to pick out the important
information or summarize things in a concise way, otherwise you will end up writing too
much and probably run out of time.
Here is an example description for the bar and line graph:
To begin, the number of visits abroad by UK residents was higher than for those that
came to the UK, and this remained so throughout the period. The figures started at a
similar amount, around 10 million, but visits abroad increased significantly to over 50
million, whereas the number of overseas residents rose steadily to reach just under 30
million.
By far the most popular countries to visit in 1999 were France at approximately 11
million visitors, followed by Spain at 9 million. The USA, Greece, and Turkey were far
less popular at around 4, 3 and 2 million visitors respectively.
As you can see, the first paragraph discusses the line graph, and the second the bar
chart.
You will not usually need to mix up the descriptions. This will only make things
complicated and difficult to follow. Writing about the first one and then the second one is
ok.
As with any task 1, you will need to make sure you use the right language, make
comparisons, and group data appropriately.
IELTS Pie and Bar Chart
Model Graph
You should spend about 20 minutes on this task.
The pie chart shows the percentage of persons arrested in the five years ending 1994
and the bar chart shows the most recent reasons for arrest.
Summarize the information by selecting and reporting the main features and
make comparisons where relevant.
Write at least 150 words.
IELTS Pie and Bar Chart - Model Answer
The pie chart illustrates the percentage of males and females who were arrested from
1989 to 1994, while the bar chart compares the main reasons that the different genders
were arrested most recently. It is evident from the charts that males were arrested more
than females and that public drinking was the most common reason for arrest for both.
To begin, the proportion of males arrested was much greater than for females. 32%
were arrested compared to only 9% for women. Turning to the reasons for the most
recent arrests, there were some clear differences between men and women. Men were
twice as likely to be arrested for drunk driving than women, at 26% and 14%
respectively. Breach of order, theft, and other reasons were also slightly higher for men,
with all these offences standing in the range of 12-18% for both sexes. Interestingly
though, women experienced a higher percentage of arrest rates for assault and public
drinking. The figures for assault were fairly similar at approximately 18%, whereas
public drinking represented the main reason for arrest, with women at a massive 38%,
compared to 31% for men.
IELTS Pie and Bar Chart
You should spend about 20 minutes on this task.
The pie chart shows the percentage of women in poverty and the bar chart shows
poverty rates by sex and age. They are from the United States in 2008.
Summarize the information by selecting and reporting the main features and
make comparisons where relevant.
Write at least 150 words.
Model Answer
The pie chart ilustrates the proportion of women in poverty by household composition in
the United States in 2008 and the bar graph indicates the differences in rates of poverty
by sex and age. At first glance it can be seen that single women with no dependent
children made up the largest group in poverty and that poverty was highest for women
and children.
The pie chart shows that single women suffered from poverty the most. Single women
without children represented 54% of the total in poverty, and poverty for those with
dependent children stood at just over a quarter. Married women with and without
children accounted for the remaining fifth, or 20%.
Turning to the bar chart, poverty rates were highest amongst children, and the rates
were roughly equal for males and females, at around 21% for under 5s and 15% for 5-
17 year olds. However, from ages 18-24, the gap between men and women widened
significantly, with approximately 14% of men in poverty compared to over 20% for
women. Poverty declined throughout the adult years for both sexes, but a gap remained
and this gap almost doubled in old age.