Grade 4 math arizona 09 (2)
Bạn đang xem bản rút gọn của tài liệu. Xem và tải ngay bản đầy đủ của tài liệu tại đây (645.55 KB, 20 trang )
December 2009
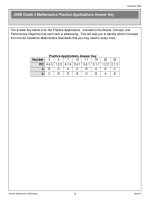
AIMS Grade 4 Mathematics Think-Throughs & Practice Applications
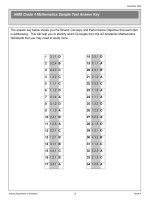
The problems on the next few pages are from the sample test you just finished. They have been
worked out for you to show the thought process behind finding the answers.
As you go through them, see how your thoughts compare to the ones given. Not every problem
from the sample test will be shown in this same way.
The number for each problem matches the same number that is in the sample test. This way, if
you got the problem incorrect, you can compare your answers and go back to see what you may
have done differently.
Then, after each Think-Through problem, you will see two more problems. You can apply what
you just learned from the Think-Through problems. These will be very similar to the ThinkThrough problem. They are also testing the same academic performance objective. This will give
you even more practice to think through your own problem-solving process.
As you read through the solution process of the problems, you may notice that some of the words
are italicized. This means that it is a mathematics term that would be helpful to know.
After the two extra problems, there will be a Summary Statement which explains what the
problems are testing. Your teacher can use this to help you understand what each problem is
testing. It will help you both to understand which concepts you may need more work on or which
concepts you may have mastered.
Arizona Department of Education
13
Grade 4
December 2009
3
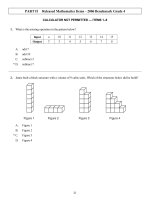
Martha is going to make bracelets to sell for a fundraiser. She bought 8 meters of yarn. She
wants to cut it into pieces that are 16 centimeters long for each bracelet. How many
bracelets can Martha make?
A
2
B
6
C
50
D
128
This problem is asking me to figure out how many bracelets Martha can make. It tells me that she
has 8 meters of yarn. And it tells me that each bracelet uses 16 centimeters of yarn. It looks like I
am working with two different units of measure – meters and centimeters. So, the first thing I have
to do is use the same unit.
Since the problem wants to know how many bracelets can be made, and each bracelet is 16
centimeters, I will convert everything into centimeters.
I know that in 1 meter, there are 100 centimeters. But,
I need to know out how many centimeters are in
8 meters.
1 m = 100 cm
So, if 1 meter is equal to 100 centimeters, then
8 meters must be equal to 800 centimeters. I multiplied
100 by 8.
1 m = 100 cm
Now that I know Martha has 800 centimeters of yarn,
I can figure out how many bracelets she can make.
8 m = 800 cm
The problem says each bracelet is 16 centimeters. She
has 800 centimeters total. So, I have to take 800 and
divide it by 16 to see how many bracelets can be made.
800 divided by 16 is 50. This means that Martha can
make 50 bracelets from the yarn that she has. This is
answer choice C.
Arizona Department of Education
14
x8
x8
50
16 800
– 80
00
– 0
0
Grade 4
December 2009
3a
3b
Donna is buying ribbon to decorate her
shoes. She buys 10 meters of ribbon.
Each shoe needs 10 centimeters of
ribbon. How many pairs of shoes can
she decorate?
Valley View Hospital received a
shipment of flu shots. The total
shipment is 1 liter. Each flu shot is
5 milliliters. How many shots can the
hospital provide?
A
25
A
20
B
50
B
100
C
100
C
200
D
200
D
500
Summary Statement:
These problems include solving problems with conversions within the same measurement system.
Arizona Department of Education
15
Grade 4
December 2009
4
The table below shows the number of baseball cards Tika collected during four months.
What is the best estimate for the number of baseball cards Tika collected in all?
A
between 400 and 500
B
between 500 and 600
C
between 600 and 700
D
between 700 and 800
I have to find out the total number of baseball cards collected. But, the question wants an
estimate. This means I don’t have to add up each exact number that is given.
I will round each number given. That will help me to get an estimate of the total number.
about 150
about 100
about 200
about 200
+
650
Then, I can add up each estimate I made.
I have estimated that Tika has about 650 cards. When I look at the answer choices, I see that I
need to find a range. I estimated that she has 650 baseball cards, which is between 600 and 700.
This is answer choice C.
Arizona Department of Education
16
Grade 4
December 2009
4a
4b
The table below shows the number of
marbles that Matthew collected over
four months.
Matthew’s Marble Collection
Month
Marbles Collected
September
1,509
October
897
November
2,123
December
1,247
What is the best estimate of the total
number of marbles that Matthew
collected in four months?
Janet and her friends are baking
cookies for a school fundraiser. The
recipe they are using states they need
3
to use cups of sugar for every 3
4
dozen cookies they make. If they
make 7 dozen cookies, about how
much sugar will they need to have?
A
approximately 1 cup
B
approximately 2 cups
C
approximately 4 cups
D
approximately 7 cups
A
between 3,000 and 4,000
B
between 4,000 and 5,000
C
between 5,000 and 6,000
D
between 6,000 and 7,000
Summary Statement:
These problems involve making estimates appropriate to a given situation or computation with
whole numbers and fractions.
Arizona Department of Education
17
Grade 4
December 2009
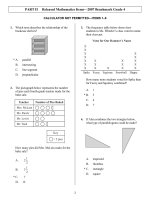
7
Stacey used cutouts of two triangles to make the figures below.
Figure 1
Figure 2
Which statement is true about the figures?
A
Both figures have the same area.
B
Both figures have the same perimeter.
C
Both figures have the same number of sides.
D
Both figures have the same number of vertices.
In this problem, I need to decide which statement from the answer choices is true. So, I will look at
each answer choice and compare them to the figures.
A Both figures have the same area.
This looks like it could be true. The area
for each figure is the number of units
inside the shapes. Since Figure 2
was created from the same triangles as
Figure 1, the area has not changed. So, this
statement is true. To be sure, I will check the other choices.
B Both figures have the same perimeter.
If this were true, the distance around one
figure has to be the same as the distance
around the other figure. When I look at them,
I see this is not true. The perimeter of the
square is less than the perimeter of the triangle. This statement is not true.
C Both figures have the same number of sides.
Figure 1 is a triangle, which has 3 sides. Figure 2 is a square, which has four sides.
1
1
2
3
3
Therefore, this statement is definitely not true.
Arizona Department of Education
2
4
18
(continued on page 19)
Grade 4
December 2009
D
Both figures have the same number of vertices.
I remember the vertices
are the points where the edges come together.
Figure 1 has 3 vertices.
Figure 2 has 4 vertices.
This statement is not true since they have a different number of vertices.
Looking back at all of my thoughts, it turns out I was right and answer choice A is the true
statement. Both figures have the same area.
Arizona Department of Education
19
Grade 4
December 2009
7a
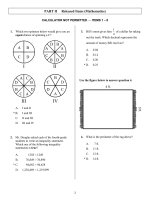
Which figure shows two lines that appear to be parallel?
A
C
B
D
7b
Which figure below appears to have exactly two perpendicular sides?
A
C
B
D
Summary Statement:
These problems involve students drawing and describing the relationships between points, lines,
line segments, rays, and angles, including parallelism and perpendicularity.
Arizona Department of Education
20
Grade 4
December 2009
10
Look at the map below.
Which vertex-edge graph represents this map?
A
C
B
D
I have to figure out which of the vertex-edge graphs matches the map in the problem.
I remember that a vertex-edge graph is a graph that includes edges (or sides) and vertices. The
vertices are the points where the edges meet. I will take the picture in the problem and figure out
how it can be changed into a vertex-edge graph.
First, when I look at the picture, I notice that there are 5 different regions. Each one of
these regions represents a vertex. That means when I
am making this into a vertex-edge graph, each region will
1
2
be represented by a vertex.
5
4
3
So, the vertex edge-graph has 5 vertices.
The next thing I look for is to see which regions share an edge. The number of edges
that a region shares with another region is how I can
figure out where to place the edges on my
3
vertex-edge graph.
1
I count those and I get 8 edges.
2 4
5
8 6
7
(continued on page 22)
Arizona Department of Education
21
Grade 4
December 2009
In the picture, I count 5 regions, which is 5 vertices.
3 2
2 4
5
1
5
8 6
4 7 3
1
I count 8 shared edges in the image.
The last thing that I need to remember is the coloring of the picture. In the map picture, I see that
the center is black. And I see that two regions are gray, and two regions are white.
This is important for me to remember when I am matching the picture to the vertex-edge graph.
The vertex-edge graph that represents the picture has 5 vertices and 8 edges. Also, the
center vertex is black, the top left and bottom right vertices are gray, and the top right and
bottom left vertices are white.
A
B
Answer choice A
has 5 vertices, and
only 4 edges. And
the vertices are the
correct colors.
C
Answer choice B has
5 vertices, and 8
edges and all
vertices are the
correct colors.
D
Answer choice C has 5
vertices, and 8 edges,
but the vertices are the
wrong color.
Answer choice D has 5
vertices, and only 4
edges. And, the
vertices are the wrong
color.
So, when I compare what I counted in the image to the answer choices, I see that the only vertexedge graph that has the same number of vertices and shared edges is answer choice B.
Arizona Department of Education
22
Grade 4
December 2009
10a
Which vertex-edge graph represents the picture below?
A
C
B
D
10b
Which map does the vertex-edge graph represent?
A
C
B
D
Summary Statement:
These problems involve students demonstrating the connection between map coloring and vertex
coloring.
Arizona Department of Education
23
Grade 4
December 2009
17
On Monday, Joel had 17 treats to give his puppy. He gives his puppy 2 or 3 treats each
day. The table below shows the number of treats Joel has left at the end of each day.
Based on the information in the table, which prediction will most likely happen if Joel
continues to give his puppy 2 or 3 treats each day?
A
Joel may only have 1 treat left to give his puppy on Sunday.
B
Joel will not have any treats to give his puppy on Sunday.
C
Joel will have 7 treats to give his puppy on Sunday.
D
Joel may have 4 treats left on Saturday night.
What does this question want me to do? I need to predict which answer choice would be the most
likely to happen. So, I will go through each answer choice and figure them out.
A Joel may only have 1 treat left to give his puppy on Sunday.
In order to know if this could be true, I have to take the information from the table and figure
out how many treats Joel will have every day until Sunday.
On Monday, he gave his puppy 2 treats, because
he started with 17 and ended with 15. 17 – 15 = 2.
On Tuesday, he gave his puppy 3 treats, because
he started with 15 and ended with 12. 15 – 12 = 3.
On Wednesday, he gave his puppy 2 treats,
because he started with 12 and ended with 10.
12 – 10 = 2.
On Thursday, he gave his puppy 3 treats,
because he started with 10 and ended with 7.
10 – 7 = 3.
(continued on page 25)
Arizona Department of Education
24
Grade 4
December 2009
that are not included in the
For the
rest of the days
table, I will predict that Joel gives his puppy 3 treats
each day. I will do this so I know what would be the
least amount of treats he could have left.
On Friday, if he gives his puppy 3 treats, he will
have 4 left because he started with 7. 7 – 3 = 4.
On Saturday, if he gives his puppy 3 treats, he will
have 1 left because he started with 4. 4 – 3 = 1.
Friday
4
Saturday
1
Sunday
0
This means, that if Joel gives his puppy 3 treats each
day until Sunday, he will only have 1 treat left to give
him on Sunday.
So, answer choice A could happen.
B Joel will not have any treats to give his puppy on Sunday.
This statement most likely will not happen. I just figured out that if Joel gives his puppy the
most number of treats per day, then he will have at least 1 left for him on Sunday.
C Joel will have 7 treats to give his puppy on Sunday.
This can’t happen. Joel has 7 on Thursday, so that would mean he would not give him any
on Friday or Saturday. This is wrong because the problem states that he will continue to
give his puppy 2 or 3 treats each day.
D Joel may have 4 treats left on Saturday night.
This also can’t happen. I figured that Joel will have at least 4 left on Friday. So, that would
mean he would not give him any on Saturday. This is wrong because the problem states
that he will continue to give his puppy 2 or 3 treats each day.
After looking over each answer choice and figuring out the treats for the rest of the days, the best
answer is choice A.
Arizona Department of Education
25
Grade 4
December 2009
17a
Jesus is in charge of feeding breakfast to the pigs on his farm. He feeds them 4 pails of
oats every morning. He made a table to keep track of how much oats he has left after
feeding breakfast to the pigs.
Pig Breakfast
Day
Oats Left
Sunday
16
Monday
Tuesday
Wednesday
Thursday
Friday
Saturday
If Jesus has 16 pails of oats left after feeding them breakfast on Sunday, what is the last
day he will most likely have breakfast for the pigs?
17b
A
Wednesday
B
Thursday
C
Friday
D
Saturday
Mr. Robert’s class charted the growth of two plants over a 5-week period for a science
project.
Science Project Plant Growth
Week 1 Week 2 Week 3 Week 4 Week 5
Plant X 1.5 in.
2.3 in.
3.1 in.
3.9 in.
4.7 in.
Plant Y 0.5 in.
1.5 in.
2.5 in.
3.5 in.
4.5 in.
Based on the information in the table, which statement is most likely true?
A
Plant X will be taller than Plant Y in Week 6.
B
Plant Y will be taller than Plant X in Week 6.
C
Plant X and Plant Y will stop growing in Week 6.
D
Plant Y will be the same height as Plant X in Week 6.
Summary Statement:
These problems involve identifying the change in a quantity over time and making simple
predictions.
Arizona Department of Education
26
Grade 4
December 2009
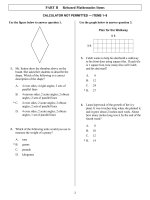
19
Look at the diagram of Laura’s yard.
8 ft
4 ft
4 ft
4 ft
4 ft
8 ft
Which expression can Laura use to find the perimeter of her yard?
A
(4 X 4) + (2 X 8)
B
(4 X 8) + (2 X 8)
C
(4 + 4) + (2 + 8)
D
(4 X 8) + (2 X 4)
This problem is asking me to figure out which expression Laura can use to find the perimeter of
her yard. So, I don’t need to find the perimeter. I only need to figure out which expression could
provide a solution for finding the perimeter. I remember that perimeter is the distance around
something, like if I were to walk around it. It would be how far I walked around it.
I will work this problem as if I were going to solve for the actual perimeter.
To find the perimeter, I need to add together the length of each side of this figure.
8 ft
4 ft
4 ft
4 ft
4 ft
8 ft
Perimeter = 4 + 8 + 4 + 4 + 8 + 4
Uh oh. That is not an answer choice. It looks like I need to go a step further. Each answer choice
has multiplication in it, so I will see how I can make my answer include multiplication.
Perimeter = 4 + 8 + 4 + 4 + 8 + 4
I count that there are four 4s. That can
also be written as 4x4. There are two 8s.
That can be written as 2x8.
four 4s
When I combine them together,
I get (4x4) + (2x8).
My answer is the same as answer choice A.
Arizona Department of Education
two 8s
Perimeter = (4 x 4) + (2 x 8)
27
Grade 4
December 2009
19a
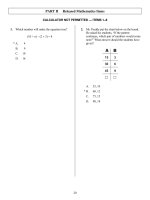
Omar’s math teacher told the class that the first student to score 500 points will be Student
of the Week. Omar made a list of his math test scores.
89, 97, 95, 95, 89, 97, 90
Which expression will not find the total of Omar’s math scores?
19b
A
2 x (89 + 97 + 95 + 90)
B
2 x (89 + 97 + 95) + 90
C
89 + 89 + 90 + 95 + 95 + 97 + 97
D
90 + (2 x 89) + (2 x 95) + (2 x 97)
Which statement is not true?
A
17 + 6 = 6 + 17
B
52 – 12 = 12 – 52
C
21 x 30 = (20 x 30) + (1 x 30)
D
3 x (19 – 4) = (3 x 19) – (3 x 4)
Summary Statement:
In these problems, students need to analyze common algorithms for computing (adding,
subtracting, multiplying, and dividing) with whole numbers using the associative, commutative, and
distributive properties.
Arizona Department of Education
28
Grade 4
December 2009
26
Which expression will not solve 59 X 20?
A
(50 X 20) + (9 X 20)
B
(59 X 10) + (59 X 10)
C
(59 X 10) + (1 X 20)
D
(60 X 20) – (1 X 20)
In this problem, it looks like I have to find different ways to multiply 59 by 20. Because the
question asks me which expression will not solve 59 x 20, I know that three of the choices should
work and one of the choices won’t.
I know that one strategy for multiplication is to break apart the numbers and combine them in
different ways. I could break apart the 59 or I could break apart the 20.
A (50 X 20) + (9 X 20)
I see that I have 50 times 20 and 9 times 20. 59 can be broken apart into 50 and 9. If I
multiply each of the parts (50 and 9) by 20 this is the same as doing 59 times 20.
Choice A will work.
B (59 X 10) + (59 X 10)
For choice B, I see that I have 59 times 10 and 59 times 10. This time the twenty is broken
apart into 10 and 10. If I multiply each of the parts (10 and 10) by 59, this is the same as
doing 20 times 59. Choice B will work.
C (59 X 10) + (1 X 20)
For choice C, I see that I have 59 times 10 and 1 times 20. I do not see that either of my
numbers is broken apart in this number sentence. Let me see if I can check in another
way. I also know that the expression will be 590 + 20 or 610 because the numbers are
easy to calculate. I know that the answer to 59 x 20 is close to 1200 because it is almost 60
times 20. Choice C does not work.
D (60 X 20) – (1 X 20)
For choice D, I see that I have 60 times 20 minus 1 times 20. This one has subtraction
instead of addition. I think this will still work. I can see that 59 can also be written as
60 – 1. If I take these parts (60 and 1) and multiply them both by 20 and subtract, that is
the same as doing 59 times 20. Choice D will work.
I will choose answer choice C, since it is the only one that does not show another way to multiply
59 and 20.
Arizona Department of Education
29
Grade 4
December 2009
26a
26b
Which expression will not solve
72 X 30?
Which expression will not solve
473 X 50?
A
(70 X 30) + (2 X 30)
A
(470 X 50) + (3 X 10)
B
(72 X 15) + (8 X 15)
B
(500 X 50) – (27 X 50)
C
(80 X 30) – (8 X 30)
C
(473 X 25) + (473 X 25)
D
(72 X 15) + (72 X 15)
D
(400 X 50) + (70 X 50) + (3 X 50)
Summary Statement:
In these problems, students should use multiple strategies to multiply whole numbers. This
includes two-digit by two-digit and multi-digit by one-digit.
Arizona Department of Education
30
Grade 4
December 2009
33
Look at the data set.
51, 35, 28, 49, 28, 46, 29
What is the median of the data set?
A
23
B
28
C
35
D
38
This problem wants me to find the median of the numbers. I know this!
I remember that median is the middle number when all of the numbers are placed in order from
least to greatest. I remember that median means middle because I think of the median is the thing
in the middle of a road that separates the two sides of the street! There are other measures I
remember, too. Mode is the number that appears most in a data set. And, range is the difference
of the greatest number and the least number in the data set.
But for this problem, I am using median.
First, I will put the numbers in order.
51, 35, 28, 49, 28, 46, 29
28, 28, 29, 35, 46, 49, 51
Next, I will look for the middle number of the data set.
28, 28, 29, 35, 46, 49, 51
After I do this, I see that the middle number of the data set is 35, which is answer choice C.
This problem had an odd number of data points, so I only had to look for the middle number once
they were all in order. If there were an even number of data points, I would have had to find the
middle two numbers, and then find the average of those two numbers to find the median.
Arizona Department of Education
31
Grade 4
December 2009
33a
33b
Look at the data set.
Look at the data set.
50, 16, 18, 23, 34, 35, 45, 44
84, 98, 88, 76, 86, 99, 84, 89
What is the median of the data set?
What is the mode of the data set?
A
28.5
A
81
B
34
B
84
C
34.5
C
87
D
35
D
88
Summary Statement:
In these problems, students use median, mode, and range to describe the distribution of a given
data set.
Arizona Department of Education
32
Grade 4