THE STUDY OF SCALE FLUCTUATION IN GROSS DOMESTIC PRODUCT(GDP) IN VIETNAM
Bạn đang xem bản rút gọn của tài liệu. Xem và tải ngay bản đầy đủ của tài liệu tại đây (343.32 KB, 26 trang )
THE UNIVERSITY OF DANANG
UNIVERSITY OF ECONOMICS
----------
PHAM QUANG TIN
THE STUDY OF SCALE FLUCTUATION IN GROSS
DOMESTIC PRODUCT(GDP) IN VIETNAM
Major
: Development Economics
Code
: 62.31.01.05
SUMMARY OF DOCTORAL THESIS
Danang - 2016
This work has been completed at University of Economics
The University of Danang
Supervisors:
1.
Professor. PhD. Truong Ba Thanh
2.
Associate Professor. PhD. Vo Thi Thuy Anh
The 1st reviewer : Prof. Dr. Nguyen Van Song
The 2nd reviewer: Dr. Ninh Thi Thu Thuy
The 3rd reviewer : Dr. Phan Van Hoa
This thesis was examined in the presence of the board of thesis
examiners, the University of Danang
Convening in: 41, Le Duan street, Danang City, VietNam
At 8.00 on May 21th, 2016 .
This work has been archived at NATIONAL LIBRARY OF
VIETNAM for possible references
1
PREAMBLE
1. THE NECESSITY OF RESEARCH THEME
Gross domestic product (GDP) is one of the important
indicators to reflect final results in the production process of the
economy. GDP is the basic criteria to assess the growth process and
restructuring of the national economy, to evaluate the effectiveness
of social production in economy and international comparison. GDP
is one of the important bases so that the countries plan on
expenditure, investment, accumulation in the economy, building the
economic development strategy of the country. Therefore, the study
of GDP fluctuation in national GDP is drawn attention by not only
many researchers but also politicians, in particular the head of state
who concern about the GDP volatility to make the decision for
leading the country.
Over 20 years using GDP indicators in Vietnam, in reality
there are some research on theory and application of the theory of
foreign economists have applied the research on the scale of GDP
fluctuations. However, direct study of Vietnam GDP indicators still
limited to Content as well as methods.
Hence, the research topic “The study of scale fluctuation in gross
domestic product (GDP) in Vietnam” is actually necessary in both
theoretical and practical aspects.
2. OBJECTIVES OF THE RESEARCH
The objective of this study is to examine the theoretical
framework and to appy the theoretical models for analyzing the trend
of scale fluctuation in GDP. This study also evaluate the factors
influencing GDP fluctuations in Vietnam. Finally, policy
2
implications are proposed to stimutate GDP growth and restructure
its size.
3. OBJECTS AND SCOPE OF RESEARCH
- Research Objects: The Topic is the research-scale fluctuations
of GDP and factors affecting the size of GDP fluctuations Vietnam.
- The research content of the thesis is limited to the extent:
+ Scale of GDP in this topic is meant to be GDP excluding
price factor, GDP agreed and fixed calculation price in 2010 is aimed
to study the variation in terms of the volume of GDP by years.
+ GDP scale volatility within the subject is understood:
* Absolute GDP volatility through the years and it is measured
by the amount of increased absolute (amount) which changes over
the studied years.
* Relative GDP volatility through the years and it is measured
by % change in GDP (growth of GDP - GDP) over the studied years.
+ For Base “Proposed research model of the factors that
impact the size of GDP Vietnam”,the theme based on the results of
the theoretical overview, experimental studies at home and abroad,
economic development characteristics and the monitored
organization in reports of macro-economic indicators of Vietnam to
synthesize the factors affecting GDP. Within the limited research
theme with a number of factors: capital, labor, inflation, Synthetic
factor productivity (TFP), the openness of the economy, electricity
consumption in the economy, oil price, and the latency factor of
capital, GDP in the past to fluctuations in the size of GDP in
Vietnam.
3
+ Contribution to GDP growth structure, this research topic is
within two criterias of great allocation of Vietnam economy:
economic sectors and economic.
Thesis research space within the entire Vietnam economy, due
to the limit of the data sources the time study is implemented in
1990-2014 period.
4. RESEARCH QUESTIONS
To meet the objectives of the research, this study should
answer these research questions:
1. What model can be used to examine the factors that affect
the scale of Vietnam‟s GDP?
2. What is the trend of Vietnam‟s GDP scale and how to
compare GDP growth rate in Vietnam with other ASEAN countries?
3. How is contribution of the structure according to economic
sectors and economic components to GDP growth Vietnam?
4. How is the level of the contribution of these factors:
capital, labor, openness of the economy, aggregate productivity
(TFP), inflation, and energy to fluctuations in the size of GDP
Vietnam?
5. What does Vietnam need to do to ensure the growth of
GDP?
5. STRUCTRUE OF THE THESIS
Apart from the introduction, conclusion, references, appendix,
the thesis is organized into 4 chapters.
- Chapter 1: Theoretical foundations and Literature review of
the scale fluctuations in Gross domestic products.
- Chapter 2: Research Design.
- Chapter 3: Study of scale fluctuation in Gross domestic
4
product in Vietnam and its findings.
- Chapter 4: Policy implications.
CHAPTER 1
THEORECIAL FOUNDATIONs AND
Literature review of scale fluctuations in
Gross domestic product
1.1. INTRODUCTION OF GROSS DOMESTIC PRODUCT
1.1.1. Concept of Gross domestic product
Presently, although there are many different views about the
indicators of GDP in the study, the author uses the unified concept:
“Gross domestic product (GDP) is the value of final goods in
economy in a certain time period of a year” of GSO Vietnam as my
leading point for scale research GDP in Viet Nam.
1.1.2. The calculation method of Gross domestic product
- Method of production: Reflecting the origins of GDP is
generated from productive activities in the economy.
- Method of production: Reflecting the division of
economic production result for the owners of the factors involved
in the production process creating GDP.
- The last used method: Reflecting how is the GDP used in
the economy.
- The method of calculating Gross domestic product in
Vietnam: Calculated according to production method.
5
1.2. SCALE FLUCTATION IN GROSS DOMESTIC
PRODUCT
1.2.1. The size of gross domestic product
- GDP Scale means that GDP is calculated at constant prices
in order to accurately reflect the amount of goods and services in the
economy at different periods but agreed to use a fixed price of a
period to calculate GDP. In other words, GDP Scal is meant to be
that GDP has been excluded the impact of the price factor in the
process of determining the results of economic production.
- Within the scope of this topic, the author uses fixed prices
in 2010 according to Circular No. 02/2012 / TT-BKH issued by the
Ministry of Planning and Investment of Vietnam : “Regulations 2010
as the base year instead of the base year 1994 to calculate the
statistical indicators at constant ” make unified price to calculate
GDP and related indicators serving the process of implementing this
topic.
1.2.3. Growth theory and economic growth model
1.2.3.1. Overview of economic growth theory
- The theory of economic traditional growth (classical)
XVIII in Europe.
+ Economic growth theory of Adam Smith: source of
economic growth in every country include: Capital accumulation
in the economy, technological advances with social factors and
institutional.
+ Economic growth theory of David Ricardo: factors affecting
the economic growth the country are accumulating capital for
investment.
6
1.2.3.2. The model of economic growth
- The growth model of Keynesian: one of the first people to
use the mathematical model to analyze the impact of the input
element of the production process to the output of the economy.
+ The model of Harrod-Domar: Quantifying the relationship
between economic growth and investment in the economy.
- The neoclassical growth Model (Solow – Swan): Solow –
Swan model explains quantitative terms of economic growth
depending on capital, labor and science and technology progress.
- The Neoclassical extended model (William H. Branson): has
explained the impact of the factors that may determine ownership as
natural resources, land and these factors which can not be determined
ownership as pollution of water and air.
- Endogenous growth model:
+ Kenneth Arrow (1962) with “learning Model” thinks that the
underlying cause of technological progress is the experience factor in
production.
+ Paul Romer (1990) thinks that growth in the developed
countries are led by the research and development seeking new ideas,
new technology.
+ Villanueva (1994) explains the impact of government
policies on growth.
+ Gregory Mankiw, David Romer and David Weil (1992):
explains the mechanism of action of human capital to economic
growth.
- Fischer (1993): When inflation is low which means the
dimensional relationship with economic growth, but, when inflation
is high it will negatively related to economic growth”. Barro (1996)
7
and Romer - Christina (1996) has launched the threshold of
economic inflation is 8% / year.
1.2.4. Contribution of economic sectors and economic
components to the scale of gross domesic product
Within the topic considering the decay of GDP in two major
groups in Vietnam economy: Economic sectors and economic
components. Years ago, especially since the VI Party Congress
Vietnam has many strategic policies in shaping the development of
the economic sectors and economic components. This is associated
with many major undertakings in the economy and concretized by
resolutions of the Party, economic development strategy of the
Government. So, the thesis reviews each economic sector and each
economic component what contribution to GDP, commensurating
with the investment incentives, accessing to resources for Vietnam‟s
economic sectors, as well as the economic components.
When the decomposing of GDP into economic sectors, GDP is
an aggregate indicator and each economic sector is an indicator parts,
so, when each economic sector changes (increased or decreased) that
will impact directly to the change in GDP. Similarly, when GDP is
decomposed into economic sectors, thì khi each component of
economic changes that is also a direct impact to the change in GDP.
1.2. EVIDENCE IN EMPIRICAL RESEARCH
1.3.1. Evidence in empirical research in the world
- The basic factors affecting GDP:
+ Capital investment in the economy.
+ Employee.
+ Institutions.
+ Inflation in the economy.
+ The openness of the economy.
8
+ Monetary policy.
+ The development of the stock market.
+ Energy consumption in the economy.
+ Lag in Investment; inflation and GDP growth.
- The different quantitative research methods: Regression
model, Vector autoregressive model (VAR), Random effects model
(REM), fixed effects model (FEM), Vector Error Correction Model
(VECM), testing the causal Granger, neural network model,...
1.3.2. Evidence in empirical research in the case of
Vietnam
- The basic factors affecting GDP:
+ Capital investment in the economy.
+ Employee.
+ Institutions.
+ Inflation in the economy.
+ The openness of the economy.
+ Monetary policy.
+ Energy consumption in the economy.
+ Delay in Investment and GDP growth.
- Employed methods: Empirical studies of the Vietnam case
employ a variety of different research methods, however only a few
works have been applied the neural network model to examine GDP
fluctuations as compared to cross-country studies..
1.3.3. Academic gaps in empirical research of scale
fluctuations of GDP in Vietnamese economy
Comparing the experimental study in Vietnam and abroad
shows that studies at home and abroad still have gaps in terms of
content as well as research methods.
9
- Methodologically, the experimental study abroad was made
using neural network model on a number of works to study the
impact of these factors on GDP. In VietNam, we have not seen many
works using neural network model to study fluctuations in the size of
GDP at national level as well as local level.
- In terms of content the domestic works are mainly
approached from the total supply the economy to study the factors
that affect GDP: Capital, labor and TFP. No many research studies
combined factors between the power and the capital, labor, the
openness of the economy, inflationary impact on GDP.
It is concluded that methodological studies as well as
research content of Vietnam GDP scale there are also issues to be
clarified. This is a gap in research that the thesis towards to perform.
CHAPTER 2
RESEARCH DESIGN
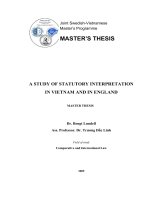
2.1. RESEARCH PROCESS
To meet the objectives and deal with the research questions, the
overal process of this research is described in the figure 2.01:
- Qualitative methods are used to overview, to systematize
the theory of economic growth, economic growth model, and the
experimental research on GDP fluctuations scale as the basis for the
proposed research model.
- Qualitative methods are used in the subject with purposes
to analysis GDP scale fluctuations trend, testing of the existence of
the proposed research model and testing of hypotheses.
.
10
RESEARCH ISSUES
- Fluctuations of GDP scale
- Relationship: Factors - GDP scale
Fluctuations of GDP scale.
The
statistical
indicators
describe volatility trends over
time GDP.
Relationship: Factors - GDP scale
- The research model.
- The research hypothesis.
volatility.
- The research model accreditation.
- The research hypothesis accreditation.
- Estimating the impact of the factor to
GDP scale.
- Commenting results.
- Proposed policy implications.
Figure 2.01. Research process
2.2. INDICATOR SYSTEM IS USED TO ANALYZE THE
SCALE FLUCTUATIONS IN GROSS DOMESTIC PRODUCT
2.2.1. These indicators reflect the gross domestic product
GDP growth is measured by the change in the percentage of
GDP of the period compared to the base studied period.
- Continuous growth.
- Average growth.
- Absolutely continuous increase.
- The average absolute increase.
11
2.2.2. The analytical indicators of structural contribution
to growth domestic product
- Growth value added (VA) of each component in the
economy.
- VA structure of each part in the economy.
2.3.3. The analytical indicators of structural contribution
to gross domestic product
- The efficiency of investment in the economy.
- Effective use of labor in the economy.
2.3. PROPOSING THE MODELS EXAMINING FACTORS OF
AFFECTING THE SCALE OF GROSS DOMESTIC
PRODUCT
2.3.1. The neoclassical growth Model
Neoclassical model is developed by Robert Solow and
Trevor Swan called Solow model. Solow model measures the impact
of these factors on the results of economic production is expressed in
the form of the production function formula (2.01).
Y = f(A, K, L) (2.01)
In which:
Y: GDP representive indicator to measure the results the
output of the economy.
A: Total factor productivity – TFP.
K: Total investment in fixed assets in the economy.
L: Total employment in the economy.
The research hypothesis of the neoclassical model.
- Hypothesis H1.1: The total investment in the economy
changes, GDP will change.
- Hypothesis H1.2: The workforce total engaged in production
activities in the economy changes, GDP will change.
12
- Hypothesis H1.3: TFP changes, GDP will change.
2.3.2. The Neoclassical extended Model
Based on the proposed model development based on the
neoclassical model (2.01), based on the theoretical foundations of
The Neoclassical extended Model, Combined with experimental
research projects at home and abroad, and based on the real activity
situation of the Vietnam economy, monitoring and reporting
Vietnam's social and Economic data. Study Model of factors
affecting the size of GDP is represented by the formula (2.02):
Y = f(K, L, CPI, XNK, LD, GD) (2.02)
In which:
Y: GDP representive indicator to measure the results the
output of the economy.
K: Total investment in fixed assets in the economy.
L: Total employment in the economy.
CPI: Consumer price index– indicators reflecting inflation in
the economy.
XNK: The proportion of exports and imports/GDP reflects
the openness or degree of economic integration.
LD: Energy consumption in the economy.
GD: Oil traded prices on the market.
The research hypothesis reflects the impact of the 6 factors
affecting GDP.
- Hypothesis H2.1(H1.1): The total investment in fixed assets
in the economy changes, GDP will change.
- Hypothesis H2.2(H1.2): The total workforce engaged in
production activities in the economy changes, GDP will change.
- Hypothesis H2.3: The economic inflation changes, GDP will
change.
13
- Hypothesis H2.4: The opening of the economy changes,
GDP will change.
- Hypothesis H2.5: The amount of power consumption in the
economy changes, GDP will change.
- Hypothesis H2.6: The oil prices changes, GDP will change.
2.4. METHODS OF ANALYSIS THE IMPACT OF THE
FACTORS
TO
GROSS
DOMESTIC
PRODUCT’S
VOLATILITY
2.4.1. The analyzing method about the impact of capital,
labor and TFP to gross domestic product
- Accounting method
- Econometric models
+ The model does not change the scale
+ Models have time lag factor
+ Combining superlative difference model and testing the
causal (Granger).
+ Lag distribution model (ARDL)
+ Error correction vector Model (VECM).
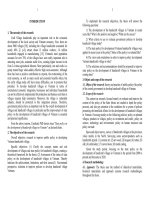
2.4.2. The Neural Network Model
According to Ngo Van Sy (2008)‟s Translation: “Artificial
neural networks (Artificial Neural Network - ANN) regeneratives the
function of the human nervous system with a multitude of associated
neurons communicating with each other over a network. Like
humans, neural network is learned by experienceneural network is
learned by experience and used in appropriate situations”.
14
Figure 2.02. Neural network model structure MLP
Within the scope of the use of neural network model 3-layer
structure in the figures (2.02):
- The first layer is called the input layer(Input layer)
including input factors of neural networks. In this study, the input
variables mainly reflect the factors affecting the size of GDP.
- The second layer is called the hidden layer(Hidden layer)
including nodes (Nude) or hidden neurons. Each hidden layer of
neural network may have one or more neurons depending on the
research variables which are included in the neural network model to
analyze.
- The third layer is called the output layer (Output layer)
reflecting the final outcome of the combination of input factors to the
hidden layer neurons to produce the output value. The output value
of the neural networks in the study is variable GDP.
15
Neural network research process
+ Identifying the input and output variables of neural
network model: Correlation Inspection.
+ Defining neural network model:
* Root square error Average root square – Original average
error (Root mean squared error–RMSE).
* The determination coefficient (R Squared – R2).
+ Commenting level of individual impact on GDP based on
estimated results of neural network mode.
2.5. DATA SOURCES AND METHODS OF DEFLATION
2.5.1. Data source
Collecting from Vietnam General Statistics Office:
+ Collecting directly from the website of the General
Statistics Office Vietnam, however this source is limited from 2005
to 2013. Private data 2014 is estimated (provisional).
+ Data 1990 - 2004 were collected from the Statistical
Yearbook of Vietnam in 1993-2005.
- The data used to compare GDP growth Vietnam and some
countries in the ASEAN region are obtained from the International
Monetary Fund(IMF) database.
- Inflation Data (%) are colleted from the Statistical
Yearbook of Vietnam and the IMF database.
- Crude prices data (USD/crate) are determined by the
simple average trading price of annual with each barrel of crude oil
traded on the stock market of New Work.
- Data on power consumption in the economy (million Kwh)
collected from the electricity consumption reports of Vietnam
national electricity company in 1990-2014.
16
2.5.2. Methods of deflation
All data are converted into the base prices- 2010 year.
2.5.3. Estimated total fixed assets in the economy
The total value of fixed assets in the economy is estimated
indirectly through an indicator of investment in the economy.
CHAPTER 3
STUDY OF SCALE FLUCTUATION IN GROSS DOMESTIC
PRODUCT IN VIETNAM AND ITS FINDINGS
3.1. ANALYZING SCALE FLUCTUATION TREND OF GDP
3.1.1. Vietnam’s Gross Domestic Product Growth
Vietnam GDP period 1990-2014 with an annual average
growth rate is 6.85% corresponding to an average annual increase
86858.74 (billions dong).
- Period 1990-1997: The resources are mobilized to serve the
manufacturing process of the economy which making an annual
average GDP growth rate up to 9.11% , especially GDP in 1995
increased 9.54%; increased 9.34% in 1996.
- Period 1998-2001: You may recall that this is the period of
first economic recession in Vietnam which made the average GDP
growth in the period 1998-2001 only 6.05%.
- Period 2002-2007: This was a period of economic recovery
after the first Vietnam‟s economic recession, with an annually
average GDP growth rate of 7.31%.
- Period 2008-2009: Vietnam fell into a second economic
recession affected by the world economic crisis starting from US
17
financial markets spreading globally. Average GDP growth for
2008-2009 was 5.53%.
- Period 2010-2014: This is the stage when Vietnam
economy without clear trend with an annual average GDP growth
of 5.86%
3.1.2. Comparing Vietnam’s Gross Domestic Product
Growth and other countries in ASEAN-5
The average GDP growth of Vietnam during 1990-2014 at
6.85% was the highest among ASEAN countries. The average
growth rate of the ASEAN was 5,85% and ASEAN 5 (Indonesia;
Malaysia; Philippines; Singapore; Thailand) was 5,16%.
- GDP per capita of Vietnam period 1990-2014 was 726,27
USD. In comparision relation Vietnam with other countries in the
region, GDP per capita of Vietnam is too low compared with the
general level ASEAN 3.601,27 USD-14.017,25 USD.
3.2. CONTRIBUTION OF GDP SECTOR COMPOSITION TO
ITS GROWTH
3.2.1. Contribution of GDP sector composition to its
growth
Period 1990-2014, VA contribution percentage to GDP of
the service sector was the highest with 41.23% followed by industry
group 34,41And the lowest ones in agriculture, forestry and fisheries
24,36%.
Although, industry and service sectors are much larger
invested in the economy compared with agriculture, forestry and
fisheries, the efficiency of investment between sectors reflected
unlike investment ratio between economic sectors. Agriculture,
Forestry and Fisheries Sectors act as an insurance role in the
economy. Investing little but most jobs.
18
3.2.2. Contribution of GDP ownership-sector composition
to its growth
State economic sector in contribution to GDP growth
Vietnam in period 1996-2000 was 34,36% and 2001-2005 was
36,07%, higher than the sector with foreign investment respectively
31.01% and 16.46%.
Presently, there are paradoxes in Vietnam's economy in the
order of investment incentives reserves of economic sectors: The
first is the state economy; foreign investment Economy; finally the
private economic sector, however in terms of contribution to GDP
growth and investment efficiency in the economy then the private
sector is the highest than other economic sectors. Private economic
sector is the sector generated the most jobs in the economy.
3.3. THE IMPACT OF FACTORS SUCH AS CAPITAL,
LABOR AND TFP ON VIETNAM’S GROSS DOMESTIC
PRODUCT GROWTH
3.3.1. The testing result and estimation of the model does
not change due to scale
Based on the assumption: “The model does not change
according to the scale” estimation results indicate α =0,696.
α + β = 1 β = 1 -αβ = 1 - 0,696=0,304
Vietnam GDP Growth period 1991-2014 mainly relyed on
investment factors in the economy, with an average increase of
investment in fixed assets in the economy with 7,86%.
The level of employee contribution to GDP growth period
1991-2014 the second factor after capital, with annual increase was
19
2,48% impact on GDP growth 0,76% getting proportion 10,87% in
total GDP growth period 1991-2014.
TFP as a factor reflecting the combination of input factors of
production process, management mechanism, scientific and
technological level,...contribution to Vietnam „s GDP growth was the
lowest, period 1991-2014 was 0,72% getting 10,39% the proportion
of the average GDP growth of Vietnam.
3.3.2. The testing result and estimation of latency model.
- Estimation results according to the first difference
model reflect that in short term“The model does not change
according to the scale”.
- Estimation results according to the first difference model
with late distribution reflect that in short term Vietnam GDP
growth exist only 2 factors: labor factor and GDP growth with a
lag of one year.
Estimation results VECM, Vietnam GDP growth after
having been adjusted wrong number between short-term and longterm depends on GDP growth with a lag of 1 year and 2 years.
3.4. ESTIMATION THE IMPACT OF FACTORS TO GROSS
DOMESTIC PRODUCT SCALE BY THE NEURAL
NETWORK MODEL
With correlate testing results, more precisely Ln(GDP)
correlated with the factors: Total investment in fixed assets in the
economy; Total employees engaged in the manufacturing process in
the economy; Inflation in the economy; Import-export turnover of
economy; Oil prices; Energy consumption in the economy; GDP in
the past with 1 and 2-year delay; Total investment in fixed assets in
the economy with a lag of 1 year and 2 years; economic crisis once I.
20
3.4.1 Neural network model
Estimation results of factors affecting GDP Vietnam
according to neural network model show that model with 12 hidden
layer neurons is the best. The model with 12 hidden layer gives the
best explanation of factors impacting Vietnam GDP with 97,5%
which is higher than the remaining models. Besides 12 hidden layer
neurons also is the smallest wrong number model.
3.4.2. Discussion on the estimated results
Based on the value of the connection coefficient shows that
the level of impact of these factors in turn from high to low:
Investment in fixed assets factor was ranked highest; Total electricity
consumption in economy is respective 2nd place; 3rd Total labor; 4th
oil price; 5th inflation; the openness of the economy 6th; 7th
economic crisis. Next GDP in the past 1 year latency 8th; 1 year
latency fixed assets 9th and the last two variables 2 year lag of GDP
and total fixed assets, respectively 10 and 11.
21
CHAPTER 4
POLICY IMPLICATIONS
4.1. THE DEVELOPMENT OF AGRICULTURE AND
FORESTRY - FISHERIES SECTOR
+ The government should have programs with investment
objectives for services and industrial development, supporting
agriculture and forestry fisheries development. This is the essentially
right direction of Vietnam, because Vietnam has got experience, has
a comparative advantage compared to the world in the agriculture
and forestry sectors - fisheries. The modern industries like auto; new
technologies theoretically create higher value-added than agriculture
and forestry sectors - fisheries. Besides Vietnam does not have the
advantage of developing the industry if Vietnam concentrate
resources on investment which will lead that industry groups
Vietnam have advantages to be left behind and occupations which
Vietnam invest, could not compete with the products of the advanced
countries.
4.2. THE DEVELOPMENT OF OWNERSHIP SECTOR
BASED ON INVESTMENT EFFCIENCY
+ Government should reconsider the policy of economic
state development and building which is a key economic sector, as
the leader in the Vietnam economy.
+ Without discrimination, economic sectors are equal in
opportunities to access resources, especially the resources invested in
the economy.
- State Economy focus on public products, production for
community, for ensuring security and defense. Separating the
22
business function of state economy from the function implementing
the obligations of public security and defense of the state economy.
4.3. IMPROVING THE EFFECTIVE CONTRIBUTION OF
THE FACTORS TO THE GROWTH OF GROSS DOMESTIC
PRODUCT
- Capital factor: Government should orient the investment
flows into the economic sectors based on the efficient use of capital
principles.
- Labor factor: Changing strategy of human resource
training Vietnam, orienting training institutions at all levels is the
training of human.
- Power factor:
+ Power consumption factor in the economy: Diversification
different power source as wind power, Solar, Thermal. Limiting
development of power soures from hydropower and reducing
dependence on power supply which is bought from China and some
countries in the region.
+ Petroleum energy sources: The advisory department, the
State management agencies should study to implement prices
insurance measures gasoline through the financial instruments on the
international market.
- Inflation factor: Performing synchronous measures,
including the promotion of investment efficiency, control oil prices,
power prices in the economy will help control inflation in Vietnam.
- Economic openness factor: Improvement scale and
commodity structure of export of Vietnam towards export the refined
products of high added value. In short term, studying enterprise
system guide of Viet Nam to understand and use privileges which
were committed between Vietnam to other countries, các commercial
23
organizations worldwide so that Vietnam may penetrate the world
market.
TFP factor: Continuing stronger reforms of administrative
procedures, improving the legal system to create healthy legal
framework, to create favorable conditions for all objects in economy
are eligible to participate in the production process of the economy.