Key factors affecting house purchase decision of customers in vietnam
Bạn đang xem bản rút gọn của tài liệu. Xem và tải ngay bản đầy đủ của tài liệu tại đây (1.71 MB, 73 trang )
UNIVERSITY OF ECONOMICS HO CHI MINH CITY
International School of Business
--------------------
PHAN THANH SI
KEY FACTORS AFFECTING HOUSE
PURCHASE DECISION OF
CUSTOMERS IN VIETNAM
ID: 60340102
MASTER OF BUSINESS (Honours)
SUPERVISOR: DINH THAI HOANG, Ph.D.
Ho Chi Minh City - Year 2012
ii
ACKNOWLEGEMENTS
First of all, I would like to express my deep appreciation to my supervisor, Dr. Dinh
Thai Hoang who instructed and helped me enthusiastically during period of the
thesis.
I also would like to thank you all my colleagues and friends of Hoa Binh Corporation
and Sacomreal for their valuable contributions to give comments and suggestion to
revise the questionnaire survey.
I am grateful to the supervisory board for providing me with their available advices
and patient supports when I need.
I will never forget the friendly postgraduate students for helping me during studying
and doing thesis.
The most special thanks go to my parents, my brothers and sisters who always create
the most convenient conditions for me as well as support me all time.
iii
ABSTRACT
The main purpose of the study is to investigate the effecting of key factors on housing
purchase decision of customers in Vietnam. First, a model which is proposed based
on analyzing of previous literature. Then the model is tested on a pilot test which is
conducted of a small real estate professional group and another group of 15
respondents, and on a larger survey of 263 samples. The study finds out a strong
positive relationship between top two factors, including “living space”, “distance”
and customers’ housing purchase decision. The three weaker positive relationship
factors are “feature”, “finance” and “environment” to housing decision makers. It is
also found that there is no difference in decision making of customers according to
different demographics consisting of gender, age, marital status, monthly income and
education level.
Key works: real estate, purchase factors, Vietnam
iv
TABLE OF CONTENTS
ACKNOWLEGEMENTS ........................................................................................ii
ABSTRACT ...........................................................................................................iii
LIST OF TABLES ................................................................................................ vii
LIST OF FIGURES ..............................................................................................viii
ABBREVATIONS ...............................................................................................viii
CHAPTER 1. INTRODUCTION ....................................................................... 1
1.1.
BACKGROUND ........................................................................................... 1
1.2.
RESEARCH PROBLEMS & RESEARCH QUESTIONS ............................. 1
1.3.
RESEARCH PURPOSE ................................................................................ 3
1.4.
SCOPE OF THE RESEARCH ...................................................................... 3
1.5.
RESEARCH STRUCTURES ........................................................................ 3
CHAPTER 2. LITERATURE REVIEW ........................................................... 4
2.1.
LITERATURE REVIEW .............................................................................. 4
2.1.1.
Feature ....................................................................................................... 4
2.1.2.
Living space ............................................................................................... 4
2.1.3.
Finance ....................................................................................................... 5
2.1.4.
Distance ..................................................................................................... 5
2.1.5.
Environment ............................................................................................... 5
2.1.6.
Purchase decision ....................................................................................... 6
2.1.7.
Demography ............................................................................................... 6
2.2.
CONCEPTUAL FRAMEWORK .................................................................. 7
CHAPTER 3. RESEARCH METHODOLOGY ............................................... 8
3.1.
RESEARCH PROCESS ................................................................................ 8
3.2.
SAMPLE SIZE ............................................................................................ 11
3.3.
MEASUREMENT SCALE ......................................................................... 11
3.3.1.
Measurement scale ................................................................................... 11
3.3.2.
Pilot test ................................................................................................... 11
3.4.
MAIN SURVEY ......................................................................................... 15
v
3.5.
DATA ANALYSIS METHOD .................................................................... 15
3.5.1.
Reliability measure ................................................................................... 15
3.5.2.
Validity measure by EFA (Exploratory Factor Analysis) .......................... 16
3.5.3.
Multiple regression analysis ..................................................................... 16
CHAPTER 4. DATA ANALYSIS & RESULTS ............................................. 18
4.1.
PREPARATION DATA .............................................................................. 18
4.1.1.
Editing...................................................................................................... 18
4.1.2.
Coding...................................................................................................... 18
4.2.
DESCRIPTIVE DATA ................................................................................ 21
4.3.
ASSESSMENT MEASUREMENT SCALE ................................................ 23
4.3.1.
Cronbach’s Alpha ..................................................................................... 23
4.3.2.
Exploratory Factor Analysis (EFA) .......................................................... 26
4.3.2.1.
Assessment of data ................................................................................ 26
4.3.2.2.
Defining number of extracted factors .................................................... 27
4.4.
HYPOTHESES TESTING BY MULTIPLE REGRESSION ....................... 30
4.4.1.
Checking assumption of Multiple Regression ........................................... 30
4.4.1.1.
Sample size ........................................................................................... 30
4.4.1.2.
Assessment multicollinearity of independent variables.......................... 30
4.4.1.3.
Normality, linearity, homoscedasticity & outliers.................................. 30
4.4.2.
Evaluating the model ................................................................................ 31
4.4.3.
Evaluating the independent of variables ................................................... 31
4.4.4.
Checking hypotheses of model ................................................................. 32
4.4.5.
Analysis effect of control variables by Multiple Regression ..................... 34
CHAPTER 5. CONCLUSIONS AND IMPLICATIONS ................................ 35
5.1.
RESEARCH OVERVIEW .......................................................................... 35
5.2.
RESEACH FINDINGS ............................................................................... 35
5.3.
MANAGERIAL IMPLICATIONS .............................................................. 36
5.4.
RESEARCH LIMITATIONS & DIRECTIONS FOR FUTURE RESEARCH ......... 37
vi
REFERENCES .................................................................................................... 38
Appendix 1: The first draft of the questionnaire..................................................... 42
Appendix 2: The English questionnaire ................................................................. 45
Appendix 3: The Vietnamese questionnaire ........................................................... 49
vii
LIST OF TABLES
Table 3.1: Main factors affecting customers’ housing purchase decision ............... 13
Table 4.1: Codebook of questionnaire items .......................................................... 18
Table 4.2: Characteristics of respondents ............................................................... 22
Table 4.3: Cronbach’s Alpha test results ................................................................ 25
Table 4.4: EFA results ........................................................................................... 28
Table 4.5: Correlations among variables ................................................................ 29
Table 4.6: Coefficient table of MLR ...................................................................... 32
Table 4.7: Hypotheses results ................................................................................ 33
Table 4.8: Descriptive statistics ............................................................................. 54
Table 4.9: Cronbach’s Alpha with full items for each constructs ........................... 54
Table 4.10: KMO and Bartlett’s test ...................................................................... 56
Table 4.11: Total variance explained ..................................................................... 56
Table 4.12: Correlation among variables (Partial only) .......................................... 57
Table 4.13: Factor Matrix ...................................................................................... 59
Table 4.14: Factor Correlation Matrix ................................................................... 60
Table 4.15: Model summary .................................................................................. 60
Table 4.16: Anova ................................................................................................. 60
Table 4.17: Casewise diagnostics .......................................................................... 60
Table 4.18: Residuals statistics .............................................................................. 61
Table 4.19: Cofficients of MLR including Sex_Render ......................................... 63
Table 4.20: Cofficients of MLR including Marital_Render .................................... 64
Table 4.21: Cofficients of MLR including Education_Render ............................... 64
Table 4.22: Cofficients of MLR including Age_Render......................................... 64
Table 4.23: Cofficients of MLR including Career_Render ..................................... 65
Table 4.24: Cofficients of MLR including Income_Render ................................... 65
viii
LIST OF FIGURES
Figure 2.1: Conceptual framework .......................................................................... 7
Figure 3.1: Research process ................................................................................. 10
Figure 4.1: Scree plot ............................................................................................ 58
Figure 4.2: Regression standardized residual ......................................................... 62
Figure 4.3: Normal P-P plot ................................................................................... 62
Figure 4.4: Scatterplot ........................................................................................... 63
ABBREVATIONS
EFA
: Exploratory Factor Analysis
GSO
: Vietnam Government Statistics Office
HCMC : Ho Chi Minh City
Mil.
: Million
MLR
: Multiple Linear Regression
UEH
: University of Economic
1
CHAPTER 1. INTRODUCTION
1.1.
BACKGROUND
As universal population levels continue to rise, the housing shortage in many
developing countries has reached critical levels (Morel, 2001, p. 1119). Real estate
is one of the most important things to citizens, so “the house purchase decision of
them can change their life” (Wells, 1993). The house purchase decisions are
different from other business decisions due to “the innate, durable and long-term
characteristics of real estate”. It is a highly differentiated product with “each
specific site unique and fixed in location” (Kinnard, 1968).
In Vietnam, it is known as the third largest population in South East Asia and ranked
the 14th largest in the world in terms of total population. Its population estimated of
89 million in 2010 (GSO, 2011). The annual average growth population of Vietnam
from 2000 to 2010 was approximately 1.03 million people per year or 1.2% annual
growth. Particularly, one of the top economic centers of Vietnam is Ho Chi Minh
City which has around 7.2 million people as in April 2009, but its actual population
is likely to be significantly higher because of unrecorded migration from rural areas.
The real estate market in Vietnam has significantly changed during from the 1990s
to now and it might be seen as three times fever and declining prices in the last 20
years. Up to the end of 2012, the large real estate outstanding loans and a big
number of inventories created a serious crisis. However, according to the Deputy
Minister of Construction Nguyen Tran Nam, he emphasized that “people’s housing
demand is very large and solvency is high, but the real estate market lacked of
information”.
1.2.
RESEARCH PROBLEMS & RESEARCH QUESTIONS
In general, the real estate in Vietnam has got many difficulties in making effort to
satisfy customer demands. According to incomplete statistics of the Ministry of
Construction surveyed in 44 provinces up to August 30th, 2012, the country now
2
had 16,469 unsold apartments, in which HCMC was 10,108 unsold apartments and
total number of inventories of low buildings was 4,116, in which HCMC was 1,131
ones (Anh, 2012).
Therefore, the Prime Minister stressed that the solution to rescue real estate market
should be included in the Resolution of the Government. The main reasons of the
crisis were the real estate market supply did not meet customer demands, the
investors lacked of exact information of customer and real estate market conditions.
“There are two main fields of customer research are how customers go about
making decisions and how decisions should be made. In addition, “creating true
value for customer and customer notion focused approach” is confirmed (Edwards
& Fasolo, 2001). It is found that “customer decision making is one of the most
important areas of customer behavior and it requires gathering a lot of regarding
information” (Bettman et al., 1998 & Simonson et al., 2001).
There have been many published academic research about customer house purchase
with variety of both developed and developing countries. However, “the national
and cultural characteristics play a very significant role in house purchase decision,
that mean finding which is applied in specific context may not extend to another
context” (Opoku & Abdul-Muhmin, 2010).
The real estate in Vietnam has got specific characteristics to which connected
customer demands closely. In recent years, researchers, domestic and foreign
companies attracted to real estate field in Vietnam with a number of research works.
However, there has been not enough research into the way customers making
decision to buy real estate as well as which major factors have got relationship with
customer decision.
Consequently, in the term of real estate purchase decision of customers, the research
questions of the thesis are raised as two following questions:
3
What are the key factors affecting the house purchase decision of
customers in Vietnam?
How is impact of these factors on house purchase decision of customers
evaluated in Vietnamese context?
Understanding relationship between main factors affecting customer house purchase
decision is an important role for both real estate developers and enterprises to
satisfy customers’ demand and to have available strategies in the real estate field.
1.3.
RESEARCH PURPOSE
Based on the research questions, the main purpose of this thesis is to identify what
factors have impact on house purchase dicision of customers and examine how
these factors influence their decision of buying house in Vietnam.
1.4.
SCOPE OF THE RESEARCH
The research is conducted in Ho Chi Minh City with the respondents who are the
postgraduates and students of UEH with various careers, as well as customers of a
small book-coffee. The timeframe of research lasts from the middle of September to
the end of October in 2012.
1.5.
RESEARCH STRUCTURES
The research is divided into five chapters. The first chapter introduces about
background, research problems, research questions, research purpose, scope of
research and research structures. The second chapter covers literature review of the
previous research and shows hypotheses, as well as the conceptual framework of the
research. The third chapter presents the research process, sampling size,
measurement scale, main survey, and data analysis method. The fourth chapter
concentrates on preparation data, descriptive data, assessment measurement scale
and hypotheses testing. Finally, the fifth chapter points out research overview,
research findings, managerial implications, research limitations and directions for
future research.
4
CHAPTER 2. LITERATURE REVIEW
This chapter presents overview of previous literatures relating to housing purchase
decision making of customers. Also, a conceptual framework is built up and relative
hypotheses of research are raised.
2.1.
LITERATURE REVIEW
2.1.1. Feature
Firstly, “features” of the building structure itself is an important determinant of a
household choice of residence (Quigley, as cited in Haddad, 2011, p. 234). Also, it
is confirmed that “feature” has significant effects on customers’ house purchase
decision making (Sengul et al., 2010, p. 214). The “feature” of house includes
“design”, “house size” and “quality of building” determinants relating to decision
making to buy a house of an individual (Adair et al., 1996; Daly et al., 2003; Sengul
et al., 2010, p.218; Opoku & Abdul-Muhmin, 2010). As a result,
H1. There is a positive impact of house features on customers’ house purchase
decision.
2.1.2. Living space
Secondly, “private living space” is one of most important factors affecting to
“consumer housing decision”. Living space consists of “size of living room”, “size
of kitchen”, “quantity of bathrooms” and “quantity of bedrooms” (Opoku & AbdulMuhmin, 2010, p.219). In addition, it is accepted that there is relationship between
the “space customer” and customers’ purchase making process (Graaskamp, 1981).
Accordingly,
H2. There is a positive impact of living space on customers’ house purchase
decision.
5
2.1.3. Finance
Thirdly, “financial” status is much significant to customer house choice (Hinkle and
Combs, 1987, p.375; Kaynak & Stevenson, as cited in Sengul et al., 2010, p.220).
The “financial” element of real estate requires access to a relative large amount of
“capital” and as well as “borrowing costs” (Xiao & Tan, 2007, p. 865). In addition,
“financial” status bases on combination of “house price”, “mortgage loans”,
“income” and “payment term” (Opoku & Abdul-Muhmin, 2010; Yongzhou, 2009,
p.17). Haddad et al. (2011) finds out the “economic” factor which is consisted of
five variables, such as “income”, “interest rate”, “area”, “conversion” and “taxes”.
Moreover, Adair et al.(1996, p.24) and Daly et al. (2003, p.306) group “interest
rate”, “maximum mortgage”, “maximum monthly payment”, and “length of time
payment” into “financial” factor. Consequently,
H3. There is a positive impact of financial status on customers’ house purchase
decision.
2.1.4. Distance
Fourthly, one of the most important factors affecting individual “decision” making
to buy a house is “location” factor (Kaynak & Stevenson, as cited in Sengul et al.,
2010, p.219). The “residential location” has an influence on “people’s housing
choice” (Zabel & Kiel, as cited in Opoku & Abdul-Muhmin, 2010, p.220). Distance
to choose house can be affected by “width of adjacent” and “location to school”
(Opoku & Abdul-Muhmin, 2010). Moreover, “distance to central business”,
“distance to school” and “distance to work” are considered (Adair et al., 1996,
p.23). In addition, “access to recreational facilities” and “access to main roads” are
proposed (Iman et al., 2012, p.30) . Hence,
H4. There is a positive impact of distance on customers’ house purchase decision.
2.1.5. Environment
6
Fifthly, “environment” including “neighborhood”, “area attractiveness”, “view”,
“noise from around districts” and “general security” is stated as one of the
determinants of a household’s residential decision (Adair, 1996, p.23). It is
confirmed that “environment” has a big influent to housing buyer (Tajima, as cited
in Opoku & Abdul-Muhmin, 2010, p.224) and it is agreed by Morel et al. (2001,
p.1119). Particluarly, “neighbourhood” quality is paid intention highly to house
purchase decision making of customer (Gabriel & Rosenthal, 1989, p.240).
Therefore,
H5. There is a positive impact of local environment on customers’ house purchase
decision.
2.1.6. Purchase decision
Customer behavior is an important research topic for recent decades. “There is also
a clear shift from rational factors to psychological factors and to social decision
factors” (Bargh, 2002). Beside, there is a link between the “intention to purchase” to
“decision to purchase” of customers, especially the decision related to purchase real
estate (Ajzen, 1991, p. 179; Han & Kim, 2010, p. 659; Kunshapn & Yiman, 2011,
p.7579).
2.1.7. Demography
“Demographic” characteristics of customers are internal factors related to decision
making (Mateja & Irena, 2009). “Demographic” characteristics consist of the
individuals in term of “gender, age, educational status, marital status, career, the
quantity of family members and children, as well as the residence property”.
“Demographic” characteristics consist of age (Yalch & Spangenberg, 1990),
education (Gattiker et al., 2000), income level (Dawson et al., 1990), gender (Zhang
et al., 2007) which are factors influenced on the “purchase intention” of customer.
Particularly, “gender” has significantly influence on the financial feature of the
house (Sengul et al., 2010, p.214). It is also confirmed that there is a significant
7
difference in real estate buying decisions to “age” and “gender”, and not to
“educational levels” and “marital status” (Haddad et al., 2011). Correspondingly, in
this study, “gender” and “age” characteristics are considered as control variables so
that investigate whether effect of those demography variables on housing purchase
decision making of customers or not.
2.2.
CONCEPTUAL FRAMEWORK
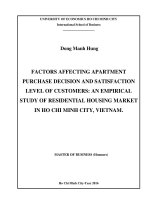
A conceptual framework which is proposed to show the relationship between five
independent variables consisting of “feature”, “living space”, “financial status”,
“distance” and “environment” and one dependent variable, namely “house purchase
decision”. It also shows the effecting of demography including “gender”, “age”,
“marital status”, “income” and “education” as control variables on the dependent
variable. The conceptual framework is shown as the model (see Figure 2.1).
FEATURE
H1 +
H2 +
LIVING SPACE
FINANCIAL
STATUS
H3 +
HOUSE
PURCHASE
DECISION
DISTANCE
H4 +
Control
ENVIRONMENT
H5 +
- Gender
- Age
Figure 2.1: Conceptual framework
- Marital
- Income
- Education
- Career
8
CHAPTER 3. RESEARCH METHODOLOGY
This chapter showed all steps of the research process, the minimum sample size,
measurement scale, main survey and data analysis method.
3.1.
RESEARCH PROCESS
The research process was summarized as following steps.
Step 1: Define the research problems, research questions and research purposes.
Step 2: Review the literature background from the previous research, then a
conceptual model was set up and hypotheses were proposed.
Step 3: Made and revise the draft questionnaire.
A draft questionnaire with the measurement scales based on the previous research
was set up. Next, the draft questionnaire was delivered to 02 real estate
professionals, 03 management officers to respond, and a discussion about the draft
questionnaire was carried out later. The aim of the pilot phase was to modify and
clear the measure scale.
After that, the revised questionnaires were delivered to another small group of 15
persons to test about clear understanding of the questionnaire. Finally, a main
survey was conducted with 263 receivers.
Step 4: Conduct the main survey and collect data within 4 weeks.
The questionnaires were directly sent to 263 persons. The main respondents were
postgraduates of master programs or students who have been studying to get the
second business certification in the University of Economic. Besides, a small group
about 24 persons with a wide variety of careers was also delivered questionnaires at
a book coffee in Ho Chi Minh City. Finally, there were 239 respondents giving their
feedbacks, but 230 cases were available only.
Step 5: Edit, code and adjust missing data before testing reliable and validity of
data.
9
In order to prepare the data to analysis, data were edited, coded and adjusted for
missing data. Next, reliability of measuring instrument was analyzed by calculation
Cronbach’s alpha which was required above .7 (Hair et al., 2010). In addition,
validity of measuring instrument was evaluated due to define the number extracted
factors based on the Eigenvalue value over than 1 and changing of the slope in the
Scree plot (Hair et al., 1998; Tabachnick & Fidell, 2001).
Step 6: Test the hypotheses of research and define relationship of factors in model
through the Multiple linear regression analysis.
The Multiple linear regression analysis was applied to evaluate the relationship
between five independent variables, including “feature”, “living space”, “finance”,
“distance” and “environment” and one dependent variable, namely “decision”.
Moreover, defining whether there was any significant contributory of control
variables consisting of “gender”, “age”, “marital”, “income”, “education” and
“career” on customers’ housing purchase decision was also analyzed by the multiple
linear regression. All steps were illustrated by the following Figure 3.1.
10
Research Problems
Theoretical Framework
- Variables identified & labeled
- Hypotheses generated
Research Proposal
Research Design
Type, purpose, time frame, scope, environment
Data Collection
Design
Sampling
Design
Instrument Development
Pilot testing
Figure 3.1: Research
process
Data Collection & Preparation
Data Analysis & Interpretation
Deduction
- Hypotheses substantiated?
- Research questions answered?
Report Writing
Report Presentation
11
3.2.
SAMPLE SIZE
The reliable and validity of variables were tested by using Cronbach’s Alpha and
EFA, after that the multiple regression was applied to test model and hypotheses.
First of all, the sample size was required to have enough quantity for the analysis.
The minimum sample size was 100 and not less than five times of items (Hair et al.
2010), thus:
n > 100 and n = 5k (where k is the number of items).
Thus, the minimum sample size was 5x34 = 170 samples.
In addition, based on five independent factors of the conceptual model, the multiple
regression analysis required sample size at least (Tabachnick & Fidell, 2007):
50 + (8xm) = 50 + (80x5) = 90 samples.
Where m: is the number of independent factors of the model.
Consequently, the minimum sample size should be 170. Based on the actual
collection data, the quantity of available respondents from the questionnaire survey
estimated 230, so that samples met the requirements above.
3.3.
MEASUREMENT SCALE
3.3.1. Measurement scale
In order to operate concepts, it was necessary to measure them in some manners, so
different variables were required to choose an appropriate scale. The independent
variables were applied interval scale with five - point of Likert scale consisting of
totally unimportant (1), unimportant (2), neutral (3), important (4), very important
(5); beside, the dependent variable was applied the same measure consisting of
strongly disagree (1), disagree (2), neutral (3), agree (4) and strongly agree (5).
3.3.2. Pilot test
In order to test logistics of the questionnaires prior collection data on large cover, a
pilot test was carried out with a small group consisting of two real estate
12
professionals of Sacomreal and three management officers of Hoa Binh
Corporation. All of them had much knowledge and many experience years in the
real estate field.
Firstly, the aim of the pilot test was explained to all of them; moreover, the
questionnaires and relative documents were also sent to them. After that, a
discussion with them was conducted to define which parts would be deleted or
which parts would be added. The results were presented in Appendix 01.
For items of the “house feature” factor, the item “type of finishing” and “quality of
finishing” should be deleted because their content was inside the content of
“construction quality”.
While all items of “private living size” factor were agreed, the item “tax” of
“Finance” factor should be changed into “the registration fee”.
For “distance” factors, the “house on a main bus route” item should be deleted
because this item was not paid attention by customers. The “distance from the house
to shopping centre” item was also proposed to delete because it was too specific and
related to female only. In addition, the group recommended that customers had got
tendency to ignore the “location away from industrial areas” item so this item
should be removed.
For “environment” factor, its “the attractiveness of the area” item had got the same
meaning of “view” item, so “the attractiveness of the area” should be deleted.
The last “decision” factor, it should change “I will want to buy a new house” into “I
will make my effort to buy a new house”.
Finally, after adjusting the first questionnaire table, a small sample size of fifteen
convenient colleagues was delivered the questionnaires to recognize whether any
parts of its unclear to understand or misunderstand. However all of them understood
meaning of questionnaires quite well and knew the way to answer, so the
13
questionnaire was the last version to carry out in the massive areas. After that, a
main survey was conducted.
From above discussion above, a summary table of main factors affecting customer’
housing decision making is presented as following Table 3.1.
2
3
Feature of House
Private Living Space
1
Financial status
No.
Factor
Table 3.1: Main factors affecting customers’ housing purchase decision
Variables
Code
Reference
House size
X1.1
House’s legal status
X1.2
Interior design
X1.3
External design
X1.4
Construction quality
X1.5
Construction duration
X1.6
Type of house
X1.7
Abdul-Muhmin (2010),
Kitchen size
X2.1
Ratchatakulpat (2009),
Quantity of bedroom
X2.2
Sengul et al. (2010), Xiao
Quantity of bathroom
X2.3
Living room size
X2.4
Storey of house
X2.5
House price
X3.1
Adair et al. (1996), Daly et
Maximum mortgage
X3.2
al. (2003), Kaynak &
Maximum monthly
repayment
Interest rate
X3.3
X3.4
Adair et al. (1996), Daly et
al. (2003), Kaynak &
Tevenson (1982), Haddad
et al. (2011), Opoku &
& Tan (2007)
Tevenson (1982), Haddad
et al. (2011), Opoku
(2010), Ratchatakulpat
4
Distance
14
Income
X3.5
(2009), Sengul et al.
Payment duration
X3.6
(2010), Xiao & Tan (2007)
The registration fee
X3.7
Width of adjacent street
X4.1
Distance to work
X4.2
Distance to market
X4.3
Distance to school
X4.4
Distance to recreation centre
X4.5
Distance
to
the
central
7
Demographic
6
Decision
5
Environment
business district
X4.6
Adair et al. (1996), Daly et
al. (2003), Haddad et al.
(2011), Opoku & AbdulMuhmin (2010),
Ratchatakulpat (2009),
Sengul et al. (2010), Xiao
& Tan (2007)
Access to the main street
X4.7
Neighbour’s condition
X5.1
General security
X5.2
View
X5.3
Noise
X5.4
Pollution
X5.5
Nearby traffic
X5.6
Gender
X6.1
Adair et al. (1996), Daly et
Age
X6.2
al. (2003), Haddad et al.
Marital
X6.3
(2011), Mateja (2009),
Income
X6.4
Ratchatakulpat (2009),
Education
X6.5
Sengul et al. (2010), Xiao
Career
X6.6
& Tan (2007)
Planning to buy a new house
X7.1
Ajzen (1991), Han & Kim,
Making effort to buy a new
house
X7.2
Adair et al. (1996), Daly et
al. (2003), Haddad et al.
(2011), Opoku & AbdulMuhmin (2010),
Ratchatakulpat (2009)
(2010), Kunshan & Yiman,
(2011)
15
An
important
affecting
house
person
purchase
X7.3
decision
3.4.
MAIN SURVEY
The questionnaire survey was conducted at the ISB-Mbus class and four of the
economic night classes of UEH in 59C Nguyen Dinh Chieu Street. Besides, three of
the economic night classes of UEH in Nguyen Tri Phuong Street were also
delivered the questionnaires. The last surveyed place was a small PNC book coffee
in Nguyen Oanh Street. Timeframe to survey was from the middle of September,
2012 to at the end of October, 2012.
There were 263 hand-delivered questionnaires, only 239 respondents gave feedback
immediately, but quantity of available respondents was 230.
3.5.
DATA ANALYSIS METHOD
After data collection, the first step would be data preparation with editing, coding,
and data entry to ensure accuracy of data from raw data and to detect errors or
omissions to correct. Next, data were classified to arrange them into groups or
classes of common demographic.
Finally, variables would be tested reliable by Cronbach’s alpha, validity by EFA,
and hypothesis and model would be tested by multiple regression of SPSS.
3.5.1. Reliability measure
In order to check reliability of each of scales with particular sample, as well as
consider the internal consistency of the scales, it was necessary to use Cronbach’s
Alpha coefficient which should be above .7 (Devellis, 2003).
Also, the corrected item - total correlation values should be at least .3 to ensure each
of items was measuring the same from the scale as a whole (Pallant, 2011).
16
3.5.2. Validity measure by EFA (Exploratory Factor Analysis)
In order to evaluate the validity and the correlation among variables to identify
underlying factors or define number of extracted factors, EFA was applied with the
oblique approach using the Promax method. However, some requirements of EFA
should be satisfied (Pallant, 2011):
- The minimum of sample size should be at least 100 and rate of observations per
items of models should be five cases for each of the items, so that meant the
minimum required sample size should be at least 5m = 5x34 = 170 cases (where m:
quantity of items from the conceptual model). The actual sample size was 230,
bigger than 170 so it met the requirement.
- The correlations of r of the correlation matrix should show at least .3.
- Kaiser-Meyor-Olkin (KMO) test must be equal or above .6 (Tabachnick & Fidell,
2007).
- Barllett’s test of sphericity should have significant less than 5%.
- In order to extract factors, the eigenvalue of factors must be greater than 1 (Kaiser,
1956).
3.5.3. Multiple regression analysis
To explore the relationship between independent variables, consisting of “features”,
“living space”, “finance”, “distance” and “environment”, and dependent variable,
namely “decision” as well as to evaluate the importance of those independent
variables in the framework model, the multiple regression analysis was conducted.
The multiple regression analysis required that some following conditions should be
satisfied:
- The minimum sample size based on the formula:
n > 50 + 8m = 50 + 8x5 = 90 samples, where m: number of independent variables
in the conceptual model
17
The actual quantity of cases was 230, so this condition was satisfied.
- The multicollinearity did not exist, so r value, the correlated score was less than .9.
- The collinearity test on variables was via two values “tolerance” and “VIF”,
particularly the VIF should not be less than .1, or above 10.
- The Normal probability plot (P-P) was required with most of the scores
concentrated in the centre (along the 0 point).
- The presence detection of outliers was considered from the Scatterplot.
The multiple regression was used to test hypotheses, to explore the relationship
between five INDEPENDENT VARIABLEs and one dependent variable, and to
consider whether control variables supported or not to dependent variable. The
generalized equation (Donald & Pamela, 2006) was:
Y = o + 1X1 + 2X2 + 2X2 + … +nXn +
Where:
o = a constant, the value of Y when all X values are zero
1 = the slope of the regression surface (the represents the regression coefficient
associated with each Xi)
= an error term, normally distributed about a mean of 0