nghiên cứu dòng chảy dầu nước trong đường ống nằm nghiêng
Bạn đang xem bản rút gọn của tài liệu. Xem và tải ngay bản đầy đủ của tài liệu tại đây (927.08 KB, 232 trang )
STUDIES ON OIL-WATER FLOW IN INCLINED PIPELINES
A Thesis Presented to
The Faculty of Russ College of Engineering and Technology
Ohio University
In Partial Fulfillment
of the Requirement for the Degree
Master of Science
by
\
Damodaran Vedapuri
2
2
March 1999TABLE OF CONTENTS
LIST OF TABLES
TABLE
PAGE NO
4
4
Test matrix
38LIST OF FIGURES
FIGURE Figure 1.1(a)
Figure 1.1(b)
Figure 1.2
Figure 1.3 Figure 2.1
Figure 2.2
Figure 2.3 Figure 2.4
Figure 2.5
Figure 2.6
Figure 2.7 Figure 2.8 Figure 3 1 Figure 3.2 Figure 4.1
PAGE NO
Description of flow pattern classification for oil-water
Figure 4.2
Variation of water percentage with vertical position (Input
water
cut
=
60%,
Inclination
=
+5°)
Figure 4.3
Variation of water percentage with vertical position (Input
water
cut
=
80%,
Inclination
=
+5°) . . 42
Figure 4.4
Insitu velocity profile for different input mixture velocities
(Input water cut = 80%, Inclination = +5°) . . 47
. 41
5
5
Figure 4.5
Analysis of the cross section for the three flow patterns
. . 48
observed
Figure 4.6
Variation of water percentage with vertical position (Input
water
cut
=
20%,
Inclination
=
+2°) . . 50
Figure 4.7
Variation of water percentage with vertical position (Input
water
cut
=
40%,
Inclination
=
+2°) . . 51
Figure 4.8
Variation of water percentage with vertical position (Input
water
cut
=
60%,
Inclination
=
+2°) . . 52
Figure 4.9
Variation of water percentage with vertical position (Input
water
cut
=
80%,
Inclination
=
+2°) . . 53
Figure 4.10
Insitu velocity profile for different input mixture velocities
(Input water cut = 20%, Inclination = +2°) . . 56
Figure 4.11
Insitu velocity profile for different input mixture velocities . . 57
(Input water cut = 40%, Inclination = +2°)
Figure 4.12
Variation of water percentage with vertical position (Input . . 58
water
cut
=
60%,
Inclination
=
+2°)
Figure 4.13
Insitu velocity profile for different input mixture velocities
(Input water cut = 80%, Inclination = +2°) . . 59
Figure 4.14
Variation of water percentage with vertical position
(Mixture velocity = 0.4 m/s;Inclination = +15°) . . 61
Figure 4.15
Variation of water percentage with vertical position
(Mixture velocity = 1.2 m/s;Inclination = +15°)
62
Variation of water percentage with vertical position
(Mixture velocity = 1.2 m/s;Inclination ==+15°)
..........................................................................................
Variation of water percentage with vertical position
(Mixture velocity = 1.6 m/s;Inclination = +15°)
..........................................................................................
Veocity profile across the cross section from the top to
the bottom (Input water cut = 20%, Inclination = +15°)
..........................................................................................
Variation of water percentage with vertical position
(Mixture velocity = 1.2 m/s;Inclination = -15°)
..........................................................................................
Variation of water percentage with vertical position
(Mixture velocity = 1.6 m/s;Inclination = -15°)
..........................................................................................
Variation of water percentage with vertical position
(Input water cut = 40%, Inclination = -2°)
..........................................................................................
Variation of water percentage with vertical position
(Input water cut = 60%, Inclination = -2°)
..........................................................................................
Variation of water percentage with vertical position
(Input water cut = 80%, Inclination = -2°)
..........................................................................................
Variation of water percentage with vertical position
(Input water cut = 40%, Inclination = -5°)
..........................................................................................
Variation of water percentage with vertical position
(Input water cut = 60%, Inclination = -5°)
..........................................................................................
Variation of water percentage with vertical position
(Input water cut = 80%, Inclination = -5°)
..........................................................................................
Effect of inclination on the insitu water distribution
(Input water cut = 60%, Mixture velocity = 0.4 m/s)
....
Effect of inclination on the insitu water distribution
(Input water cut = 60%, Mixture velocity = 0 8 m/s) ,
Effect of inclination on the insitu water
distribution (Input water cut = 60%, Mixture
velocity = 1.2 m/s) ...
vi
63
8
Variation of water layer height with mixture velocity (Input water cut = 40%)
igure 4.3 1
igure 4.32
igure 4.33
64
.
.
86
Variation of water layer height with mixture velocity
(Input
water
cut
=
60%)
Variation of mixed layer height with mixture velocity . . 88
(Input
water
cut
=
60%)
67
Variation of oil layer height with mixture velocity
89
(Input water cut = 60%).............................................................
igure 4.34
Input vs in situ water percentage as a function of . . 93
69
inclination angle (Mixture velocity = 0.4 m/s)
igure 4.35
Input vs in situ water percentage as a function of . . 95
inclination angle (Mixture velocity = 0.4 m/s)
igure 4.36
70
Input vs in situ water percentage as a function of . . 97
inclination angle (Mixture velocity = 0.8 m/s)
igure 5.1
Schematic of the mixing phenomena in oil-water flows ..........
. 100
igure 5.2
Schematic description of oil-water stratified flow.....................
. 103
73
igure 5.3
Flow chart of the numerical technique.......................................
. 106
igure 5.4
Variation of water layer height with mixture velocity
(2 cP oil in horizontal pipes)......................................................
. 108
74
igure 5.5
Variation of water layer height with mixture velocity
(2 cP oil in horizontal pipes)......................................................
109
igure 5.6
Variation of mixed layer height with mixture velocity
(2 cP oil in horizontal pipes)......................................................
. Ill
75
igure 5.7
Variation of mixed layer height with mixture velocity
(2 cP oil in horizontal pipes)......................................................
. 112
77
78
115
79
9
igure 5.8
Variation of water layer height with mixture velocity
(2 cP oil in 2 degree upward inclined pipes) .............................
igure 5 9
Comparison
of predicted
film
heights using
twoatphase
and cut)
three
phase model
(2 cP oil
in horizontal
pipes
60% water
Variation of water layer height with mixture velocity
Figure 5.10
96 cP oil in horizontal pipes)
1 13
11
115
10
10
7CHAPTER 1
INTRODUCTION
The occurrence of two phase and three phase flows in pipelines is very common in
the petroleum industry. The wide spread existence of multiphase flow has prompted
extensive research in this area. Two phase flows in pipelines can be classified as: (1) gasliquid flow, (2) liquid-liquid flow (3) gas-solid flow and (4) liquid-solid flow. Most of the
work done in horizontal pipes has been for gas-liquid flow. In comparison to gas-liquid
studies, there is a lack of adequate understanding on the flow and mechanisms of liquidliquid flows. The flowing mixtures of two immiscible liquids are frequently encountered in
the design of a variety of practical equipment. For example, studies have been carried out
to understand the reduction in apparent viscosity of heavy crudes by addition of less
viscous liquid which is usually water. Reduction in viscosity reduces the pressure gradient
and the viscous liquid can be transported at a higher rate as a two-phase flow rather than as
a single component, under conditions of equal pressure drop.
11
11
A homogenous flow pattern of an oil-water mixture could lead to formation of an emulsion
leading to a complicated rheological behavior. Vast difference in pressure gradients are
encountered depending on the flow pattern. Another phenomenon that further complicates
an oil-water dispersion system is the phase inversion phenomenon, in which the dispersed
phase switches to the continuous phase. The phase that coats the pipe wall is called the
“continuous” phase or the “dominant” phase and the other, mixed in the continuous phase,
is the “dispersed” or the “internal” phase. It is highly desirable in pipeline design to be able
to accurately predict this phase inversion point for the flowing oil-water system, since the
pressure drop in the pipeline could greatly differ between an oil-in-water and a water-in-oil
systems.
Maturing oil wells produce more and more sea water and natural gas containing
carbon dioxide. This leads to a corrosive multiphase mixture of saltwater-oil-carbon
dioxide in the pipelines. It is very important always to study the two phase oil-water flow
since the presence of an external water phase does lead to these corrosive environments.
The presence of a free water phase also leads to hydrate formation resulting in a blockage
of pipe line. At low water cuts, a water-in-oil dispersion is observed. As the water cut
increases water break out may occur leading to flow of a separate layer of water and at
higher water cuts phase inversion may occur.
With increase in the life time of a well the water cut observed will increase. At
lower water cuts, corrosion may not be observed. But at higher water cuts significant
corrosion rates are observed. Most of these multiphase pipelines are located in remote
areas. Therefore, repair, maintenance, clean up or replacement costs are extremely high.
Further, most of these pipelines run several hundred miles. Hence the use of corrosion
resistant pipe materials is not economically feasible. Use of corrosion inhibitors is an
important method to curb corrosion and is currently being studied.
12
12
Corrosion inhibitors are substances containing organics that adsorb to the metal
surface and form a protective film to prevent corrosion. The effectiveness of the inhibitor
depends on the pipeline material, the inhibitor composition and the type of flow. It is
necessary to introduce the inhibitor into the phase in contact with the pipe wall and this can
be accomplished only if flow patterns and phase distributions under different conditions are
known. This will enable researchers to decide whether to use oil or water-soluble corrosion
inhibitors, under different conditions and different flow patterns.
Oil-water flows can be broadly classified into two principal flow patterns, namely
stratified (oil and water as separate layers) and mixed (the oil and water mixture flows as
dispersion). As the transition occurs from stratified to completely mixed flow, many interim
flow patterns are observed. A detailed description is given below.
The flow regimes were observed by Oglesby (1979) for three experimental oils and
are shown in Figures 1.1(a) and (b) and Figure 1.2 for the oils described above. The oils
had viscosities of 167 cP, 61 cP and 32 cP respectively.
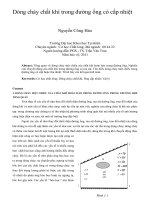
Flow Direction
For liquid velocities up to 0.25 m/s, the flow is
stratified. The oil and water layers flow as two distinct
phases, with no mixing at the interface. As the mixture
velocity is increased, some mixing occurs at the
interface giving rise to semi-segregated flow (regime
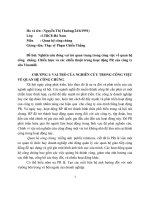
B). The other flow regimes in Figure 1.2 are separated
by a darkened line which represents the phase inversion
point. The flow is said to be semi-mixed (Regime’s C
and K, Figure 1.1 (a)) when there is a segregated flow
of a dispersion and a ‘free’ phase and the dispersion
volume is less than half the total pipe volume. The
region’s C and K in Figure 1.2 depict the semi-mixed
flow regime with the oil and water as dominant phases,
respectively. Mixed flow occurs when the oil-water
dispersion occupies more than half the pipe volume and
is observed to occur in the regions D and L for the oil
and water dominant phases, respectively. Annular flow
develops when there is a core of one phase within the
other phase and this regime is marked G on the map. At
high mixture velocities the flow pattern is semidispersed and withSegregated - no mixing at the
interface
Semi-segregated - some mixing at the interface
FLOW PATTERN CODE Oil Dominnnt Wnier
Dominant
Flow Direction
Semi-mixed - segregated flow of a dispersion and
"free" phase. Bubbly interface. Dispersion volume
less than half the total pipe volume.
Example: oil-in-water dispersion with a "free" oil
phase
D
Mixed - same as the above coding but with the
dispersion occupying more than half the total pipe
volume
.
Ex
a
m
ple
:
oil
Flow Direction
inwa
ter
dis
pe
rsi
on
wi
th
a
"f
re
e"
oil
ph
as
e
Figure 1.1 (a) Description of Flow Pattern
Classifications for Oil-Water Flows (Oglesby, 1979
)
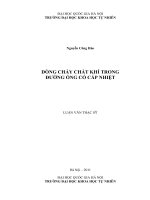
Oil Dominant Water Dontinnni
Annular of concentric - core of one phase wiithin the other phase
G
Example: water core in an oil layer
Slug - phases alternately occupying the pipe volume as a free phase or as a dispersion
Semi-dispersed - some vertical gradient of fluid concentrations in the mixture.
I
M
Fully dispersed Homogeneous flow.
Figure 1.1 (b) Description of Flow Pattern Classifications for Oil-Water Flows (Oglesby, 1979)
F
N
19
19
Mixture Velocity, m/s
Figure 1.2 Flow Pattern Map for Two-Phase, Oil-Water Flows (Oglesby, 1979)
further increase in velocity the flow pattern is homogeneous. In semi-dispersed flow a steep
concentration gradient is observed and in homogeneous flow the gradient is vertical.
The various factors affecting the flow pattern and oil-water distribution across the
pipe cross section are the input mixture velocity, the viscosity of the oil, the input water
percentage and the pipe inclination. Limited studies on oil-water flows in inclined pipes
have always been carried out in the past. Current trend in oil production is characterized by
deep waters, smaller oil fields with thin oil layers, increased free water production and
development of horizontal and branched wells to easily penetrate larger areas of the
reservoir. In oil production from horizontal and deviated wells flow through inclined pipes
is common (Figure 1.3). Deep water production would involve transportation of oil-water
mixtures from the well head to a central gathering station or to a platform. The terrain is
not flat and flow through inclined pipes are encountered. Oil-water mixtures may
sometimes be transported through hilly terrain as well Inclination may lead to more mixing
of the oil-water mixture and flow patterns, phase distributions and pressure drop will be
affected.
The literature survey conducted found studies in liquid-liquid flow generally lacking in depth
and especially with regards to effects of pipe inclination. The presence of gravity driven
buoyancy forces may lead to large slippage between the oil and water layers leading to an
increased holdup of water in the pipes. Failure to account for slippage could lead to
improperly designed separators. Further, back flows within the water layer could also be
present challenging production logging measurements. Production logging tools provide an
accurate measurement of density, velocity and hold up at the point of measurement.
However, extrapolation to entire pipe cross-section could result in inaccurate measurements
So it wa
sProcessing Platform
Figure 1.3 Schematic of a subsea processing facility
00
00
00
00
24
24
deemed essential that this study of two phase liquid-liquid flow should undertake an
examination of liquid-liquid flow fundamentals with primary emphasis on flow regime and
holdup evaluation at various pipe inclinations.
Flow patterns are to be defined through visual observation. An important objective
is to study the variation of holdup across the cross-section along the vertical diameter
Holdup (of water) is defined as the ratio of the volume of water to the total volume of the
liquid at the point of examination. In stratified flow, holdup is the fraction of the cross
section area occupied by water and hence is a measure of the in situ velocities of the two
fluids
Modeling in oil-water flows currently relies on simple homogeneous liquid
mixtures for design calculation. Correlations have also been proposed in the past to predict
pressure drop and holdup based on experimental results obtained using oils of different
viscosities. Two phase gas-liquid flows have been successfully analyzed using mass and
momentum balance equations. Similar approaches to describe liquid-liquid flow have been
carried out only to a limited extent. The final objective is to develop a mechanistic model to
predict the holdup, pressure drop and in situ velocities of the different phases in stratified,
semi- stratified, and semi-mixed flow regimes in horizontal and inclined pipes.
The current study would help understand the effect of various parameters on phase
distribution and hence help in the choice of corrosion inhibitors to be used when seawater
25
25
is present as the second phase. Further, prediction of corrosion rates in oil-water flows
requires knowledge of the in situ velocity of the water layer to predict mass transfer
coefficient. The mechanistic model developed serves this purpose.
CHAPTER 2
LITERATURE REVIEW
In spite of their clear practical relevance comparably few basic studies have been
devoted to oil-water flows in inclined pipes. Most studies deal with small diameter
horizontal or vertical pipes carrying mixtures of water and oils of various viscosities,
together with the transport of oil-in-water emulsions.
2.1 Two phase horizontal flow
Russel et al.(1959) studied oil-water flow in a transparent horizontal pipeline, using
white mineral oil with a viscosity of 18 cp at 77° F. They found three distinct flow patterns:
bubble flow, stratified, and mixed.
Charles et al.(1961) defined four flow patterns in their equal density oil/water flow
in
2.5 cm pipes: water droplets in oil, concentric water with oil flowing in the core, oil
slugs in water, and oil bubble in water. Three different oils ( viscosity 6.29, 16.8 and
65 cp) were used in their studies. They found that the resulting oil-water flow