The impact of macroeconomic factors on conditional stock market volatility in vietnam
Bạn đang xem bản rút gọn của tài liệu. Xem và tải ngay bản đầy đủ của tài liệu tại đây (1.16 MB, 60 trang )
1
MINISTRY OF EDUCATION AND TRAINING
UNIVERSITY OF ECONOMICS HOCHIMINH CITY
--- oOo ---
NGUYỄN THÚY VÂN
THE IMPACT OF MACROECONOMIC FACTORS ON
CONDITIONAL STOCK MARKET VOLATILITY
IN VIETNAM
MAJOR: BANKING AND FINANCE
MAJOR CODE: 60.31.12
MASTER THESIS
INSTRUCTOR: Doctor TRƯƠNG QUANG THÔNG
Ho Chi Minh City – 2011
2
ACKNOWLEDGEMENT
Firstly, I would like to express my sincerest gratitude to my supervisor, Dr.
Truong Quang Thong for his valuable guidance and helpful comments during the
course of my study.
I also would like to thank all of my lecturers at Faculty of Banking and
Finance, University of Economics Hochiminh City for their English program,
knowledge and teaching during my master course at school.
I would like to specially express my thanks to my classmates, my friends for
their support and encouragement.
Special thanks should go to my family for their love and support during my
life.
3
ABSTRACT
The study looks at the relationship between macroeconomic factors and and
stock market, and determined whether inflation, movements in exchange rate,
interst rate have an effect on stock market return volatility in Vietnam. The
Generalised Autoregressive Conditional Heteroskedascity (GARCH) models are
used in establishing the relationship between these variables and stock market
volatility. The results confirms presence of GARCH (1,1) effect on stock return time
series of Vietnam stock market. It is also found that there is strong and positive
relationship between inflation and stock market return volatility. It means that an
increase in inflation leads to an increase in stock market return volatility in the long
run. However, there is no enough proof to conclude that change in interest rate and
exchange rate can influence market return volatility.
Keywords: volatility, leverage, interest rate, inflation, exchange rate,
returns, Hochiminh Stock Exchange
i
Table of contents
CHAPTER 1 Introduction ................................................................................1
1.1 Introduction .........................................................................................1
1.2 Research problem ................................................................................2
1.3 Research objectives .............................................................................3
1.4 Research methodology and scope .......................................................3
1.5 Structure Of The Study........................................................................4
CHAPTER 2 Literature review ........................................................................6
2.1 Introduction .........................................................................................6
2.2 ARCH and GARCH model .................................................................6
2.2.1 Autoregressive Conditional Heteroskedasticity (ARCH) ............7
2.2.2 Generalized
(GARCH)
Autoregressive
Conditional
Heteroskedasticity
8
2.3 The impact of macroeconomic variables on stock market volatility ...8
2.3.1 Inflation.......................................................................................10
2.3.2 Interest rate .................................................................................11
2.3.3 Exchange rate .............................................................................13
2.4 Application of Garch model in Vietnam ...........................................14
2.5 Conclusion .........................................................................................15
CHAPTER 3 Research Methodology ............................................................16
3.1 Introduction .......................................................................................16
3.2 Research data and construction of variables: ....................................16
3.2.1 Research data ..............................................................................16
ii
3.2.2 Construction of variables for the models: ..................................23
3.3 DF unit root test:................................................................................25
3.4 Hypotheses and empirical models .....................................................26
3.4.1 Model 1: The standard GARCH (1,1) model .............................26
3.4.2 Applying GARCH (1,1) models to find out the impact of
macroeconomic variables on stock return volatility .........................................27
3.5 Conclusion .........................................................................................28
CHAPTER 4 Empirical Results of the Research ...........................................29
4.1 Introduction .......................................................................................29
4.2 Descriptive statistics ..........................................................................29
4.3 DF unit root test .................................................................................30
4.4 Correlation Matrix of the variables ...................................................30
4.5 Emprical result of model ...................................................................31
4.5.1 Model 1: Standard GARCH (1,1) ...............................................31
4.5.2 Model 2 .......................................................................................32
4.5.3 Model 3 .......................................................................................34
4.5.4 Model 4 .......................................................................................35
4.5.5 Model 5 .......................................................................................37
CHAPTER 5 Conclusions, Limitations and recommendations .....................39
5.1 Introduction ..........................................................................................39
5.2 Conclusions and Implications ..............................................................39
5.3 Limitations and recommendations: ......................................................40
REFERENCES ...............................................................................................42
APPENDIX ....................................................................................................45
iii
1.
Descriptive Statistics of variables .....................................................45
2.
Monthly CPI from 2000 – 2010 (Source: GSO) ...............................47
3.
Unit root test .....................................................................................48
4.
Data....................................................................................................50
Figures
Figure 3.1 The performance of VN-Index from 07/2000 – 12/2010 .............17
Figure 3.2 Inflation in Vietnam and selected countries 2000 - 2009 .............19
Figure 3.3 Vietnam‟s nominal exchange rate (VND/USD) and inflation rate
1992-2010..................................................................................................................20
Tables
Table 3.1 Vietnam exchange rate arrangement 2000 - 2010 .........................22
Table 4.1 Descriptive statistics of variables (07/2000 – 12/2010) ................29
Table 4.2 ADF UNIT ROOT TEST ..............................................................30
Table 4.3 Correlation Matrix of the variables ................................................31
Table 4.4 Result of model 1 ...........................................................................31
Table 4.5 Result of model 2 ...........................................................................33
Table 4.6 Result of model 3 ...........................................................................34
Table 4.7 Result of model 4 ...........................................................................36
Table 4.8 Result of model 5 ...........................................................................37
iv
Glossary
CPI: consumer price index
SBV: State Bank of Vietnam
GARCH: Generalized AutoRegressive Conditional Heteroskedasticity
ARCH: Autoregressive Conditional Hetroskedasticity
GDP: Gross Domestic Product
HOSE: Hochiminh Stock Exchange
1
CHAPTER 1
Introduction
1.1 Introduction
Stock return volatility refers to the variation in stock price changes during a
period of time. Normally investors and agents perceive this variation as a measure of
risk. The policy makers use estimate of volatility as a tool to measure the vulnerability
of the stock market. Since understanding the nature of stock market volatility gives
important implications for policy makers and investors, movements in stock prices
volatility have been the central variable of many researches. There have been numerous
of studies trying to answer an interesting question: what are the factors that derive
stock market volatility.
Researchers have analyzed the relative importance of economy-wide factors,
industry-specific factors, and firm-specific factors stock volatility. One of the earliest
studies was of Officer (1973) which related changes in stock market volatility to
changes in real economic variables. He noted that variability in stock prices was
unusually high during the period of great depression i. e. 1929-1939 compared with
pre-and post-depression periods. Schwert (1989) was a classic study which intended to
verify Officer‟s (1973) findings and explored the relationship between stock prices
volatility and macroeconomic variables. This issue has been studied by numerous
researches and their findings are not the same. Many papers of Engle and Rangel
(2005), Campbell (1987) and Shanken (1990)…confirmed that macroeconomic factors
had significant effect on stock market volatility. Contrary to this, Davis and Kutan
(2003), Schwert (1989) evidenced that macroeconomic variables had weak predictive
power for explaining variability of stock market prices and returns volatility. Inconsistent
2
results depend on different characteristics of every countries as well as different time
periods.
Since ARCH model was proposed by Engle (1982) and generalized by
Bollerslev (1986) and Taylor (1986), the models have been proved to be sufficient in
capturing properties of time varying stock return volatility. Literatures have found
evidence in support the capability of GARCH models in volatility estimation as well as
volatility forecast.
Vietnam stock market was newly established in 2000 in Ho Chi Minh City on
28 July 2000 (Hochiminh Stock Exchange – HOSE). In the first trading session there
were only two stocks with a total market capitalization of 270 billion VND. Although
the market has significantly grown over ten years of operation (until at the end of
2010), it is still rather small and incomplete in comparison to other stock markets in the
Asian region. Moreover, interest rate, inflation, exchange rate and stock market are hot
subjects attracting attention of the government, investors and corporations in recent
years. Relationship among these macroeconomic variables as well as their effect on
stock market has been discussed every day. In fact, in Vietnam, do inflation, interest
rate and exchange rate impact on stock market? Can we measure this impact?
1.2 Research problem
Research and practice have proved the important role of macroeconomic
variables on the economy. Stock market volatility is known as one of the most
important phenomena that determine the amount of risk faced by investors. The impact
of macroeconomic factors on stock market including market volatility is a major
question to be posed and tested in many countries around the world. However, as far as
the author is concerned, in Vietnam there were not many researches exploring this
issue. In addition, unlike the stock market in the developed countries, Vietnam's stock
market is not really operating under the law of supply and demand but it is influenced
3
by herb behavior and "crowd effect". Therefore, no one can confidently confirm that
changes in macroeconomic factors impact to the entire stock market. Moreover,
inflation, exchange rate, interest rate and stock market are hot topics in recent years.
As the importance of volatility as a proxy of risk, the advantages of GARCH
family and Vietnam stock market‟s particular situation mentioned above, the paper
chooses to study the impact of inflation, exchange rate and interest rate to stock market
volatility by applying GARCH models. My study will try to answer the following
questions: What macroeconomic determinants of stock market volatility in Vietnam
are? And how they specifically affect the stock market?
1.3 Research objectives
The main purpose of this study is to identify factors that impact stock market
conditional volatility using the data from Hochiminh Stock Exchange.
The present study contributes to the literature in three ways.
Firstly, the present study will shed some light on the depth of the stock market
activities especially in emerging market in addition to identifying and relating the
changes in economic factors to the changes in stock market movements. It is necessary
to have more and more researches about Vietnam stock market so that we can
understand and develop our immature stock market.
Secondly, the findings of this investigation should enable the investors to know
about stock market volatility as a measure of risk and make their decision.
Finally, the study will help the policy makers in seeing the effect of their policy
to stock market and choosing in which way they should adjust their policy.
1.4 Research methodology and scope
To achieve the above mentioned objectives, the author employs quantitative
research by using data of Hochiminh Stock Exchange Index (VNIndex), inflation,
4
exchange rate and interest rate from period August 2000 to December 2010. The
analysis includes the following steps:
Descriptive statistics
Using DF unit root test to test stationary of time series data
Using
standard
Generalized
AutoRegressive
Conditional
Heteroskedasticity (GARCH) models as proposed by Bollerslev (1986)
and Nelson (1991) to capture the time varying volatility of stock market
returns in Vietnam.
Applying GARCH model with additional dependent variables as
inflation, exchange rate and interest rate to find out whether these
variables effect stock market returns in Vietnam or not.
Eviews software version 6 is used as data analysis tool.
1.5 Structure Of The Study
This study including five chapters is organized as follows:
CHAPTER 1: Introduction
This chapter introduces research background of the study, research problems,
research objectives, research methodology and scope.
CHAPTER 2: Literature Review
In this chapter, I review the relevant literatures and present the fundamental
ideas on effect of macroeconomic variables on stock volatility as well as Garch model.
CHAPTER 3: Research Methodology
After determining the research objectives and scope, research methodology
concerned in chapter 1 and referring important previous literatures in chapter 2, this
5
chapter particularly outlines the research methodology, data and builds empirical
models.
CHAPTER 4: Empirical Results of the Research
Chapter 4 presents the empirical results, discusses the implications of the
findings
CHAPTER 5: Conclusions, Limitations and Recommendations
In this chapter, I present conclusions and recommendations based on the results
of the previous chapters. The limitations of the research and recommendations for
future researches are also given.
6
CHAPTER 2
Literature review
2.1 Introduction
This chapter will review previous researches that related to GARCH model, the
impact of macroeconomic variables on stock market volatility. Among macroeconomic
factors, I will focus on three factors supposed by many studies, namely inflation,
interest rate and exchange rate. In addition, literatures that evidenced GARCH effect in
Vietnam stock market are also provided.
2.2 ARCH and GARCH model
Stock return volatility refers to the variation in stock price changes during a
period of time. Investors and agents perceive this variation as a measure of risk.
According to Pindyk (1984), an unexpected increase in volatility today leads to the
upward revision of future expected volatility and risk premium which further leads to
discounting of future expected cash flows (assuming cash flows remain the same) at an
increased rate which results in lower stock prices or negative returns today. Stock
return volatility, therefore, refers to variations in stock price changes during a period of
time.
To
forecast
the
conditional
variances,
Autoregressive
Conditional
Hetroskedasticity (ARCH) model was introduced by Engle (1982) and generalized as
GARCH (Generalized ARCH) by Bollerslev (1986) and Taylor (1986). From this
model, Nonlinear Asymmetric GARCH(1,1) (NGARCH) by Engle and Ng (1993),
Integrated Generalized Autoregressive Conditional Heteroskedasticity (IGARCH) by
Nelson (1991), Quadratic GARCH (QGARCH) model by Sentana (1995), The
Threshold GARCH (TGARCH) model by Zakoian (1994)… were developed.
7
2.2.1 Autoregressive Conditional Heteroskedasticity (ARCH)
In the analyses of macroeconomic data, Engle (1982) found evidence that for
some kinds of data, the disturbance variances in time-series models were less stable
than usually assumed. For instance, the uncertainty of stock market returns, which are
measured using variance and covariance, changes over time. Thus, we should pay more
attention to the heteroskedasticity when performing the time series analysis. For this
problem, it is necessary to specify the variance dynamics (volatility). Engle (1982)
suggested the ARCH (autoregressive conditional heteroskedasticity) model as an
alternative to the standard time series treatments. It is well known that a period of high
volatility continues for a while after a period of increased volatility, a phenomenon
called volatility clustering. The ARCH model takes the high persistence of volatility
into consideration and so has become one of the most common tools for characterizing
changing variance and volatility. The ARCH (q) model formulates volatility as
follows:
∑
Where:
Error term at time t
Conditional variance for the current time t
News about volatility from the previous period, measured as the lags of the
squared residual
The time varying volatility is captured by allowing volatility to depend on the
lagged values of the innovation terms
and and q is chosen such that the residuals of
8
the variance equation are white noise. All of the coefficients in the conditional variance
equation are required to be non-negative.
2.2.2 Generalized
Autoregressive
Conditional
Heteroskedasticity
(GARCH)
The ARCH model is simple; the problem of parsimony among the other problems of
ARCH model such as how to specify the value of p and the violation of non-negativity
constraints led Bollerslev (1986) to extend the ARCH model into the generalized
ARCH (GARCH) model. The virtue of this approach is that a GARCH model with a
small number of terms appears to perform as well as or better than an ARCH model
with many terms. The equation for GARCH (p,q) is as follows:
∑
∑
Where:
: Error term at time t
: Conditional variance for the current time t
: News about volatility from the previous period, measured as the lags of
the squared residual from equation
2.3 The impact of macroeconomic variables on stock market volatility
The effects of economic forces in a theoretical framework were based on the
Arbitrage Pricing Theory (APT) developed by Ross (1976). The APT essentially seeks
to measure the risk premia attached to various factors that influence the returns on
assets, whether they are significant, and whether they are “priced” into stock market
9
returns. Accordingly, Chen, Roll and Ross (1986), having first illustrated that
economic forces affect discount rates, the ability of firms to generate cash flows, and
future dividend payouts, provided the basis for the belief that a long-term equilibrium
existed between stock prices and macroeconomic variables. Therefore, the dividend
discount model (DDM), capital asset pricing model (CAPM) and arbitrage pricing
theory (APT) provide important theoretical frameworks which show the conduits
through which macroeconomic variables are factored into stock prices. These models
predict that any anticipated or unanticipated arrival of new information about GDP,
production, inflation, interest rates, and exchange rates, etc., will alter stock prices
through the impact on expected dividends or cash flows, the discount rate or both.
As above mentioned, to forecast the conditional variances, Autoregressive
Conditional Hetroskedasticity (ARCH), GARCH (Generalized ARCH), Nonlinear
Asymmetric GARCH(1,1) (NGARCH) Integrated Generalized Autoregressive
Conditional Heteroskedasticity (IGARCH) Quadratic GARCH (QGARCH), The
Threshold GARCH (TGARCH) model … were developed. Numerous studies have
been conducted using these models to find out the relationship between
macroeconomic variables and stock market volatility. However, there are contradicting
results regarding the impact of the health of economy on the stock exchange volatility
and hence the amount of risk that inflation and other indicators might cause for the
investors.
Schwert (1989) tested the relationship between stock market volatility and a
number of macroeconomic variables, including real and nominal economic volatility,
financial leverage, and stock trading, covering the period from 1857 to 1987 for the
U.S. economy. However, he found that macroeconomic variables have week predictive
power for explaining variability of stock market prices and returns volatility. Davis and
Kutan (2003) confirmed the findings of Schwert (1989) that inflation and other
10
indicators are week predictors of the conditional stock exchange volatility in the
emerging markets.
Contrary to this, Engle and Rangel (2005) analyzed changes in unconditional
volatility across 50 financial markets for 50 year‟s daily data and found that inflation,
GDP growth, and short term interest rate have great positive impact on the
unconditional stock exchange volatility. Rizwan and Khan (2007) also examined role
of macroeconomic variables and global factors on the volatility of the stock returns in
Pakistan. They analyzed Pakistan‟s equity market as a consequence of interest rate,
exchange
rate,
industrial
production,
and
money
supply
being
domestic
macroeconomic variables and 6-month LIBOR and Morgan Stanley Capital
International (MSCI) All Countries World Index as global variables. After applying
EGARCH and VAR models they collectively explained varying importance of
domestic macroeconomic variables in explaining the relationship between stock returns
and volatility in Karachi Stock Exchange and did not discussed contribution of each
variable separately.
Among a lot of macroeconomic variables, because of time limit, the author will
focus on three variables, they are: inflation, exchange rate and interest rate.
2.3.1 Inflation
Relationship of inflation and stock return has been widely examined by
researchers. The findings of Schwert (1989) and Davis and Kutan (2003) confirmed
that inflation was weak predictor of the conditional stock exchange volatility in the
emerging markets. However, Engle and Rangel (2005) found that inflation has high
predictive power for the emerging markets than it had for the developed nations like
Canada. Saryal (2007) employed GARCH model for the estimation of conditional
stock market volatility using monthly data for Turkey from January 1986 to September
2005 and for Canada from January 1961 to December 2005. She estimated impact of
11
inflation on stock market volatility and found that inflation rate had the high predictive
power for explaining stock market volatility in Turkey. However, in Canada it was
weaker though still significant.
In Vietnam, Nguyen Thi Thu Hien and Dinh Thi Hong Loan (2007) investigated
the effect of inflation on stock market by using OLS regression with data of VN-Index
and each industry sectors. The results of research showed that inflation was a systemic
risk factor which impacted on the overall stock market. Inflation significantly negative
effected on stock return. This also implied that investment in stock market was not an
inflation shield.
2.3.2 Interest rate
To investors, an increase in interest rate will induce investors to keep their
money saving bank accounts rather than investing in the stock market. Moreover,
substantial amount of stocks are purchased with borrowed money, hence an increase in
interest rates would make stock transactions more costly. Investors will require a
higher rate of return before investing. This will reduce demand of stock and the stock
markets go down. To companies, most companies finance their capital equipments and
inventories through borrowings. Therefore, high interest rate will make cost of capital
and bankruptcy probability increase, especially for companies that have high leverage.
This leads to a decrease in profit of firms and an increase in risk. Mishkin (1977)
proved that lower interest rates increase stock prices which in turn reduce the
probability of financial distress.
Available literature in finance discusses the relationship between interest rates
and stock returns in different ways. Relating short term interest rates with stock returns
and market volatility, Bren‟ et al. (1989) provided evidence that one-month interest
rate is helpful in predicting the sign and the variance of the excess return on stocks.
Campbell (1987) and Shanken (1990) found that nominal one-month T-bill yield has a
12
significantly positive relation with market variance but negatively correlated with
future stock returns. Whitelaw (1994) also reported a positive relationship between
market volatility and the one-month T-bill yield.
Research results of Engle (2004) suggested that along with the long term
volatility of other macroeconomic variables, volatility of interest rates is also a
primary cause of unconditional market volatility. Rigobon and Sack (2004) empirical
results showed that increase in the short-term interest rate negatively impact the stock
prices, with the largest effect on the NASDAQ index. Léon, N. K. ( 2008) investigated
this relationship using the Korean Stock Price Index 200 (KOSPI 200) and weekly
negotiable deposit. The results indicated that interest rates have a strong predictive
power for stock return but weak impact on volatility .These results were supported by
Zafar (2008) who did a similar research based on Karachi Stock Exchange monthly
returns and concluded that there exist significant and negative relationship between
interest rate and market return and negative but insignificant relationship between
interest rate and variance.
Vardar‟et al (2008) examined the impact of interest rate and exchange rate
changes on the sector and composite return and volatility in Istanbul Stock Exchange.
Although he found market volatility more responsive to changes in exchange rates,
conditional volatility significantly relates to the interest rates in all indices except for
service and industrial sector. As per his conclusion, changes in interest rates have an
increasing impact on volatility of technology sector and a decreasing impact on
financial and composite indices volatility.
In Vietnam, Hussainey and Le (2009) used monthly time series data in the period
January 2001 to April 2008 to examine the impact of macroeconomic indicators on
Vietnamese stock prices. They found that industrial production has a positive effect on
13
Vietnamese stock prices. However, they confirmed that long term and short term
interest rates did not affect stock prices.
2.3.3 Exchange rate
Basically, foreign exchange rate volatility influences the value of the firm since
the future cash flows of the firm in line with the fluctuations in the foreign exchange
rates. Currency appreciation has both a negative and a positive effect on the domestic
stock market for an export-dominant and an import-dominated country, respectively
(Ma and Kao, 1990). In another way, companies that borrow in foreign currency will
face with exchange rate risk. Investors will consider this characteristic to evaluate stock
price.
It was MaysamiKoh (2000) and Choi et al. (1992), who examined the impacts of
the interest rate and exchange rate on the stock returns and showed that the exchange
rate and interest rate are the determinants in the stock prices. Aggarwal (1981) used
monthly data for the floating rate period from 1974 to 1978 to infer significant positive
correlation between the US dollar and US stock prices whereas in 1988, Soenen and
Hennigan derived a significant negative relationship. In 1992, Oskooe and Sohrabian
used Cointegration test for the first time and concluded bidirectional causality but no
long term relationship between the two variables. Najang and Seifert (1992) employed
GARCH framework for daily data from the U.S, Canada, the UK, Germany and Japan,
showed that absolute differences in stock returns have positive effects on exchange rate
volatility. However, Ibrahim and Aziz analyzed dynamic linkages between the
variables for Malaysia, using monthly data over the period 1977-1998 and their results
showed that exchange rate is negatively associated with the stock prices.
Erbaykal and Okuyan studied 13 developing economies, using different time
periods and indicated causality relations for eight economies-unidirectional from stock
price to exchange rates in the five of them and bidirectional for the remaining three.
14
Adjasi, C. (2008) carried out a research on the Ghana Stock Exchange. The
results indicated a negative relationship between exchange rate volatility and
conditional stock returns. In another study carried by Subair, K., & Salihu in the
Nigerian Stock Market, they found a negative relation between exchange rate
fluctuations and the Nigerian stock market returns.
2.4 Application of Garch model in Vietnam
Vuong Quan Hoang (2002) tested the GARCH (1,1) effect in the daily stock
returns series with Vietnam‟s market price index (VNI) and the first four listed
individual stocks: REE, SAM, HAP and TMS from July 28, 2000 to August 22, 2002.
He found GARCH (1,1) effect present on four out of five series tested, except for HAP
and concluded that there was presence of GARCH (1,1) effect stock return time series
of Vietnam‟s newborn stock market.
A. Farber, Nguyen V.H. and Vuong Q.H. (2006) analyzed policy impact
including daily price limit, technical and rule changes on Vietnam stock market. By
applying Garch (1,1) model, they found that the market had in general been sensitive to
some type of decisions made by the authorities. The ultimate impacts of the decisions
made by these agencies were always unpredictable. For instance, „good news‟ in the
view of the general market only shows positive impact on daily returns of the index
while significantly negative to returns of SAM stock. In another instance, general
market bad news, recently caused by new-listed stocks, renders the conditional
variance portion of veterans significantly lower, by the minus signs found in the
variance equations of the fittings.
Manh Tuyen Tran (2009) explored the relevance of GARCH models in
explaining stock return dynamics and volatility on the Vietnamese stock market in the
period from 1/2009 to 10/2009. He showed that standard GARCH (1,0) model
provided the best description of return dynamics. There existed only Bull effect, one
15
characteristic of the emerging market. However, they could not find Friday, and low
transaction effects on Vietnamese stock market.
2.5 Conclusion
Finding out the impact of macroeconomic variables on stock market volatility
by applying GARCH model is the target of numerous studies in many countries.
However the results are not consistent. The previous researches evidenced that there
was presence of GARCH (1,1) effect on stock return time series of Vietnam. The
impact of some policies such as daily price limit, technical and rule change were also
examined but to the author‟s knowledge, there was rarely previous researches
investigating the effect of exchange rate, inflation and interest rate on conditional stock
market volatility in Vietnam. Filling this gap is the main objective of this work.
16
CHAPTER 3
Research Methodology
3.1 Introduction
After determining the research objectives and research methodology concerned
in chapter 1 and reviewing related previous literatures in chapter 2, chapter 3
particularly presents details of research data and overview of stock market, inflation,
interest rate and exchange rate in Vietnam in recent years and construction of
variables. After that, I will present hypotheses and empirical models.
3.2 Research data and construction of variables:
3.2.1 Research data
The time period of this study is from August 2000 to December 2010, data is
taken at the end of each month in research period. The data frequency selected was
monthly to ensure an adequate number of observations. An observation lower than
this (yearly) is not providing enough observations of which a reliable conclusion can
be drawn from. We cannot select daily data because there is no CPI data every day.
The stock market indices of the Hochiminh stock market were downloaded from
their official website . The data on consumer price index (CPI) have
been obtained from Vietnam General Statistic Office. Official exchange rate, three
month deposit interest rate was taken from International Financial Statistics (IFS)
published by International Monetary Fund (IMF).
Let‟s first consider characteristics of Vietnam stock market and macroeconomic
variables in this period:
17
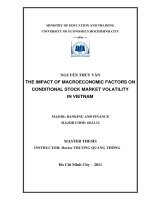
3.2.1.1 The Vn-Index And The Performance Of Vietnam Stock Exchange:
The performance of VN-Index from 07/2000 - 12/2010
1200
1000
800
600
400
200
2010
2010
2009
2009
2008
2008
2007
2007
2006
2006
2005
2005
2004
2004
2003
2003
2002
2002
2001
2001
2000
0
Year
Figure 3.1 The performance of VN-Index from 07/2000 – 12/2010
(Source: )
-
Period 2000 - 2005:
The Vietnam's stock market was marked by the introduction of Trading Center
Ho Chi Minh City Securities on July 20th 2000 and implemented the first trading
session on July 28th 2000. At that time, only two companies listed (stock codes: REE
and SAM) with a capital of 270 billion VND. In the first five years, the market did not
seem to really attract the attention of investors. Except for 2001, when VNIndex went
up 571.04 points in the first six months and down to 200 points (70% value was lost) in
October 2001, market indices did not change much in this period. However, in 2005,
growth rate of stock market increased twice. According to the State Securities
Commission, by the end of 2005, market capitalization reached nearly 40,000 billion
VND, accounting for 0.69% of total Gross Domestic Product (GDP).
18
-
2006:
Continuing the increasing trend, stock market has a impressive growth in 2006
with growth rates reaching 60% from early to mid-2006. VN-Index increased 144% in
2006.
Total market capitalization reached USD 13.8 billion in December, 2006,
accounting for 22.7% of GDP. Foreign investors hold approximately USD 4 billion,
accounting for 16.4% of the overall market capitalization. In particular, the number of
new investors entered the market more crowded, at the end of December in 2006, with
over 120,000 trading accounts were opened. However, in this period, many investors
invested in stock market according to crowd effect and lacking of investment
knowledge.
-
2007:
Securities Law took effect from January 1st 2007 has contributed to market
development and enhanced integration into international financial markets.
Firstly, the booming market in three months in 2007. The market growth rate
achieved the largest increase of 126% in just three months trading. The market reached
the peak at 1,170.67 points in March 2007. Because of “bubble market" fear, the
government gave policies to reduce the heat of stock market. Responding to this, the
stock market has adjusted remarkably in period from April 2007 to September 2007.
-
2008 -2010:
In 2008, market sharply went down due to effect of financial crisis and inflation
control policy. Starting the year at 921.07 points, VN-Index has lost nearly 60% in
value and become one of the deepest markets fell around the world in the first half of
2008. At the end of December, 2008, stock market index declined by 70 percent in