Ebook Financial markets and institutions (5E) Part 2
Bạn đang xem bản rút gọn của tài liệu. Xem và tải ngay bản đầy đủ của tài liệu tại đây (5.83 MB, 232 trang )
FINM_C07.qxd
1/18/07
11:33 AM
Page 201
www.downloadslide.com
CHAPTER
7
Interest rates
Objectives
What you will learn in this chapter:
l
The relationship between nominal and real rates of interest
l
The loanable funds theory of real interest rates and its adaptation to deal with
nominal interest rates
l
The liquidity preference theory of interest rates and how it relates to the loanable
funds approach
l
How the monetary authorities strongly influence the general level of interest rates
in the economy
l
The meaning of the term structure of interest rates and the various theories used
to explain the term structure
We have seen many times that an interest rate is one form of yield on financial
instruments – that is, it is a rate of return paid by a borrower of funds to a lender of
them. We can also think of an interest rate as a price paid by a borrower for a service,
the right to make use of funds for a specified period. We shall here be looking at
two questions:
(a) What determines the average rate of interest in an economy? and
(b) Why do interest rates differ on loans of different types and different lengths –
that is, what factors influence the structure of interest rates in an economy?
Of course, interest rates also vary depending on whether you are borrowing or
lending. For example, there is a spread between the interest rate at which banks are
prepared to lend (the offer rate) and the rate they are willing to pay to attract deposits
(the bid rate). There is also a spread between selling and buying rates in international
money markets. For example, the Financial Times of 25 May 2006 quoted the interest
rate on short-term sterling in international currency markets as 45/8 per cent (the
offer rate) to 41/2 per cent (the bid rate). If we wish to quote a single interest rate in
such a case, we can specify that we are referring to the offer rate or the bid rate – as
in the distinction between LIBOR (the London Interbank Offered Rate) and LIBID
201
..
FINM_C07.qxd
1/18/07
11:33 AM
Page 202
www.downloadslide.com
Chapter 7 • Interest rates
(the London Interbank Bid Rate). Alternatively, we can take the mid-point between
the offer and bid rates. Where the Financial Times reports a single market interest rate
it gives the mid-point between the Offer and Bid rates. In our example above, the
mid-point is 49/16 (4.56) per cent.
This spread between offer and bid rates covers the administrative costs of the
financial intermediaries and provides profit for them. The spread is itself subject
to change and is likely to be smaller the greater the degree of competition among
financial institutions. In the UK interest rates example above, the spread is small
(1/8 per cent) because there is considerable competition in short-term international
money markets. The spread between the rates at which banks borrow and lend to
their retail customers is generally a good deal greater. This spread also reflects the
degree of default risk that lenders feel they are facing in making loans since the
lending rate (offer rate) will always include a risk premium.
Risk premium: An addition to the interest rate demanded by a lender to take into
account the risk that the borrower might default on the loan entirely or may not repay
on time (default risk).
In this chapter, we look first at another important distinction in the expression
of interest rates – that between nominal and real rates of interest. We then go on
to consider the principal theories of the determination of the interest rate in an
economy. We begin with the well-established loanable funds theory of interest rates.
We later introduce Keynes’s liquidity preference theory, comparing and contrasting
this with the loanable funds approach. The second half of the chapter investigates
the structure of interest rates, notably the term structure and the yield curve, which
illustrates the term structure. The chapter concludes with an examination of theories
seeking to explain the different possible shapes of the yield curve.
The interest rate structure: Describes the relationships between the various rates of
interest payable in an economy on loans of different lengths (terms) or of different
degrees of risk.
7.1 The rate of interest
Economists talk about the rate of interest. This assumes that there is some particular
interest rate that can be taken as representative of all interest rates in an economy.
The rate chosen as the representative rate will vary depending on the question being
considered. Sometimes, for example, the discount rate on treasury bills will be taken
as representative. At other times the rate of interest on new local authority debt,
the base interest rate of the retail banks, or a short-term money market rate such as
LIBOR might be used. No matter which rate is chosen, it is implied that the interest
rate structure is stable and that all interest rates in the economy are likely to move
in the same direction. If this is true, we should be able to explain what determines
202
..
..
FINM_C07.qxd
1/18/07
11:33 AM
Page 203
www.downloadslide.com
7.1 The rate of interest
interest rates in general. Before going on to look at this question, however, we need
to distinguish between nominal and real interest rates.
The rates of interest quoted by financial institutions are nominal rates, allowing
calculation of the amounts of money to be received as interest by lenders or paid by
borrowers. This is clearly of immediate interest to borrowers and lenders. However,
it is equally important to them to know how these amounts relate to their existing
or likely future income and to the prices of goods and services. That is, a borrower
wishes to know the opportunity cost of borrowing – how many goods and services
she must forgo in order to pay the interest on a loan.
Consider the position of someone who takes out a £50,000 mortgage on a house
over 25 years at a fixed nominal rate of interest of, say, 6 per cent. Assume further
that the annual gross income of the borrower is £20,000. In the first year of the loan,
interest on the £50,000 debt will amount to £3,000 – 15 per cent of the borrower’s
annual gross income. Assume, however, that the economy is experiencing an annual
rate of inflation of 2.5 per cent and that the borrower’s gross annual income rises in
line with inflation. That is, the real value of the borrower’s income has not changed
– he is able to buy the same quantity of goods and services as before. However, the
loan repayments remain the same in money terms and make up a smaller and smaller
proportion of the borrower’s income. Thus, the real cost of the interest payments
declines over time. Therefore we can speak of the real rate of interest – the rate of
interest adjusted to take into account the rate of inflation.
In this example, the real rate of return to the lender is also falling over time –
the interest received would, in each successive year, buy fewer and fewer goods and
services because of the existence of inflation. It follows that lenders attempt to set
interest rates to take into account the expected rate of inflation over the period of a
loan. If lenders cannot be confident about the real rate of return they are likely to
receive, they will be willing to lend at fixed rates of interest for short periods only.
At the end of the loan period, the borrower might then be able to continue the loan,
requiring it to be ‘rolled over’ at a newly set rate of interest, which can reflect any
changes in the expected rate of inflation. Alternatively, lenders can set a floating rate
of interest that is automatically adjusted in line with changes in the rate of inflation.
Real interest rate: The nominal rate of interest minus the expected rate of inflation.
It is a measure of the anticipated opportunity cost of borrowing in terms of goods and
services forgone.
As we have suggested above, it is the expected rate of inflation over the period
of a loan that is of particular importance, rather than the present rate of inflation.
Consider a simple example. Assume that a bank is willing to make a loan to you of
£1,000 for one year at a real rate of interest of 3 per cent. This means that at the end
of the year the bank expects to receive back £1,030 of purchasing power at current
prices. However, if the bank expects a 10 per cent rate of inflation over the next
twelve months, it will want £1,133 back (10 per cent above £1,030). The interest rate
required to produce this sum would be 13.3 per cent.
203
..
..
FINM_C07.qxd
1/18/07
11:33 AM
Page 204
www.downloadslide.com
Chapter 7 • Interest rates
This can be formalised as follows:
i = (1 + r)(1 + G e) − 1
(7.1)
where i is the nominal rate of interest, r is the real rate of interest and G e is the
expected rate of inflation (both expressed in decimals). In our example above, we
would have
i = (1 + 0.03)(1 + 0.1) − 1
= (1.03)(1.1) − 1
= 1.133 − 1
= 0.133 or 13.3 per cent
For most purposes, we can use the simpler, although less accurate, formula
i = r + Ge
(7.2)
In our example, this would give us 3 per cent plus 10 per cent = 13 per cent.
Expressed the other way around eqn 7.2 becomes
r = i − Ge
(7.3)
If we next assume that r is stable over time, we arrive at what is widely known
as the Fisher effect, after the American economist Irving Fisher. This suggests that
changes in short-term interest rates occur principally because of changes in the
expected rate of inflation. If we go further and assume that expectations held by
market agents about the rate of inflation are broadly correct, the principal reason for
changes in interest rates becomes changes in the current rate of inflation. We could,
in that case, write:
r=i−G
(7.4)
We are implying here that borrowers and lenders think entirely in real terms.
This leaves us to consider the factors that determine real rates of interest. The
central theoretical explanation of real interest rates is known as the loanable funds
theory.
7.2 The loanable funds theory of real interest rates
According to the loanable funds theory, economic agents seek to make the best
use of the resources available to them over their lifetimes. One way of increasing
future real income might be to borrow funds now in order to take advantage of
investment opportunities in the economy. This would work only if the rate of return
available from investment were greater than the cost of borrowing. Thus, borrowers
should not be willing to pay a higher real rate of interest than the real rate of return
available on capital. In a perfect market this is equal to the marginal productivity of
capital – the addition to output that results from a one-unit addition to capital, on
the assumption that nothing else changes. This is influenced by factors such as the
204
..
..
FINM_C07.qxd
1/18/07
11:33 AM
Page 205
www.downloadslide.com
7.2 The loanable funds theory of real interest rates
rate of invention and innovation of new products and processes, improvements in
the quality of the workforce, and the ability to reorganise the economy to make
better use of scarce resources.
Savers, on the other hand, are able to increase their future consumption levels by
forgoing some consumption in the present and lending funds to investors. We start
by assuming that consumers would, other things being equal, prefer to consume all
of their income in the present. They are prepared to save and to lend only if there is
a promise of a real rate of return on their savings that will allow them to consume
more in the future than they would otherwise be able to do. The real rate of return
lenders demand thus depends on how much they feel they lose by postponing part
of their consumption. Thus, the rate of interest is the reward for waiting – that is,
for being willing to delay some of the satisfaction to be obtained from consumption.
The extent to which people are willing to postpone consumption depends upon
their time preference.
Time preference: Describes the extent to which a person is willing to give up the
satisfaction obtained from present consumption in return for increased consumption
in the future.
The term ‘loanable funds’ simply refers to the sums of money offered for lending
and demanded by consumers and investors during a given period. The interest rate
in the model is determined by the interaction between potential borrowers and
potential savers. We need to explain, however, why we might expect the real rate of
interest in a country to remain relatively stable over time as Irving Fisher assumed
it would.
Loanable funds: The funds borrowed and lent in an economy during a specified period
of time – the flow of money from surplus to deficit units in the economy.
The principal demands for loanable funds come from firms undertaking new and
replacement investment, including the building up of stocks, and from consumers
wishing to spend beyond their current disposable income. The current savings of
households (the difference between disposable income and planned current consumption) and the retained profits of firms are the principal sources of supply of
loanable funds.
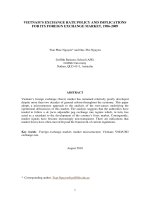
This can all be shown in the conventional way in a supply and demand diagram.
Figure 7.1 follows the usual procedure of putting nominal interest rates on the
vertical axis. However, we assume for the moment that there is no inflation in the
economy and, hence, there is no distinction between nominal and real interest rates.
In Figure 7.1, the supply curve slopes up to the right – as interest rates rise, people
become more willing to save and to lend because doing so offers increasing levels of
future consumption in exchange for the present consumption foregone. That is,
ceteris paribus, current savings increase as interest rates rise. The demand curve slopes
down to the right because it is assumed that additions to capital (net investment),
205
..
..
FINM_C07.qxd
1/18/07
11:33 AM
Page 206
www.downloadslide.com
Chapter 7 • Interest rates
Figure 7.1
with nothing else changing, cause the marginal productivity of capital to fall (there
are diminishing returns to capital). Since firms continue to invest only so long as the
marginal product of capital is above the interest rate paid on loans, the demand for
loanable funds is greater at lower rates of interest. The equilibrium rate of interest
is then given by the intersection of the demand and supply curves.
Interest rates are not likely to change frequently in this model because the underlying influences on the behaviour of borrowers and lenders do not change very
often and hence the savings and investment curves do not shift very often. Savings
at each interest rate are determined by the average degree of time preference in
the economy and by the choices people make over their lifetimes between goods
and leisure (that is, by their willingness to engage in market work). These are not
subject to frequent change. This is true also of investment. It, remember, depends
on the relationship between interest rates and the marginal product of capital. The
productivity of capital, in turn, depends on the quantity and quality of a country’s
factors of production (capital, labour and natural resources). These change but do so,
for the most part, fairly slowly and consistently over time.
We can, thus, easily explain the view that real interest rates in a country should
not be expected to change greatly over time. We can also easily see why real interest
rates might differ from one country to another – differences in time preferences
among populations, in real income levels, or in the quantity or quality of factors of
production. Of course, if capital were perfectly mobile internationally (it moved freely
among countries), differences in real interest rates would not persist since funds would
move from those countries where real interest rates were low to high real interest rate
countries. As this happened, interest rates would come down in the high interest
rate countries and rise in the low interest rate ones. Funds would continue to flow
until real interest rates were the same everywhere. In practice, there are many interferences with the mobility of capital and differences in real interest rates persist.
The biggest differences in real interest rates are likely to be between rich and
poor countries. In poor countries, real incomes and hence domestic savings are low.
206
..
..
FINM_C07.qxd
1/18/07
11:33 AM
Page 207
www.downloadslide.com
7.2 The loanable funds theory of real interest rates
At the same time, the lack of capital in these countries means that the marginal
product of capital is likely to be high. Thus, we have a high demand for capital and
a low supply of domestic savings. Real interest rates are high. The reverse is true for
rich countries.
The differences persist because capital does not flow at all freely from rich to poor
countries. Capital is very mobile internationally only among developed countries.
There are many barriers to the movement of capital to developing countries, particularly to the poorest of them. These include lack of information and the many risks
that investors face. Exchange rate risk is clearly important when we are discussing
the movement of capital from one country to another. This is the risk that the value
of the currency of the country to which capital is being exported will fall, resulting
in a capital loss when the owner of the capital later converts the funds back into his
own currency. It follows that interest rates in countries with currencies thought
likely to lose value over time include an exchange risk premium.
In addition to facing exchange rate risk, an investor may well fear default risk
much more in a foreign country than in his own economy. This may simply reflect
a lack of information about the degree of risk in foreign countries. On the other
hand, default risk may objectively be much higher in developing countries that are
constantly short of foreign currency and have a history of unstable governments.
Firms find it harder to plan under such circumstances and may have to deal with
frequent changes in regulations and taxes as well as rates of exchange.
Default risk refers specifically to the failure of the borrower to repay a loan. Risk may
also arise from the actions of governments. For instance, governments may prevent
firms from taking funds out of the country in foreign exchange. There have also been
many examples of governments declaring a moratorium on the payment of interest
on loans or entering into agreements with creditors to reschedule loans so that they
are paid back over a much longer period than in the original agreement. These
types of risk are referred to as sovereign risk or country risk. Whatever the basis for this
increased risk, it is easy to see why the risk premium might vary from one country
to another. Consequently, real interest rates might vary greatly among countries.
It is even possible that mobile capital moves in the wrong direction – that it
moves to countries where rates of return are low but secure, causing differences in
real interest rates among countries to widen rather than to narrow as capital becomes
more mobile.
7.2.1 Loanable funds and nominal interest rates
Let us next allow for the existence of inflation and the need to distinguish between
nominal and real interest rates. Following the loanable funds approach, we continue to assume that people think in real terms. Now, however, the real value of the
financial assets they hold changes with the rate of inflation. It becomes important
for people to be able to move quickly from one form of asset to another in order to
protect the real value of the assets they hold. To do this, they need to hold part of
their assets in a liquid form. Thus, some borrowing takes place to allow the building
up of liquid reserves.
207
..
..
FINM_C07.qxd
1/18/07
11:33 AM
Page 208
www.downloadslide.com
Chapter 7 • Interest rates
At first glance, this seems odd since the rate of interest received on such reserves
is bound to be less than that paid on loans. It is, however, a common phenomenon.
For example, many households with mortgages maintain liquid reserves – liquidity
has a value in itself and people are prepared to pay the spread between borrowing and
lending rates of interest in order to retain a degree of liquidity (see section 1.3.3).
It follows that the supply of loanable funds includes any rundown in existing liquid
reserves as well as the current savings of households and the retained profits of
firms. We also must now allow for the net creation of new money by banks since the
fractional reserve banking system greatly increases the ability of banks to lend.
For the economy as a whole, we can net out some items, leaving us with:
Demand for loanable funds = net investment + net additions to liquid reserves
Supply of loanable funds = net savings + increase in the money supply
We return next to Figure 7.1. Now, however, we allow for the possibility of inflation and so the nominal interest rate shown on the axis might not be the same as
the real rate of interest. We assume that the lines DD and SS are the demand and
supply curves when inflation is zero. Consider, then, what happens when the money
supply increases, ceteris paribus. This adds to the supply of loanable funds, the supply
curve moves down to S1S1. However, in the set of models of which loanable funds is
a part, the increase in the money supply ultimately only causes inflation – it does not
cause an increase in output and employment. As prices rise, users of loanable funds
need to borrow more to buy the same quantities of capital and consumer goods as
before. The demand curve in Figure 7.1 shifts up to the right. We finish at point B,
with an equilibrium interest rate at i3 (equal to i1 + the rate of inflation). The increase
in the money supply causes the nominal interest rate to rise but only because of the
inflation it has caused. This is in accordance with the Fisher effect – lenders demand
higher nominal rates of interest to preserve the original real rate of interest and to
take inflation into account.
The real interest rate does not change. Of course, we may take some time to reach
this position and the real rate of interest will be below its original level during the
period of adjustment. This persists, however, only to the extent that savers underestimate the true rate of inflation (they suffer from money illusion) or require time
to alter the terms of savings contracts into which they have already entered.
Money illusion: A confusion between real and nominal values causing people not to
take inflation fully into account. This is assumed to occur only in disequilibrium.
Proponents of this view assume that the monetary authorities have full control over
the supply of money (the money supply is exogenous) and so the initial increase in
the money supply and the consequent inflation are the responsibility of the central
bank. Nominal interest rates are explained by a combination of the loanable funds
theory (explaining real interest rates) and a monetary theory of inflation. Real interest
rates change only slowly over time. The only significant disturbance to market interest
rates comes from the ill-advised activities of the monetary authorities.
208
..
..
FINM_C07.qxd
1/18/07
11:33 AM
Page 209
www.downloadslide.com
7.2 The loanable funds theory of real interest rates
7.2.2 Problems with the loanable funds theory
Unsurprisingly, the loanable funds theory has some problems. Firstly, it is clear that
people go on saving even when real interest rates become negative and remain so
for quite long periods. This can only occur in the model outlined above through the
existence of money illusion. It happens only in the short run (when the system is in
disequilibrium). In equilibrium, suppliers and demanders of loanable funds are perfectly informed about the real rate of interest. This means, however, that the model
does not do very well in explaining changes in interest rates over what economists
refer to as the short run, but this can involve quite long periods of actual time.
Secondly, real as well as nominal interest rates are capable of changing rapidly. For
example, in the US from December 2004 to December 2005, the Federal Funds rate
– the rate of interest controlled by the US central bank – was raised from 2 per cent
to 4.25 per cent although the rate of inflation increased only from 2.7 to 3 per cent.
Even allowing for the likelihood that expected inflation rates might have been higher,
it remains clear that the real interest rate rose significantly during the year.
We can see that the concentration on the long run in the loanable funds approach
to interest rates seriously understates the role of the monetary authorities in a
modern economy. After all, the Federal Reserve changed interest rates so often in
2005 because it wanted to have an impact on real interest rates, with the aim of
preventing the US economy from expanding too rapidly. Equally, when in February
2003 the Bank of England Monetary Policy Committee took everyone by surprise by
lowering its repo rate from 4 to 3.75 per cent, it was intending to lower real interest
rates because it was worried by the performance of the real economy in the UK.
This change is looked at in more detail in Box 7.1.
Box 7.1
The Monetary Policy Committee’s interest rate decision –
February 2003
In February 2003, the Monetary Policy Committee of the Bank of England surprised
financial markets by cutting its repo rate from 4 per cent to 3.75 per cent. Before this
decision, the rate had been held steady at 4 per cent since November 2001. Why were
the markets surprised by the February decision?
It was widely accepted that the UK economy was going through a period of slow
growth and many forecasts suggested that the rate of growth would decline further.
Manufacturing industry was doing particularly badly and business organisations had
been asking for an interest rate cut for some months. The trade unions, concerned about
increasing unemployment, also sought a cut. However, there was considerable concern
that the economy was dangerously unbalanced. In particular, house prices were continuing to increase rapidly and mortgage borrowing and household debt had grown to
record levels. Some analysts talked of a house price bubble and argued that the longer
the bubble persisted, the bigger would be the collapse in prices when it eventually came.
An interest rate cut, they thought, would cause house prices and debt to rise even faster
in the short run and thus make a large ‘correction’ more likely.
209
..
..
FINM_C07.qxd
1/18/07
11:33 AM
Page 210
www.downloadslide.com
Chapter 7 • Interest rates
Such a collapse in house prices would lead to large reductions in consumption as
households sought to come to terms with their debt and the lower value of their houses
and other assets. A sharp reduction in consumption could tip the UK economy into a
full recession. Therefore the financial markets had convinced themselves that the MPC
would not cut interest rates.
When it happened, the interest rate cut was praised by the Director General of the
Confederation of British Industry (CBI), but the FTSE share index, the value of sterling
and gilt prices all fell sharply, providing ample evidence that the markets had been taken
by surprise (see Box 7.6 for more information on the impact on gilt prices).
We can interpret the difference in view as a clash between the real and financial
economies. The case for an interest rate cut grew easily out of standard economic theory
– the economy was growing slowly, inflationary pressures were weak and slow growth
was also forecast in the US and Europe, making the prospects for export industries
gloomy. There seemed a strong case for cutting the repo rate in order to prompt interest
rates generally in the economy to fall. This would push down real interest rates and so
encourage firms to invest. The argument against the cut was based on the psychology
of markets and consumers and on asset prices and financial ratios.
The MPC surprised the markets by opting for the cut in real interest rates in line with
economic theory. This led the markets to wonder whether the Bank of England had
information not available to the markets suggesting that the state of the economy was
worse than the markets had thought. This turned out not to be the case. In the minutes of
the MPC meeting, the seven MPC members who voted for the interest rate cut included
in their reasons for doing so worries about weakening demand at home and abroad, dissipating inflationary pressures, weak equity markets and ‘geopolitical worries’ (which at
the time meant uncertainty regarding the likelihood of war in Iraq and its consequences).
Thirdly, there is another problem stemming from the assumption that the rate of
inflation or the expected rate of inflation has no long-run impact on the real rate of
interest. Unfortunately for the theory, there is no doubt that inflationary expectations
do influence the willingness of people to save and of potential investors to borrow.
The direction of the impact of inflation on saving is not certain. The existence of, or
the threat of, inflation might persuade people to hold their wealth in the form of
real rather than financial assets since real assets (on average, over the medium term
or long term) maintain their real value during inflations. People thinking in this
way would reduce their savings during periods of inflation. However, in some past
inflationary periods people have responded to the inflation by saving more rather
than less. Why might they have done this?
People hold a considerable part of their wealth in the form of financial assets. With
inflation, the real value of these assets falls. It is perfectly logical to respond to this
by consuming less now and adding to holdings of financial assets in order to offset
in part the impact of inflation on past savings. It follows that the impact of inflation
on savers is ambiguous. Clearly, much depends on the rate of inflation and expectations about future inflation rates. When inflation rates are very high, people attempt
to convert all of their past savings into goods as quickly as they can as well as refusing
to buy financial assets from current income. There is no doubt that in these periods
210
..
..
FINM_C07.qxd
1/18/07
11:33 AM
Page 211
www.downloadslide.com
7.3 Loanable funds in an uncertain economy
savings fall sharply. However, in periods of relatively low inflation, the overall effect
is unclear. Because of the importance of expectations, the level of savings (both in
nominal and real terms) might be influenced not just by the rate of inflation but also
by the rate at which the rate of inflation is changing (the volatility of inflation).
Changes in the rate of inflation also affect the decisions of potential investors.
In deciding whether to borrow in order to invest, potential investors assess the
probable rates of return on investment projects and compare these with the cost of
borrowing. This is much more difficult to do if there is inflation, particularly if
the rate of inflation is volatile. The possibility that the inflation rate might change
considerably during the period of a loan introduces an extra element of uncertainty
into the investment decision.
The loanable funds model can be modified to take such complaints into account.
The problem is that these changes are ad hoc and run the risk of destroying the central
idea at the heart of loanable funds – that the market economy is stable and has a
strong in-built tendency to return to equilibrium. The real rate of interest is a key
variable in the explanation of how this might happen. It therefore makes sense to look
at a different theory of interest rates – one that is constructed on entirely different
assumptions as to how the economy works. This is known as the liquidity preference
theory of interest rates. Before explaining the liquidity preference theory, let us look
at how the loanable funds approach functions under these different assumptions.
7.3 Loanable funds in an uncertain economy
We saw that the loanable funds theory was based on the idea of people allocating
their available resources over their lifetimes. Indeed, to the extent that people save
in order to pass on wealth to their children, the analysis can be extended to future
generations. Thus, the analysis relates to the very long run. In making their decisions,
people are assumed to have full information about future rates of return and inflation and about the effects of their current savings and consumption decisions on
their future levels of income. This can be true only if expectations about the future
are always correct – there is no possibility here, for instance, of people who wish to
work being unemployed.
The difficulty is that in an ever-changing world, we never reach the long-run
positions at the heart of loanable funds analysis. The world changes and people begin
to adapt to these changes. Before they have fully adapted, more changes occur and
so the process continues. We can, of course, look back and see what has happened
in an economy over long periods; but each economic agent makes decisions in
a series of short runs. In these circumstances, people may have little idea of future
interest rates or inflation rates (and hence future real rates of interest). They may be
quite unsure of their ability to obtain work in the future or of what they will be paid
for their work. If this is true, the notion that the crucial economic decision made by
market agents concerns the allocation of consumption across their lifetimes begins
to seem far-fetched. They may plan to save a particular proportion of their current
incomes, but the absolute level of their savings may change because of unexpected
211
..
..
FINM_C07.qxd
1/18/07
11:33 AM
Page 212
www.downloadslide.com
Chapter 7 • Interest rates
changes in their incomes. Not only incomes change unexpectedly. In recent decades
in developed countries people have acquired many more assets than used to be the
case (houses, pension entitlements, unit trusts) and have, at the same time, become
much more heavily indebted. Changes in house prices, for example, can have dramatic effects on estimates of wealth, as people found out in the early 1990s in the UK
when house prices fell so sharply that many people found the current values of their
houses were less than the size of their mortgages. Where both future income and
estimates of personal wealth are uncertain, the impact of time preference on savings
is dominated by events.
Indeed, it is possible that the positive relationship between interest rates and
savings in the loanable funds theory is reversed for some people. People unable to
think of maximising welfare through the choice between present and future consumption across their lifetimes might well choose to save in order to reach a fixed
level of savings by a particular date in the future, for example to allow them to retire.
Any increase in the interest rate then allows them to achieve that target by saving
less in each period. The relationship between savings and interest rates becomes
negative for them.
Again, savings decisions may be taken out of the hands of those who are in debt.
For many people, a major reason for saving is to allow them to repay their mortgages.
Unexpected increases in interest rates cause debt repayments to increase and require
reductions in consumption. It can be argued that the great increase in indebtedness
has changed the nature of the choice between the present and the future. People
are able to consume more in the current period but lose control of their future
consumption levels.
What does all this amount to? If we return to our supply of loanable funds diagram,
we are suggesting that the slope of the curve is uncertain and that the curve might
shift rapidly with unexpected changes in income and asset prices. The interest rate
might still be an important ceteris paribus influence, but the effect of interest rate
changes on savings is difficult to see among all the other changes taking place.
The demand for loanable funds is equally problematic if firms are uncertain of
their ability to sell what they produce. The expected rate of return on investment
then no longer depends simply on the marginal productivity of capital but will
be influenced by factors affecting business confidence. These might include the
existing rate of profit, forecasts of the future levels of income and unemployment,
expectations regarding future interest and exchange rates, and political factors such
as possible changes of government. A project might appear to be very profitable
on the assumption of full employment, but firms might not invest if they suspect
that the economy is heading into recession. In other words, the demand curve for
loanable funds is also subject to shifts that are difficult to forecast.
If both the demand and supply curves are unstable, the loanable funds theory
does not help us very much in the explanation of the level of or changes in rates of
interest – especially if changes in the rate of interest themselves cause one or both
of the curves to shift. The factors underlying these curves – marginal productivity
and time preference – remain long-term influences on the rate of interest, but we
cannot say much more than that.
212
..
..
FINM_C07.qxd
1/18/07
11:33 AM
Page 213
www.downloadslide.com
7.4 The liquidity preference theory of interest rates
7.4 The liquidity preference theory of interest rates
In an uncertain world, then, saving and investment may be much more influenced
by expectations and by exogenous shocks than by underlying real forces. One possible
response of risk-averse savers is to vary the form in which they hold their financial
wealth depending on what they think is likely to happen to asset prices – they are
likely to vary the average liquidity of their portfolios. In section 1.1.3, we defined a
liquid asset as one that can be turned into money quickly, cheaply and for a known
monetary value. It is the risk of loss in the value of assets with which we are concerned here. In periods in which people are confident that asset prices will increase,
they are encouraged to hold a high proportion of their portfolios in illiquid assets,
benefiting from the higher rate of interest that they offer. Increased doubt about future
asset prices, on the other hand, encourages people to give up these higher rates of
interest in search of the greater security offered by more liquid assets. This happens
in financial markets all the time. For example, in the equity market the shares of
some companies are likely to fare better than others in a falling market, and investors
become more likely to buy these shares if they fear a fall in share prices. Again, bonds
with distant maturity dates carry more capital risk than those nearer to maturity and
are thus relatively less attractive when the markets turn bearish.
This is not to say that people all have the same expectations regarding future
asset prices; that all people with the same expectations behave in the same way;
or that everyone is equally risk averse. Nonetheless, there is likely to be a general
shift towards greater liquidity whenever confidence in financial markets falls. Even
the large pension funds withdraw significant amounts of their funds from the equity
and bond markets and hold instead short-term securities and cash during periods
of uncertainty. Here we see a quite different role for interest rates than that played
in the loanable funds theory. The inverse relationship between interest rates and
bond and share prices that we considered in Chapter 6 becomes important. Plainly,
an expectation of an increase in interest rates increases the prospect of a fall in
financial asset prices generally and of a greater relative fall in the prices of illiquid
assets. In other words, an expected increase in interest rates, ceteris paribus, increases
the preference of asset holders for liquidity.
Liquidity preference: The preference for holding financial wealth in the form of shortterm, highly liquid assets rather than long-term illiquid assets, based principally on the
fear that long-term assets will lose capital value over time.
This general idea was developed into an economic theory by J M Keynes within
a simplified model in which there were only two types of financial asset – money,
the liquid asset, and bonds with no maturity date (consols), the illiquid asset. An
increased preference for liquidity in this model is equivalent to an increased demand
for money. Thus, the demand for money increases whenever more people think
interest rates are likely to rise than believe they are likely to fall. This is Keynes’s
speculative motive for holding money – people hold money instead of less liquid
213
..
..
FINM_C07.qxd
1/18/07
11:33 AM
Page 214
www.downloadslide.com
Chapter 7 • Interest rates
Figure 7.2
assets in order to avoid a capital loss. This, of course, leaves us with the problem of
knowing when people are likely to expect interest rates to rise. Keynes’s approach to
this was very simple. It was to suggest that the lower interest rates currently were,
relative to their usual level in the economy, the higher would be the proportion of
people who thought that the next interest rate move would be up. Thus, the lower
interest rates were, the greater would be the fear of a fall in asset prices and the
greater would be the preference for liquidity. The resulting demand for money curve
slopes down from left to right as shown in Figure 7.2.
There is very little objection to this negative relationship between interest rates
and the demand for money since there are other possible explanations for it. Keynes’s
theory, however, has two controversial implications. Firstly, the demand for money
curve is likely to be less steeply sloped than in most other theories of the demand
for money since small changes in interest rates might cause quite large changes in
people’s expectations about future rates. This is particularly likely at interest rates
that are historically very low because at this level the great majority of people are
likely to think that interest rates will next rise. This explains the flatter section of
the demand for money curves in Figure 7.2.
Secondly, and more importantly, Keynes did not assume that the interest rate was
the only factor influencing expectations of future asset prices. Market optimism or
pessimism can result from a wide range of economic and political factors, and the
views of market agents will be strongly influenced by what they believe other market
agents are likely to do. Hence, if we were to believe that there was no objective
reason for a fall in bond prices but we thought that other people in the market were
likely to sell, we might try to beat the fall by selling bonds and moving to more
liquid assets. If enough people behaved in the same way, the price would fall. Under
these circumstances, the demand for money curve might be highly unstable. It
might shift as a result of exogenous shocks that would be difficult to forecast. This
has a number of important implications, but before considering them, we need to
complete the model by adding a supply of money curve.
214
..
..
FINM_C07.qxd
1/18/07
11:33 AM
Page 215
www.downloadslide.com
7.6 The monetary authorities and the rate of interest
The standard model of this kind continues to assume that the monetary authorities
are able to control the supply of money. The money supply curve can be drawn as
either vertical (as it is in the simplest version of these theories) or, as here, as sloping
up steeply to the right. The interaction of the demand for money and supply of money
curves then determines the interest rate.
7.5 Loanable funds and liquidity preference
Much effort has been put into trying to show the relationship between the two
principal theories of interest rate determination – loanable funds and liquidity preference. It is commonly argued that the two theories are, in fact, complementary,
merely looking at two different markets (the market for money and the market for
non-money financial assets), both of which have to be in equilibrium if the system
as a whole is in equilibrium. Although it is true that, in a technical sense, the two
theories can be assimilated, this is done at the cost of losing the spirit of both theories.
Let us see why this is so.
Let us assume that there is a sudden, unexplained loss of confidence in financial
markets, causing an increase in the demand for liquidity. The demand for money at
each level of interest rates increases and the demand for money curve in Figure 7.2
shifts out from MD1 to MD2. Interest rates rise from i1 to i2. In the nominal interest rate
version of the loanable funds theory, this is expressed as an increase in the demand
for liquid reserves, and the demand for loanable funds curve shifts up, also causing an
increase in nominal interest rates. So far so good, but this sudden change in confidence would be regarded by loanable funds theorists as irrational behaviour. In other
words, it would either not occur or would be seen as temporary and unimportant in
an explanation of how the economy operated.
Remember that, in our discussion of the loanable funds view, we suggested that
any instability in interest rates would be caused by the behaviour of governments or
central banks. In liquidity preference theory, on the other hand, instability is inherent
in the market economy and there is a possible role for government in stabilising
the economy. This argument that the two theories are essentially very different is
carried further the next section when we consider the implications of the two theories
for monetary policy.
7.6 The monetary authorities and the rate of interest
We saw in Chapter 5 and in Box 7.1 that the general level of interest rates might
change in an economy because the monetary authorities change the rate of interest
at which they are prepared to operate in the money market. This is usually done in an
attempt to influence the level of aggregate demand in the economy (and hence the
rate of inflation) or the net inflow of short-term capital into the economy (and hence
the exchange rate). Section 5.3 deals in some detail with the operation of monetary
policy and with recent changes in the practice of monetary policy in the UK.
215
..
..
FINM_C07.qxd
1/18/07
11:33 AM
Page 216
www.downloadslide.com
Chapter 7 • Interest rates
In Chapter 5, we pointed out that the ability of the monetary authorities to
influence very short-term interest rates in the economy derives from the role of the
central bank as the lender of last resort to the commercial banking system. The need
for central banks to operate in this way arises from the fractional reserve nature of the
banking system (explained fully in Chapter 3) and the desire of banks to keep the
average rate of return on their assets as high as possible. Thus, they seek to economise
on their holdings of liquid, low-interest assets. However, the fractional reserve system
means that banks can easily find themselves short of liquid assets (reserves) as the
result of unexpected withdrawals by depositors. The monetary authorities are able
to exploit this need of banks to maintain a sufficient stock of reserves by being willing to replenish bank reserves, but only at a price determined by the central bank.
Section 5.3 lists the three ways in which central banks might allow banks to achieve
the degree of liquidity needed to meet the demands of their depositors while still
keeping the average rate of return they receive on their assets high – use of the discount window, open market operations, and repurchase agreements.
Variations by the central bank in the interest (or discount) rate at which it is prepared to lend very short term to the commercial banks influence the form in which
banks hold their assets and, in particular, their willingness to make loans to their
clients. This then affects longer-term interest rates. This ability of the central bank to
influence the general level of interest rates does not, however, mean it fully controls
rates of interest. There are several reasons for this.
Firstly, the notion that the central bank can influence the willingness of banks to
make loans assumes that banks are profit maximisers and thus that any small change in
the costs of a liquidity shortage causes a response from banks. The behaviour of banks
certainly shows that they are interested in keeping profits high, but they are also likely
to have other objectives. For instance, they may wish to maintain their share of the
different markets in which they operate. Banks are in competition with each other for
both assets (including competing with each other in the house mortgage market) and
liabilities (competition for bank deposits). In order to maintain their spread between
borrowing and lending rates, banks that cut their lending rates must also cut their
deposit rates. It follows that in a period of intense competition for bank deposits, such
as has occurred in the UK in recent years with the establishment of savings banks by
supermarket chains and insurance companies and the continued growth of telephone
banking, banks might judge that they cannot afford to lower immediately the rates of
interest they are offering on deposits. This might cause them not to respond immediately to relatively small changes in the base interest rate of the central bank.
This implies that banks have a choice – to respond or not to the prompting of
the central bank. This arises because the larger banks possess a considerable degree
of market power. In a perfectly competitive system, all banks would respond to the
prompting of the central bank by being more willing to make longer-term loans
(including mortgage loans), and this would push down interest rates generally,
leading to an increase in borrowing and an increase in the total stock of deposits.
However, if the banks are more interested in their share of deposits than in the
volume of deposits, they might be unwilling to lower the interest rates they offer to
savers, even if that prevents them from lowering mortgage interest rates as well.
216
..
..
FINM_C07.qxd
1/18/07
11:33 AM
Page 217
www.downloadslide.com
7.6 The monetary authorities and the rate of interest
In theory, it should be more difficult for banks to resist attempts by the central
bank to push up interest rates, as long as the central bank has the power to induce
a genuine shortage of liquidity in the economy. If banks hold their assets in a more
liquid form than is needed, all they are doing is forgoing potential profits. If they hold
their assets in a less liquid form than is needed, they ultimately face the possibility
of a loss of confidence by the depositors and hence of collapse. Even here, however,
there are limits to the power of the central bank. In developed and sophisticated
financial markets, banks have considerable ability to overcome shortages of liquidity
without resorting to borrowing from the central bank. In any case, it would be a very
risky policy for central banks to squeeze liquidity to such an extent that the banks
genuinely feared collapse. Indeed, for such a policy to be effective, the authorities
would have to accept reasonably frequent bank collapses. This, in turn, would reduce
the confidence of depositors in the banking system – a result that modern governments do not desire.
There is a second quite different difficulty with our analysis. When we described
the process above by which banks became more or less willing to make loans, we
implied two things: (a) that the demand curve for loans did not shift; and (b) that
the market for loans was genuinely competitive – that is, that banks are prepared
to lend to anyone prepared to pay the market rate of interest. Let us look at each
of these.
We suggested above that the willingness of investors and consumers to borrow
depended a good deal on confidence. That is, if firms believe that the economy is
heading into a recession, they will not wish to borrow in order to invest because
they are worried about their ability to sell their products. Decisions by potential
house buyers and purchasers of consumer durables depend a good deal on their
current estimates of their net wealth. A major part of the net wealth of many households is the current value of the house in which they live. Any fall in house prices
is thus likely to affect consumers’ confidence. In addition, estimates of household
wealth are now strongly linked to the prices of financial assets. Any sharp fall in the
prices of equities or other financial assets or any expectation that such a fall might
occur can have a powerful impact on household estimates of wealth and a strong
impact on their willingness to go further into debt. It follows that any exogenous
influences on the confidence of firms or households might shift the demand curve
for new loans.
In Figure 7.3, then, we assume a sharp fall in the demand for new loans. For the
moment, we shall assume no change in the willingness of banks to lend. The demand
curve shifts down, and in a competitive market the interest rate on longer-term loans
would fall. As loan rates fall, the cost to banks of holding liquid assets falls and banks
hold a higher proportion of their assets in liquid form. The demand for short-term
assets rises and short-term interest rates fall. The monetary authorities are not determining interest rates here. This allows us to consider the circumstances in which the
authorities might have an influence.
Suppose that the market is not fully competitive and that interest rates do not
fall as quickly as they would do in a competitive market. In Figure 7.3, we show the
possibility that interest rates do not move at all. We move from point A to point C
217
..
..
FINM_C07.qxd
1/18/07
11:33 AM
Page 218
www.downloadslide.com
Chapter 7 • Interest rates
Figure 7.3
rather than to point B. Therefore, the value of loans falls from OL1 to OL3. Under
these circumstances, the central bank could act at the short end of the market to
exert pressure on banks to reduce interest rates in the direction in which they would
fall in a competitive system. However, there are clear limits to the influence of the
central bank. It could succeed only in pushing interest rates down in the direction
dictated by market forces. In general, we can say that in a system that does not have
a strong tendency towards equilibrium, the central bank is able to push the rate
of interest towards the equilibrium rate. As we shall see later, the job of the central
bank is much more difficult than this implies. The point we are making here is that
the central bank is not free to push the rate of interest in either direction or by any
amount that it chooses.
Let us next return to the question of whether banks are prepared to lend to
anyone at the existing rate of interest. This is certainly not so. There is no doubt that
there is at least some degree of rationing in the market for bank loans. That is, at
least some would-be borrowers are unable to obtain loans even if they are willing
to pay the market rate of interest. Some market agents are unable to obtain loans at
all; others will be able to obtain loans only at higher rates of interest. One possible
explanation for this depends on the presence of asymmetric information (defined
in section 4.1). We noted in section 3.1.4 that banks have better knowledge about
the risk to which they are going to put funds than do the savers who lend them but
we might also argue that banks are less able to know the likely prospects of success
of investment projects than are investors. In the case of consumers, banks know
less than the would-be borrower about the likelihood that the loan will be repaid.
They may respond by imposing additional conditions on borrowers (for example,
a stipulation of a certain amount of collateral for the loan) or by including an additional risk premium in the interest rate to take into account their assessment of the
risk associated with the loan. Poor people often have no access at all to bank finance
and are forced to borrow from pawnbrokers and other informal financial institutions,
which charge much higher rates of interest than banks.
218
..
..
FINM_C07.qxd
1/18/07
11:33 AM
Page 219
www.downloadslide.com
7.6 The monetary authorities and the rate of interest
This element of rationing in the market for bank loans allows banks to vary the
amount of lending they do by changing the percentage of loan applicants they reject.
In other words, the supply curve of bank lending may shift because of changes in
the assessment made by banks of the future prospects of the economy. We might
even think of a kinked supply curve of new loans, indicating the higher risk premium
that banks require from customers classified as not such good risks. Such a supply
curve could even become vertical, to reflect the fact that some demand for bank
loans will not be met at any rate of interest. This approach would allow the position
of the kink or the size of the risk premiums demanded to change depending on the
assessment made by banks of general economic prospects. This introduces additional
exogenous elements into the determination of interest rates.
In different ways and to different degrees both the loanable funds and the liquidity
preference theories of interest rates cast doubt on the power of the central bank.
According to loanable funds theory, the central bank has no effect on long-run real
interest rates. All it can do is to cause (or prevent) inflation and hence influence
nominal rates of interest. Monetary changes have no impact on real variables – money
is neutral. There may be short-run effects on real variables such as employment and
the real interest rate but these occur only to the extent that market agents suffer
from money illusion. That is, they confuse real and monetary variables, thinking
mistakenly, for example, that an increase in money wages implies an increase in real
wages although prices are rising at the same time.
This is not the case in the Keynesian model in which changes in interest rates
brought about by the central bank can have an effect on real values – money is
not neutral. However, doubts are raised about the size of that effect and about
the ability of the central bank to influence the rate of interest. We pointed out
above that, in the standard form of Keynesian monetary theory, the money supply
is assumed to be exogenous. Assume, then, that the authorities increase the supply
of money. This would shift the supply of money curve in Figure 7.2 out to the right.
Interest rates would fall, but if this fall persuaded a significant number of people
that interest rates were likely soon to go back up again, it might cause a considerable increase in the demand for money. In other words, a large proportion of the
increase in the supply of money might be held idly as liquid balances rather than
being lent on to firms and consumers wishing to borrow in order to spend. If this
is so, increases in the money supply might have a very small impact on interest
rates and hence on spending. In the extreme version of this argument, the liquidity
trap, liquidity preference is total – any increase in the money supply is matched
by an equivalent increase in the demand for money. Monetary policy has no effect
on anything.
This does not take us far since we know that central banks cannot and do not try
to control the money supply directly but act instead on short-term rates of interest.
Supporters of the ideas behind liquidity preference then adopt some of the arguments
above, suggesting that the actions of the central bank might not be fully reflected
in interest changes throughout the economy. The practice of credit rationing by
banks is held to be particularly important in this regard. In addition, if the central
bank does succeed in bringing about a change in interest rates, the effects might not
219
..
..
FINM_C07.qxd
1/18/07
11:33 AM
Page 220
www.downloadslide.com
Chapter 7 • Interest rates
be very great since the rate of interest is only one factor influencing investment
and consumption. Factors influencing how confident people feel about the future
are likely to be more important. All of this is particularly true when economies are
in deep recession. The central bank is thought to have more power to help to deflate
inflationary economies by pushing up interest rates than to help drag economies out
of recession by pushing down interest rates.
We need to add, however, that the very large increase in home ownership and
the generally large increase in personal indebtedness in recent years has led to the
view that the power of the central bank to affect the economy through its influence
on interest rates has increased sharply. Box 7.2 summarises the many factors that
we have suggested might have an influence on nominal interest rates.
Box 7.2
Influences on nominal interest rates
The following list puts together all of the factors discussed in this chapter which might
have an influence on nominal interest rates:
1
2
3
4
5
6
7
8
9
10
11
12
13
14
15
The marginal productivity of capital.
The average time preference of the population.
Business confidence.
The economy’s wealth.
Expectations regarding future changes in asset prices.
Expectations regarding the future performance of the economy.
Expectations regarding future interest rates.
Expectations regarding future exchange rates.
The rate of inflation.
Expectations of changes in the rate of inflation.
The volatility of inflation.
The short-term interest rates set by the monetary authorities
The degree of competition among financial institutions.
The international mobility of capital.
Changes in the degree of risk aversion in the economy.
Have we left anything out?
Do you understand where each of these fits into the argument?
Which three factors do you think are most important?
7.7 The structure of interest rates
Let us now drop our assumption that all interest rates in the economy move together.
There are, indeed, many interest rates and the structure of interest rates is subject
to considerable change. Such changes are important to the operation of monetary
policy.
220
..
..
FINM_C07.qxd
1/18/07
11:33 AM
Page 221
www.downloadslide.com
7.7 The structure of interest rates
Interest rates vary because of differences in the time period, the degree of risk, and
the transactions costs associated with different financial instruments. Let us begin
by considering differences in risk. Plainly, the greater the risk of default associated
with an asset, the higher must be the interest rate paid upon it as compensation for
the risk. This explains why some borrowers pay higher rates of interest than others.
The degree of risk associated with a request for a loan may be determined informally,
based upon, for example, a company’s size, profitability or past performance; or, it
may be determined more formally by credit rating agencies.
Borrowers with high credit ratings will be able to have commercial bills accepted
by banks, find willing takers for their commercial paper or borrow directly from banks
at ‘fine’ rates of interest. Such borrowers are often referred to as prime borrowers.
Those less favoured may have to borrow from other sources at higher rates. Much
the same principle applies to the comparison between interest rates on sound riskfree loans (such as government bonds) and expected yields on equities, the factors
influencing which were discussed in detail in Chapter 6. There we saw that the
more risky a company is thought to be, the lower will be its share price in relation
to its expected average dividend payment – that is, the higher will be its dividend
yield and the more expensive it will be for the company to raise equity capital. Of
course, not everyone is risk averse and shares of companies that have made no
profits and paid no dividends for several years continue to be bought and sold and
so the loading for risk that must be paid by risky companies need not necessarily be
very great.
Interest rates payable on different forms of assets will also vary with transaction
costs and these are subject to economies of scale. Thus, other things being equal, we
should expect rates of interest to be lower the larger the size of the loan.
7.7.1 The term structure of interest rates
Our principal concern here, however, is with instruments that differ only in their
time period – that is, there is an equal risk of default and no difference in transaction costs. The relationship between interest rates on short-term securities and
those on long-term ones can be represented on a diagram known as the yield curve.
Yield curve: Shows the relationships between the interest rates payable on bonds
with different lengths of time to maturity. That is, it shows the term structure of
interest rates.
A typical yield curve is shown in Figure 7.4. Here, interest rates rise as the length
of time to maturity increases, but the curve gradually flattens out. Yield curves may,
however, be of many different shapes. Figure 7.5 illustrates a range of possibilities.
To examine the circumstances in which a yield curve might assume a particular
shape, we need to consider several theories of the nature of the relationship between
long-term and short-term rates.
221
..
..
FINM_C07.qxd
1/18/07
11:33 AM
Page 222
www.downloadslide.com
Chapter 7 • Interest rates
Figure 7.4
Figure 7.5
7.7.2 The pure expectations theory of interest rate structure
This theory assumes that present long-term interest rates depend entirely on future
short-term rates. Lenders are taken to be equally happy to hold short-term or longterm securities. Their choice between them will depend only on relative interest
rates. It follows that, for instance, a series of five one-year bonds is a perfect substitute for a five-year bond. If this were so, the proceeds from investing say £1,000
for one year and then reinvesting the returns for another year and so on for five
years must exactly equal the proceeds from buying a £1,000 five-year bond at the
beginning.
Consider what would happen if this were not so. Suppose the proceeds from a
long-term bond were greater than from a series of short-term bonds. People would
buy long-term bonds, pushing up their price and pushing down the rate of interest
on them. This would continue until there was no advantage to be had from holding
the long-term bonds. Then people would be indifferent between the two types of
bond. Thus, the long-term interest rate would depend entirely on the expected
future short-term rates.
The simplest form of this theory assumes that lenders have perfect information
and know what is going to happen to short-term interest rates in the future. In this
case, the long-term interest rate will be an average of the known future short-term
rates. This relationship between long-term and short-term rates can be expressed in
the formula
(1 + i*)n = (1 + i1)(1 + i2)(1 + i3) . . . (1 + in)
(7.5)
where i* is the interest rate payable each year on a long-term bond and n is the
number of years to maturity of the bond; i1 is the rate of interest payable now on a
one-year bond; i2 is the rate of interest which will be payable on a one-year bond in
a year’s time; i3 is the short-term rate two years into the future, and so on.
222
..
..
FINM_C07.qxd
1/18/07
11:33 AM
Page 223
www.downloadslide.com
7.7 The structure of interest rates
It follows that if short-term rates are expected to rise, long-term rates will be
higher than the current short-term rates and the yield curve will slope upwards.
Box 7.3 provides a numerical illustration of this and Exercise 7.1 gives you some
practice with it.
Box 7.3
The pure expectations theory of interest rate structure –
a numerical example
Assuming that lenders have perfect information, long-term interest rates will be an average
of the known future short-term rates. We assume that lenders know that short-term rates
over the next five years will be:
year
year
year
year
year
1
2
3
4
5
8 per cent
10 per cent
11 per cent
12 per cent
9 per cent
Then, £1,000 invested in a one-year bond, with the proceeds being invested in a
further one-year bond in the subsequent year, will produce the following results:
year 1
year 2
Principal
£1,000
£1,080
Interest rate
8 per cent
10 per cent
Interest
£80
£108
Capital + interest
£1,080
£1,188
We can calculate that for a two-year bond taken out at the beginning of year one
to produce the same results it would need to pay an interest rate of 9 per cent – the
average of the two short-term rates. What does this mean for the yield curve?
We can see that because it is known that short-term interest rates will rise over
the following year (from 8 per cent to 10 per cent), the interest payable on the two-year
(long-term) bond must be greater than that payable on the one-year (short-term) bond.
That is, the yield curve will be sloping upwards.
Let us continue our figures, assuming that our investor continues to re-invest in
one-year bonds for each of the following three years. This will give us:
year 3
year 4
year 5
£1,188
£1,319
£1,477
11 per cent
12 per cent
9 per cent
£131
£158
£133
£1,319
£1,477
£1,610
It can be shown that, at the beginning of year one, the interest rate payable on threeyear bonds must have been 9.66 per cent (the average of 8, 10 and 11) and on four-year
bonds 10.25 per cent. In other words, as long as it is known that short-term interest rates
are going to rise, the yield on long-term bonds for the equivalent period must lie above
the short-term rate at the beginning of year one and must be rising. The yield curve will
be sloping up. However, what about the interest rate at the beginning of year one on a
five-year bond? Because it is known that short-term interest rates will begin to fall in year
five, so too will the interest rate on a five-year bond. To produce a sum of £1,610 at the
end of five years, the interest rate on a five-year bond will need to be only 10 per cent
and the yield curve will begin to turn down.
223
..
..
FINM_C07.qxd
1/18/07
11:33 AM
Page 224
www.downloadslide.com
Chapter 7 • Interest rates
Exercise 7.1
In Box 7.3, assume that it is known that short-term interest rates in years 6, 7 and 8 will be:
year 6
year 7
year 8
4 per cent
9 per cent
13 per cent
What will be the interest rate at the beginning of year one on six-year, seven-year and
eight-year bonds respectively? Draw the yield curve at the beginning of year one.
7.7.3 Term premiums
However, people do not have perfect information about the future course of shortterm interest rates. All they can have are estimates of these rates, which are subject
to the risk of error. The further into the future we try to look, the greater is the
chance that we shall be wrong. Suppose a lender acquires a long-term bond that
pays an interest rate related to expected short-term interest rates but then finds
that short-term rates rise above the expected level. As current interest rates rise, the
prices of existing bonds fall, and bond holders suffer a capital loss. As we have seen
in Chapter 6, the longer the time to maturity of the bond, the greater will be the fall
in bond price. It follows that the risk of capital loss associated with any given error
in forecasting future interest rates, the capital risk, is greater for long-term than for
short-term bonds.
People respond to risk in different ways. If they have the same attitude to both
the risk of loss and the prospect of gain, the two balance out and they are said to be
risk-neutral. In this case, the yield curve reflects what investors expect to happen
to short-term rates of interest. In equilibrium, the outcome is exactly the same as
with perfect certainty. However, now it is possible that investors’ expectations will
be wrong and thus that the market will not be in equilibrium. This case is set out
formally in Box 7.4.
Box 7.4
The expectations view of the term structure of interest rates under
uncertainty assuming risk neutrality
Assume that there are two types of bond available to investors. They are identical in all
ways but one – one bond is for one year only (short-term bond); the second bond is for
two years (long-term bond). A person who wishes to invest for two years has a choice of
two strategies.
Strategy A
Buy a one-year bond now and when it matures in one year’s time, use the funds to buy
a second one-year bond. The investor knows the current rate of interest on one year
bonds, is, but does not know what the rate of interest on one-year bonds will be in
one year’s time. However, he holds the same expectation about that rate (which we shall
call the expected future short-term rate, i) as everyone else in the market.
224
..
..
FINM_C07.qxd
1/18/07
11:33 AM
Page 225
www.downloadslide.com
7.7 The structure of interest rates
Strategy B
Buy a two-year bond now. The investor knows the current rate of interest on a two-year
bond (i*).
Calculations
The investor can thus calculate the certain return to Strategy B and the expected return
to Strategy A.
The certain return to strategy B we can write as (1 + i*)2. All interest rates, remember, are
written as decimals. Thus, if i* were 5 per cent, a £100 bond would return in two years’
time: £(100) (1 + 0.05)2 = £100 × 1.1025 = £110.25.
The expected return to Strategy A, we can write as: (1 + is)(1 + i).
Now we can calculate the value that i would need to be for the two strategies to produce the same return at the end of two years: that is, the value i must take for the investor
to be indifferent between the two strategies. We call this value f2. By definition,
(1 + is)(1 + f2) = (1 + i*)2
and, (1 + f2) = (1 + i*)2/(1 + is).
Let is be 4 per cent and i* be 5 per cent. Then, (1 + f2) = 1.1025/1.04 = 1.06 and
f2 = 0.06 or 6 per cent.
In other words, if investors are to be indifferent between the two strategies, the
expected short-term rate of interest in one year’s time must be 6 per cent. Then no one
would have a reason for changing the balance of their present holdings of one-year and
two-year bonds: the market would be in equilibrium.
That is, our equilibrium condition for the market is that i (the expected future shortterm rate of interest) be equal to f2 (the rate of interest that causes the two strategies to
produce the same return at the end of two years).
It follows that if people expect the short-run rate in one year’s time to be greater than
f2 (i.e. i > f2), they will shift from long to short bonds without limit. In the reverse case
(i < f2) they will shift from short to long bonds without limit.
In the latter case, capital risk would increase, but there is both an upside risk (interest
rates fall and bond prices rise) and a downside risk (interest rates rise and bond prices
fall). Risk-neutral investors will see the upside and downside risk as offsetting each other.
In equilibrium, with i = f2, the term structure indicates what the market expects to happen
to short rates, just as under conditions of certainty. Thus, if is < i* and f2 > is, then i > is; people
are expecting short-run rates to rise: the yield curve will be rising. Equally, if is > i* but f2 < is,
then i < is and people are expecting short rates to fall: the yield curve will be falling.
If we next assume that people generally do not much like taking risks (they are
risk averse), we can argue that lenders will have to be paid a rather higher rate
of interest than the average of the expected but uncertain short-term rates to persuade them to buy longer-term bonds. This addition to the interest rate is sometimes
known as a risk premium, but is better referred to as a term premium to avoid confusion with the risk premium paid to offset exchange rate risk or default risk. It
is also sometimes referred to as a liquidity premium but this, strictly speaking, is
incorrect since ‘liquidity’ refers to the speed and ease with which an asset can be
converted into money without risk. A long-term bond can be converted into cash as
225
..
..