Ebook Systems analysis and design (8th edition) Part 2
Bạn đang xem bản rút gọn của tài liệu. Xem và tải ngay bản đầy đủ của tài liệu tại đây (17.42 MB, 292 trang )
C H A P T E R
10
Object-Oriented
Systems Analysis
and Design Using UML*
LEARNING OBJECTIVES
Once you have mastered the material in this chapter you will be able to:
1. Understand what object-oriented systems analysis and design is and appreciate its
usefulness.
2. Comprehend the concepts of unified modeling language (UML), the standard approach for
modeling a system in the object-oriented world.
3. Apply the steps used in UML to break down the system into a use case model and then a
class model.
4. Diagram systems with the UML toolset so they can be described and properly designed.
5. Document and communicate the newly modeled object-oriented system to users and other
analysts.
Object-oriented analysis and design can offer an approach that facilitates
logical, rapid, and thorough methods for creating new systems responsive
to a changing business landscape. Object-oriented techniques work well in
situations in which complicated information systems are undergoing continuous maintenance, adaptation, and redesign.
In this chapter, we introduce the unified modeling language (UML), the industry standard for modeling object-oriented systems. The UML toolset includes diagrams that allow
you to visualize the construction of an object-oriented system. Each design iteration takes a
successively more detailed look at the design of the system until the things and relationships
in the system are clearly and precisely defined in UML documents. UML is a powerful tool
that can greatly improve the quality of your systems analysis and design, and thereby help
create higher-quality information systems.
When the object-oriented approach was first introduced, advocates cited reusability of the
objects as the main benefit of their approach. It makes intuitive sense that the recycling of program parts should reduce the costs of development in computer-based systems. It has proved
to be very effective in the development of GUIs and databases.Although reusability is the main
goal, maintaining systems is also very important, and because the object-oriented approach
creates objects that contain both data and program code, a change in one object has a minimal impact on other objects.
*By Julie E. Kendall, Kenneth E. Kendall, and Allen Schmidt.
281
282
PART III • THE ANALYSIS PROCESS
OBJECT-ORIENTED CONCEPTS
Object-oriented programming differs from traditional procedural programming by examining the objects that are part of a system. Each object is a computer representation of some actual thing or event.
General descriptions of the key object-oriented concepts of objects, classes, and inheritance are presented in this section, with further details on other UML concepts introduced later in this chapter.
Objects
Objects are persons, places, or things that are relevant to the system we are analyzing. Objectoriented systems describe entities as objects. Typical objects may be customers, items, orders,
and so on. Objects may also be GUI displays or text areas on the display.
Classes
Objects are typically part of a group of similar items called classes. The desire to place items into
classes is not new. Describing the world as being made up of animals, vegetables, and minerals is an
example of classification. The scientific approach includes classes of animals (such as mammals),
and then divides the classes into subclasses (such as egg-laying animals and pouched mammals).
The idea behind classes is to have a reference point and describe a specific object in terms of its
similarities to or differences from members of its own class. In doing so, it is more efficient for someone to say, “The koala bear is a marsupial (or pouched animal) with a large round head and furry
ears,” than it is to describe a koala bear by describing all of its characteristics as a mammal. It is more
efficient to describe characteristics, appearance, and even behavior in this way. When you hear the
word reusable in the object-oriented world, it means you can be more efficient, because you do not
have to start at the beginning to describe an object every time it is needed for software development.
Objects are represented by and grouped into classes that are optimal for reuse and maintainability. A class defines the set of shared attributes and behaviors found in each object in the class. For
example, records for students in a course section have similar information stored for each student.
The students could be said to make up a class (no pun intended). The values may be different for
each student, but the type of information is the same. Programmers must define the various classes
in the program they are writing. When the program runs, objects can be created from the established
class. The term instantiate is used when an object is created from a class. For example, a program
could instantiate a student named Peter Wellington as an object from the class labeled as student.
What makes object-oriented programming, and thus object-oriented analysis and design, different from classical programming is the technique of putting all of an object’s attributes and
methods within one self-contained structure, the class itself. This is a familiar occurrence in the
physical world. For example, a packaged cake mix is analogous to a class since it has the ingredients as well as instructions on how to mix and bake the cake. A wool sweater is similar to a class
because it has a label with care instructions sewn into it that caution you to wash it by hand and
lay it flat to dry.
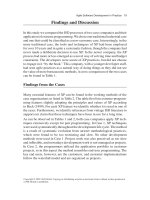
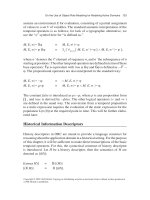
Each class should have a name that differentiates it from all other classes. Class names are
usually nouns or short phrases and begin with an uppercase letter. In Figure 10.1 the class is called
RentalCar. In UML, a class is drawn as a rectangle. The rectangle contains two other important
features: a list of attributes and a series of methods. These items describe a class, the unit of analysis that is a large part of what we call object-oriented analysis and design.
An attribute describes some property that is possessed by all objects of the class. Notice that
the RentalCar class possesses the attributes of size, color, make, and model. All cars possess these
FIGURE 10.1
An example of a UML class. A
class is depicted as a rectangle
consisting of the class name,
attributes, and methods.
Class Name
RentalCar
size
color
make
model
rentOut( )
checkIn( )
service( )
Attributes
Methods (Operations)
CHAPTER 10 • OBJECT-ORIENTED SYSTEMS ANALYSIS AND DESIGN USING UML
283
attributes, but each car will have different values for its attributes. For example, a car can be blue,
white, or some other color. Later on we will demonstrate that you can be more specific about the
range of values for these properties. When specifying attributes, the first letter is usually lowercase.
A method is an action that can be requested from any object of the class. Methods are the
processes that a class knows to carry out. Methods are also called operations. For the class of
RentalCar, rentOut(), checkIn(), and service() are examples of methods. When specifying
methods, the first letter is usually lowercase.
Inheritance
Another key concept of object-oriented systems is inheritance. Classes can have children; that is,
one class can be created out of another class. In UML, the original—or parent—class is known
as a base class. The child class is called a derived class. A derived class can be created in such a
way that it will inherit all the attributes and behaviors of the base class. A derived class, however,
may have additional attributes and behaviors. For example, there might be a Vehicle class for a
car rental company that contains attributes such as size, color, and make.
Inheritance reduces programming labor by using common objects easily. The programmer only
needs to declare that the Car class inherits from the Vehicle class, and then provide any additional
details about new attributes or behaviors that are unique to a car. All the attributes and behaviors of
the Vehicle class are automatically and implicitly part of the Car class and require no additional
programming. This enables the analyst to define once but use many times, and is similar to data that
is in the third normal form, defined only once in one database table (as discussed in Chapter 13).
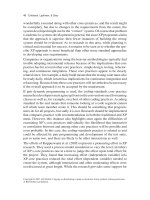
The derived classes shown in Figure 10.2 are Car or Truck. Here the attributes are preceded
by minus signs and methods are preceded by plus signs. We will discuss this in more detail later
in the chapter, but for now take note that the minus signs mean that these attributes are private
(not shared with other classes) and these methods are public (may be invoked by other classes).
FIGURE 10.2
Vehicle
A class diagram showing
inheritance. Car and Truck are
specific examples of vehicles and
inherit the characteristics of the
more general class, Vehicle.
–size
–color
–make
–model
–available
–ratePerDay
–ratePerWeek
–ratePerMile
+rentOut( )
+checkIn( )
+service( )
+addNew( )
is a
Car
–size
–color
–make
–model
–available
–ratePerDay
–ratePerWeek
–ratePerMile
–style
+rentOut( )
+checkIn( )
+service( )
+addNew( )
is a
Truck
–size
–color
–make
–model
–available
–ratePerDay
–ratePerWeek
–ratePerMile
–length
–4WheelDrive
–manualShift
+rentOut( )
+checkIn( )
+service( )
+addNew( )
284
PART III • THE ANALYSIS PROCESS
C O N S U LT I N G O P P O R T U N I T Y 1 0 . 1
Around the World in 80 Objects
B
ecause you have described the advantages of using objectoriented approaches, Jules and Vern, two top executives at
World’s Trend, would like you to analyze their business using this
approach. You can find a summary of World’s Trend business activities in Figure 7.15. Notice also the series of data flow diagrams in that chapter to help you conceptualize the problem and
begin making the transition to Object Think.
Because you are such good friends with Jules and Vern and because you wouldn’t mind a little practical experience using O-O
thinking, you agree to apply what you know and give them a report.
Once you have reread the business activities for World’s Trend, provide a timely review by completing the following tasks:
᭹
᭹
Use the CRC cards technique to list classes, responsibilities,
and collaborators.
Use the Object Think technique to list “knows” and
corresponding attributes for the objects in those classes
identified in the previous stage.
Write up both steps and fly over to World’s Trend headquarters
with your report in hand. Clearly, Jules and Vern are hoping for a
fantastic voyage into the new world of object-oriented methods.
Program code reuse has been a part of structured systems development and programming languages (such as COBOL) for many years, and there have been subprograms that encapsulate data.
Inheritance, however, is a feature that is only found in object-oriented systems.
CRC CARDS AND OBJECT THINK
Now that we have covered the fundamental concepts of object-oriented systems analysis and design, we need to examine ways to create classes and objects from the business problems and systems we are facing. One way to begin enacting the object-oriented approach is to start thinking
and talking in this new way. One handy approach is to develop CRC cards.
CRC stands for class, responsibilities, and collaborators. The analyst can use these concepts
when beginning to talk about or model the system from an object-oriented perspective. CRC
cards are used to represent the responsibilities of classes and the interaction between the classes.
Analysts create the cards based on scenarios that outline system requirements. These scenarios
model the behavior of the system under study. If they are to be used in a group, CRC cards can
be created manually on small note cards for flexibility, or they can be created using a computer.
We have added two columns to the original CRC card template: the Object Think column and
the property column. The Object Think statements are written in plain English, and the property,
or attribute, name is entered in its proper place. The purpose of these columns is to clarify thinking and help move toward creating UML diagrams.
Interacting During a CRC Session
CRC cards can be created interactively with a handful of analysts who can work together to identify the class in the problem domain presented by the business. One suggestion is to find all the
nouns and verbs in a problem statement that has been created to capture the problem. Nouns usually indicate the classes in the system, and responsibilities can be found by identifying the verbs.
With your analyst group, brainstorm to identify all the classes you can. Follow the standard
format for brainstorming, which is not to criticize any participant’s response at this point, but
rather to elicit as many responses as possible. When all classes have been identified, the analysts
can then compile them, weed out the illogical ones, and write each one on its own card. Assign
one class to each person in the group, who will “own” it for the duration of the CRC session.
Next, the group creates scenarios that are actually walk-throughs of system functions by taking desired functionality from the requirements document previously created. Typical systems
methods should be considered first, with exceptions such as error recovery taken up after the routine ones have been covered.
As the group decides which class is responsible for a particular function, the analyst who
owns the class for the session picks up that card and declares, “I need to fulfill my responsibility.” When a card is held in the air, it is considered an object and can do things. The group then
CHAPTER 10 • OBJECT-ORIENTED SYSTEMS ANALYSIS AND DESIGN USING UML
285
Class Name: Department
Superclasses:
Subclasses:
Responsibilities
Collaborators
Object Think
Property
Add a new department
Provide department information
Course
I know my name
Department Name
I know my department chair
Chair Name
Class Name: Course
Superclasses:
Subclasses:
Responsibilities
Add a new course
Change course information
Display course information
Collaborators
Department
Textbook
Assignment
Exam
Object Think
I know my course number
I know my description
I know my number of credits
Property
Course Number
Course Description
Credits
Class Name: Textbook
Superclasses:
Subclasses:
Responsibilities
Add a new textbook
Change textbook information
Collaborators
Object Think
Property
Course
I know my ISBN
I know my author
ISBN
I know my title
I know my edition
Title
I know my publisher
I know if I am required
Publisher
Find textbook information
Remove obsolete textbooks
Author
Edition
Required
Class Name: Assignment
Superclasses:
Subclasses:
Responsibilities
Add a new assignment
Change an assignment
View an assignment
Collaborators
Course
Object Think
I know my assignment num
ber
I know my description
I know how many points I
Property
Task Number
Task Description
am worth
I know when I am due
proceeds to refine the responsibility into smaller and smaller tasks, if possible. These tasks can
be fulfilled by the object if it is appropriate, or the group can decide that it can be fulfilled by interacting with other things. If there are no other appropriate classes in existence, the group may
need to create one.
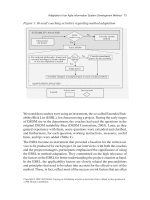
The four CRC cards depicted in Figure 10.3 show four classes for course offerings. Notice
that in a class called Course, the systems analyst is referred to four collaborators: the department,
Points
Due Date
FIGURE 10.3
Four CRC cards for course
offerings show how analysts fill in
the details for classes,
responsibilities, and collaborators,
as well as for object think
statements and property names.
286
PART III • THE ANALYSIS PROCESS
the textbook, the course assignment, and the course exam. These collaborators are then described
as classes of their own on the other CRC cards.
The responsibilities listed will eventually evolve into what are called methods in UML. The
Object Think statements seem elementary, but they are conversational so as to encourage a group
of analysts during a CRC session to describe as many of these statements as possible. As shown
in the example, all dialog during a CRC session is carried out in the first person, so that even the
textbook speaks: “I know my ISBN.” “I know my author.” These statements can then be used to
describe attributes in UML. These attributes can be called by their variable names, such as edition
and publisher.
THE UNIFIED MODELING LANGUAGE (UML)
CONCEPTS AND DIAGRAMS
The UML approach is well worth investigating and understanding, due to its wide acceptance and
usage. UML provides a standardized set of tools to document the analysis and design of a software system. The UML toolset includes diagrams that allow people to visualize the construction
of an object-oriented system, similar to the way a set of blueprints allows people to visualize the
construction of a building. Whether you are working independently or with a large systems development team, the documentation that you create with UML provides an effective means of
communication between the development team and the business team on a project.
UML consists of things, relationships, and diagrams, as illustrated in Figure 10.4. The first
components, or primary elements, of UML are called things. You may prefer another word, such
FIGURE 10.4
An overall view of UML and its
components: Things,
Relationships, and Diagrams.
UML Category
UML Elements
Specific UML Details
Things
Structural Things
Classes
Interfaces
Collaborations
Use Cases
Active Classes
Components
Nodes
Behavioral Things
Interactions
State Machines
Grouping Things
Packages
Annotational Things
Notes
Structural Relationships
Dependencies
Aggregations
Associations
Generalizations
Behavioral Relationships
Communicates
Includes
Extends
Generalizes
Structural Diagrams
Class Diagrams
Component Diagrams
Deployment Diagrams
Behavioral Diagrams
Use Case Diagrams
Sequence Diagrams
Communication Diagrams
Statechart Diagrams
Activity Diagrams
Relationships
Diagrams
CHAPTER 10 • OBJECT-ORIENTED SYSTEMS ANALYSIS AND DESIGN USING UML
as object, but in UML they are called things. Structural things are most common. Structural things
are classes, interfaces, use cases, and many other elements that provide a way to create models.
Structural things allow the user to describe relationships. Behavioral things describe how things
work. Examples of behavioral things are interactions and state machines. Group things are used
to define boundaries. An example of a group thing is a package. Finally, we have annotational
things, so that we can add notes to the diagrams.
Relationships are the glue that holds the things together. It is useful to think of relationships
in two ways. Structural relationships are used to tie the things together in the structural diagrams.
Structural relationships include dependencies, aggregations, associations, and generalizations.
Structural relationships show inheritance, for example. Behavioral relationships are used in the
behavioral diagrams. The four basic types of behavioral relationships are communicates, includes, extends, and generalizes.
There are two main types of diagrams in UML: structural diagrams and behavioral diagrams.
Structural diagrams are used, for example, to describe the relationships between classes. They include class diagrams, object diagrams, component diagrams, and deployment diagrams. Behavioral diagrams, on the other hand, can be used to describe the interaction between people (called
actors in UML) and the thing we refer to as a use case, or how the actors use the system. Behavioral diagrams include use case diagrams, sequence diagrams, communication diagrams, statechart diagrams, and activity diagrams.
In the remainder of this chapter, we first discuss use case modeling, the basis for all UML
techniques. Next, we look at how a use case is used to derive activities, sequences, and classes—
the most commonly used UML diagrams. Because entire books are dedicated to the syntax and
usage of UML (the actual UML specification document is over 800 pages long), we provide only
a brief summary of the most valuable and commonly used aspects of UML.
The six most commonly used UML diagrams are:
1. A use case diagram, describing how the system is used. Analysts start with a use case
diagram.
2. A use case scenario (although technically it is not a diagram). This scenario is a verbal
articulation of exceptions to the main behavior described by the primary use case.
3. An activity diagram, illustrating the overall flow of activities. Each use case may create
one activity diagram.
4. Sequence diagrams, showing the sequence of activities and class relationships. Each use
case may create one or more sequence diagrams. An alternative to a sequence diagram is a
communication diagram, which contains the same information but emphasizes
communication instead of timing.
5. Class diagrams, showing the classes and relationships. Sequence diagrams are used (along
with CRC cards) to determine classes. An offshoot of a class diagram is a gen/spec
diagram (which stands for generalization/specialization).
6. Statechart diagrams, showing the state transitions. Each class may create a statechart
diagram, which is useful for determining class methods.
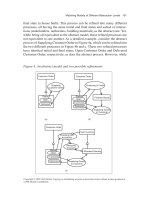
How these diagrams relate to one another is illustrated in Figure 10.5. We will discuss each
of these diagrams in the following sections.
USE CASE MODELING
UML is fundamentally based on an object-oriented analysis technique known as use case modeling, which was introduced in Chapter 2. A use case model shows a view of the system from the
user perspective, thus describing what a system does without describing how the system does it.
UML can be used to analyze the use case model, and to derive system objects and their interactions with each other and with the users of the system. Using UML techniques, you further analyze the objects and their interactions to derive object behavior, attributes, and relationships.
A use case provides developers with a view of what the users want. It is free of technical or
implementation details. We can think of a use case as a sequence of transactions in a system. The
use case model is based on the interactions and relationships of individual use cases.
A use case always describes three things: an actor that initiates an event; the event that triggers a use case; and the use case that performs the actions triggered by the event. In a use case,
287
288
PART III • THE ANALYSIS PROCESS
Use Case Diagram
Each
u
may se case
c
activ reate one
ity d
iagra
m.
Activity Diagram
Use c
a
scena se
rios m
be ge
ay
ne
the u rated from
se ca
se
diagra
m.
Use Case Scenario
Identifiers
Use c
a
sequ ses and
e
diagr nce
a
help ms
dete
rmine
class
es.
Steps
Conditions
Class Diagram
1
1
Each
scen use case
a
crea rio may
te
sequ one
e
diagr nce
am.
Sequence Diagram
Communication Diagram
1..
1
Statechart Diagram
Each
c
have lass ma
y
a sta
diagr
t
am t echart
o help
dete
rm
opera ine
tions
.
Sequ
e
comm nce and
u
diagr nication
a
inter ms are
chan
geab
le.
FIGURE 10.5
An overall view of UML diagrams
showing how each diagram leads
to the development of other UML
diagrams.
an actor using the system initiates an event that begins a related series of interactions in the system. Use cases are used to document a single transaction or event. An event is an input to the
system that happens at a specific time and place and causes the system to do something. For
more information about use case symbols and how to draw use case diagrams, see Chapter 2.
Figure 10.6 is a use case example of student enrollment at a university. Notice that only the
most important functions are represented. The Add Student use case does not indicate how
to add students, the method of implementation. Students could be added in person, using the
Web, using a touch-tone telephone, or any combination of these methods. The Add Student
use case includes the Verify Identity use case to verify the identity of the student. The
Purchase Textbook use case extends the Enroll in Class use case, and may be part of a system to enroll students in an online course.
It may seem as if the Change Student Information use case is a minor system feature and
should not be included on the use case diagram, but because this information changes fre-
CHAPTER 10 • OBJECT-ORIENTED SYSTEMS ANALYSIS AND DESIGN USING UML
Add
Student
>
Student
<<
Enroll
in Class
Financial Office
<<
<<
>
>
e>
d>
en
lud
ext
inc
<< include >>
in
<< include >>
Verify
Identity
Change Student
Information
Registration
e>
d
clu
View Student
Information
Purchase
Textbook
Bookstore
Transfer
Credits
Student
Department
FIGURE 10.6
quently, administration has a keen interest in allowing students to change their own personal information. The fact that the administrators deem this to be important not only justifies, but calls
for, the use case to be written up.
Students would not be allowed to change grade point average, outstanding fees, and other information. This use case also includes the Verify Identity use case, and in this situation, it means
having the student enter a user ID and password before gaining access to the system. View Student
Information allows students to view their personal information, as well as courses and grades.
A use case scenario example is shown in Figure 10.7. Some of the areas included are optional, and may not be used by all organizations. The three main areas are:
1. A header area containing case identifiers and initiators.
2. Steps performed.
3. A footer area containing preconditions, assumptions, questions, and other information.
In the first area the use case is identified by its name, Change Student Information; the actor is identified as a Student; and the Use Case and Triggering Event are described. The second
area contains a series of steps that are performed as long as no errors are encountered. Finally, in
the third area, all of the pre- and postconditions and assumptions are identified. Some of these are
obvious, such as the precondition that the student is on the correct Web page and the assumption
that the student has a valid student ID and password. Others are not so obvious, such as the outstanding issue regarding how many times the student is allowed to log on to the system.
A use case example of student
enrollment.
289
290
PART III • THE ANALYSIS PROCESS
Use case name:
Change Studen
t Information
Area:
Student System
Actor(s):
Student
Description:
Triggering Even
t:
Trigger type:
Steps Performed
UniqueID: Stud
ent UC 005
Allow student to
change his or he
r own informati
address, campu
on, such as nam
s telephone, ce
e, home addres
ll phone, and ot
s, home telepho
her information
ne, campus
using a secure
Student uses Ch
Web site.
ange Student In
formation Web
the Submit butto
site, enters stude
n.
nt ID and passwo
rd, and clicks
External
Temporal
(Main Path)
1. Student log
s on to the secu
Information for
re Web server.
Steps
2. Student reco
Student ID, Pass
rd is read and pa
word
ssword is verified
.
3. Current stu
dent personal inf
Student Record
, Student ID, Pa
ormation is displa
on the Change
ssword
yed
Student Web pa
ge.
Student Record
4. Student enter
s changes on th
e Change Studen
form and clicks
t Web
Submit button.
Change Studen
t Web Form
5. Changes ar
e validated on th
e Web server.
6. Change Stud
Change Studen
ent Journal reco
t Web Form
rd is written.
7. Student reco
Change Studen
rd is updated on
t Web Form
the Student Mas
ter.
8. Confirmation
Change Studen
Web page is se
t Web Form, St
nt to the student
udent Record
.
Preconditions:
Confirmation Pa
Student is on th
ge
e Change Studen
Postconditions
t Information W
:
eb page.
Student has succ
es
sfu
lly
ch
an
ged personal inf
Assumptions:
ormation.
Student has a br
owser and a va
lid user ID and
Requirements
password.
Met:
Allow students
to be able to ch
ange personal inf
Outstanding Iss
ues:
ormation using
Should the num
a secure Web sit
ber of times a stu
e.
Priority:
dent is allowed
to
log
on be controlled?
Medium
Risk:
Medium
FIGURE 10.7
A use case scenario is divided into
three sections: identification and
initiation, steps performed, and
conditions, assumptions, and
questions.
Use case diagrams provide the basis for creating other types of diagrams, such as class diagrams and activity diagrams. Use case scenarios are helpful in drawing sequence diagrams. Both
use case diagrams and use case scenarios are powerful tools to help us understand how a system
works in general.
ACTIVITY DIAGRAMS
Activity diagrams show the sequence of activities in a process, including sequential and parallel
activities, and decisions that are made. An activity diagram is usually created for one use case and
may show the different possible scenarios.
The symbols on an activity diagram are illustrated in Figure 10.8. A rectangle with rounded
ends represents an activity, either a manual one, such as signing a legal document, or an automated one, such as a method or program.
CHAPTER 10 • OBJECT-ORIENTED SYSTEMS ANALYSIS AND DESIGN USING UML
291
Start
Forks allow
go
activities to
in parallel.
Activity
Fork
[condition]
low
Branches al
alternative
ven
activities gi
t
en
differ
conditions.
We can add
swimlanes to
this diagram
to assign
ies.
responsibilit
[else]
Branch
Activity
Activity
Activity
Merge
Join
End
FIGURE 10.8
An arrow represents an event. Events represent things that happen at a certain time and place.
A diamond represents either a decision (also called a branch) or a merge. Decisions have one
arrow going into the diamond and several going out. A guard condition, showing the condition
values, may be included. Merges show several events combining to form one event.
A long, flat rectangle represents a synchronization bar. These are used to show parallel activities, and may have one event going into the synchronization bar and several events going
out of it, called a fork. A synchronization in which several events merge into one event is called
a join.
There are two symbols that show the start and end of the diagram. The initial state is shown
as a filled-in circle. The final state is shown as a black circle surrounded by a white circle.
Rectangles surrounding other symbols, called swimlanes, indicate partitioning and are used
to show which activities are done on which platform, such as a browser, server, or mainframe
computer; or to show activities done by different user groups. Swimlanes are zones that can depict logic as well as the responsibility of a class.
You can see an example of swimlanes in Figure 10.9, which illustrates an activity diagram
for the Change Student Information use case. It starts with the student logging onto the system
by filling out a Web form and clicking the Submit button. The form is transmitted to the Web
server, which then passes the data to the mainframe computer. The mainframe accesses the STUDENT database and passes either a “Not Found” message or selected student data to the Web
server.
The diamond below the Get Student Record state indicates this decision. If the student
record has not been found, the Web server displays an error message on the Web page. If the student record has been found, the Web server formats a new Web page containing the current student data in a Web form. The student may cancel the change from either the Logon System or the
Enter Changes states, and the activity halts.
If the student enters changes on the Web form and clicks the Submit button, the change data
is transmitted to the server and a program starts running that validates the changes. If there are errors, an error message is sent to the Web page. If the data are valid, the student record is updated
and a Change Student Journal Record is written. After a valid update, a confirmation Web page
is sent to the browser and the activity terminates.
Specialized symbols are used to
draw an activity diagram.
292
PART III • THE ANALYSIS PROCESS
Client Web Page
Web Server
Form Transmitted
Logon System
Mainframe
User ID and Password
Receive Web
Form
Get Student
Record
Record
Status
Send Error Message
Display Error
Message
Web Form Sent
Display Current
Student Data
Web Form Received
Enter Changes
Not Found
Exchange Data Placed in Message Queue
Validate Changes
Validation Status
Valid Data Received
Invalid Data Received
Valid Data
Send Error Messages
Display
Error Message
Update Student
Record
Record
Updated
Cancel
Cancel
Confirmation Sent
FIGURE 10.9
This activity diagram shows three
swimlanes: Client Web Page, Web
Server, and Mainframe.
Display
Confirmation
Valid Data
Create Change
Student Journal
Record
Record
Written
Valid Update
Creating Activity Diagrams
Activity diagrams are created by asking what happens first, what happens second, and so on. You
must determine whether activities are done in sequence or in parallel. If physical data flow diagrams
(as described in Chapter 7) have been created, they may be examined to determine the sequence of
activities. Look for places where decisions are made, and ask what happens for each of the decision
outcomes. Activity diagrams may be created by examining all the scenarios for a use case.
Each path through the various decisions included on the use case is a different scenario. In
the main path would be Logon System, Receive Web Form, Get Student Record, Display Current Student Data, Enter Changes, Validate Changes, Update Student Record, Create
Change Student Journal Record, and Display Confirmation.
This isn’t the only scenario that comes from this use case. Other scenarios may occur. One possibility could be Logon System, Receive Web Form, Get Student Record, and Display Error
Message. Another scenario could be Logon System, Receive Web Form, Get Student Record,
Display Current Student Data, Enter Changes, Validate Changes, and Display Error Message.
CHAPTER 10 • OBJECT-ORIENTED SYSTEMS ANALYSIS AND DESIGN USING UML
293
C O N S U LT I N G O P P O R T U N I T Y 1 0 . 2
Recycling the Programming Environment
“I
feel like I’m writing the same code over and over again,” says
Benito Pérez, a programmer working on a new automated warehouse design. “I have written so many programs lately that dealt
with robotic-type things that control themselves: automated mailroom trolleys, building surveillance robots, automatic pool cleaners, automatic lawn mowers, monorail trains, and now warehouse
trolleys. They are all variations on a theme.”
Lisa Bernoulli, the project manager, had heard this sort of
complaint for years. She replies, “Oh come on, Ben. These things
aren’t really that close. How can you compare a mailroom robot, an
automated warehouse, and a monorail train? I’ll bet less than 10
percent of the code is the same.”
“Look,” says Benito. “All three involve machines that have to
find a starting point, follow a circuitous route, make stops for loading and unloading, and eventually go to a stopping point. All three
have to make decisions at branches in their routes. All three have to
avoid colliding with things. I’m tired of redesigning code that is
largely familiar to me.”
“Hmmm,” Lisa muses as she looks over the basic requirements
for the warehouse system and remembers the monorail system she
and Benito had worked on last year. The requirements regarded a
small-lot electronics manufacturing firm that was automating its
warehouse and product movement system. The warehouse contains
incoming parts, work in progress, and finished goods. The auto-
mated warehouse uses a flatbed robot trolley. This robot is a fourwheel electric cart, similar to a golf cart except that it has no seats.
Flatbed robot trolleys have a flat, 6Ј ϫ 4Ј cargo surface about 3Ј
above ground level. These trolleys have a radio communications device that provides a real-time data link to a central warehouse computer. Flatbed trolleys have two sensors: a path sensor that detects a
special type of paint and a motion sensor that detects movement.
These trolleys follow painted paths around the factory floor. Special
paint codes mark forks and branches in the paths, trolley start and
stop points, and general location points.
The facility includes three loading dock stations and 10
workstations. Each station has a video terminal or computer connected to the central computer. When products are needed or are
ready to be collected from a workstation, the central computer is
informed by the worker at the station. The central computer then
dispatches trolleys accordingly. Each station has a drop point and
a pickup point. Flatbed trolleys move about the factory picking up
work at pickup points and dropping off work at drop points. The
program that will run the trolleys must interact heavily with the
existing job-scheduling program that helps schedule workstation
tasks.
How should Lisa go about reusing Benito Pérez’s work on the
monorail in their current task of creating a trolley object? Explain
in two paragraphs.
The swimlanes are useful to show how the data must be transmitted or converted, such as
from Web to server or from server to mainframe. For example, the Change Student Record activity diagram has three swimlanes.
The swimlane on the left shows activities that occur on the client browser. Web pages must
be created for these activities. The middle swimlane shows activities that happen on the server.
Events, such as Form Transmitted, represent data transmitted from the browser to the server, and
there must be programs on the server to receive and process the client data.
The swimlane on the right represents the mainframe computer. In large organizations it is
typical for many Web applications to work with a mainframe computer. Much of the data in large
organizations exists on mainframe databases and there is an enormous number of mainframe programs in existence.
When an event crosses the swimlane from the server to the mainframe computer, there must
be a mechanism for transmitting the event data between the two platforms. Servers use a different format to represent data (ASCII) than do mainframe computers (they use a format called
EBCDIC). Middleware must be present to take care of the conversion. IBM computers often use
an mqueue (for message queue). The mqueue receives data from the server programs, places it in
a holding area, and calls a mainframe program, usually written in a language called CICS. This
program retrieves or updates the data, and sends the results back to the mqueue.
In the example activity diagram shown, the decision below the Get Student Record state is
made on the mainframe computer. This means that the message queue receives either a “Not
Found” message or the database record for the student. If the mainframe simply placed the
Record Status Received in the message queue and the decision was evaluated on the server, the
server would have to call the mainframe again to obtain the valid data. This would slow down the
response to the person waiting at the browser.
294
PART III • THE ANALYSIS PROCESS
Swimlanes also help to divide up the tasks in a team. Web designers would be needed for the
Web pages displayed on the client browser. Other members would work with programming languages, such as Java, PHP, Ruby on Rails, PERL, or .NET, on the server. Mainframe CICS programmers would write programs that would work with the message queue. The analyst must
ensure that the data that the various team members need is available and correctly defined. Sometimes the data in the message queue is an XML document. If an outside organization is involved,
the data also might be an XML document.
The activity diagram provides a map of a use case, and allows the analyst to experiment with
moving portions of the design to different platforms and ask “What if?” for a variety of decisions.
The use of unique symbols and swimlanes makes this diagram one that people want to use to communicate with others.
Activity diagrams may be used to construct test plans. Each event must be tested to see
whether the activity diagram goes to the next state. Each decision must be tested to see whether
the correct path is taken when the decision conditions occur.
Activity diagrams are not used for all use cases. Use the activity diagram when:
1.
2.
3.
4.
It helps to understand the activities of a use case.
The flow of control is complex.
There is a need to model workflow.
All scenarios need to be shown.
The analyst would not need an activity diagram when the use case is simple or there is a need to
model the change of state.
Activity diagrams may also be used to model a lower-level method, showing detailed logic.
Repository Entries for an Activity Diagram
Each state and event may be further defined using a text description in a repository, which is a
collection of text descriptions for the project. Describe states with information about the state,
such as the Web page name, elements on the Web page, and so on. Describe events with the information that is required to communicate with the next state, such as the data from the Web form,
the data that is put into a message queue, or with a description of the event that caused the transition, such as a button click.
SEQUENCE AND COMMUNICATION DIAGRAMS
An interaction diagram is either a sequence diagram or a communication diagram, both of which
show essentially the same information. These diagrams, along with class diagrams, are used in a
use case realization, which is a way to achieve or accomplish a use case.
Sequence Diagrams
Sequence diagrams can illustrate a succession of interactions between classes or object instances
over time. Sequence diagrams are often used to illustrate the processing described in use case scenarios. In practice, sequence diagrams are derived from use case analysis and are used in systems
design to derive the interactions, relationships, and methods of the objects in the system. Sequence diagrams are used to show the overall pattern of the activities or interactions in a use case.
Each use case scenario may create one sequence diagram, although sequence diagrams are not always created for minor scenarios.
The symbols used in sequence diagrams are shown in Figure 10.10. Actors and classes or object instances are shown in boxes along the top of the diagram. The leftmost object is the starting
object and may be a person (for which a use case actor symbol is used), window, dialog box, or
other user interface. Some of the interactions are physical only, such as signing a contract. The
top rectangles use indicators in the name to indicate whether the rectangle represents an object, a
class, or a class and object.
objectName:
:class
objectName:class
A name with a colon after it represents an object.
A colon with a name after it represents a class.
A name, followed by a colon and another name,
represents an object in a class.
CHAPTER 10 • OBJECT-ORIENTED SYSTEMS ANALYSIS AND DESIGN USING UML
295
FIGURE 10.10
::Class
Object::Class
method(Parameter)
return
asynchronousSignal( )
A vertical line represents the lifeline for the class or object, which corresponds to the time from
when it is created through when it is destroyed. An X on the bottom of the lifeline represents when
the object is destroyed. A lateral bar or vertical rectangle on the lifeline shows the focus of control when the object is busy doing things.
Horizontal arrows show messages or signals that are sent between the classes. Messages belong to the receiving class. There are some variations in the message arrows. Solid arrowheads
represent synchronous calls, which are the most common. These are used when the sending class
waits for a response from the receiving class, and control is returned to the sending class when
the class receiving the message finishes executing. Half (or open) arrowheads represent asynchronous calls, or those that are sent without an expectation of returning to the sending class. An example would be using a menu to run a program. A return is shown as an arrow, sometimes with a
dashed line. Messages are labeled using one of the following formats:
᭹
᭹
᭹
᭹
The name of the message followed by empty parentheses: messageName().
The name of the message followed by parameters in parentheses:
messageName(parameter1, parameter2 . . .).
The message name followed by the parameter type, parameter name, and any default value
for the parameter in parentheses:
messageName(parameterType:parameterName(defaultValue). Parameter types
indicate the type of data, such as string, number, or date.
The message may be a stereotype, such as «Create», indicating that a new object is
created as a result of the message.
Timing in the sequence diagram is displayed from top to bottom; the first interaction is drawn
at the top of the diagram, and the interaction that occurs last is drawn at the bottom of the diagram. The interaction arrows begin at the bar of the actor or object that initiates the interaction,
and they end pointing at the bar of the actor or object that receives the interaction request. The
starting actor, class, or object is shown on the left. This may be the actor that initiates the activity
or it may be a class representing the user interface.
Figure 10.11 is a simplified example of a sequence diagram for a use case that admits a student to a university. On the left is the newStudentUserInterface class that is used to obtain student information. The initialize() message is sent to the Student class, which creates a new
student record and returns the student number. To simplify the diagram, the parameters that are
sent to the Student class have been omitted, but would include the student name, address, and so
Specialized symbols used to draw
a sequence diagram.
296
PART III • THE ANALYSIS PROCESS
FIGURE 10.11
A sequence diagram for student
admission. Sequence diagrams
emphasize the time ordering of
messages.
::newStudent
UserInterface
::Student
::dorm
::program
initialize( )
return studentNumber
selectDorm( )
return dormRoom
selectProgram( )
return programAdvisor
studentComplete( )
on. The next activity is to send a selectDorm message to the Dorm class. This message would
include dorm selection information, such as a health dorm or other student requirements. The
Dorm class returns the dorm name and room number. The third activity is to send a
selectProgram message to the Program class, including the program name and other course of
study information. The program advisor name is returned to the newStudentUserInterface class.
A studentComplete message is sent to the Student class with the dorm, advisor name, and other
information.
Sequence diagrams can be used to translate the use case scenario into a visual tool for systems analysis. The initial sequence diagram used in systems analysis shows the actors and classes
in the system and the interactions between them for a specific process. You can use this version
of the sequence diagram to verify processes with the business area experts who have assisted you
in developing the system requirements. A sequence diagram emphasizes the time ordering (sequence) of messages.
During the systems design phase, the sequence diagrams are refined to derive the methods and
interactions between classes. Messages from one class are used to identify class relationships. The
actors in the earlier sequence diagrams are translated to interfaces, and class interactions are translated to class methods. Class methods used to create instances of other classes and to perform other
internal system functions become apparent in the system design using sequence diagrams.
Communication Diagrams
Communication diagrams were introduced in UML 2.0. Their original name in UML 1.x was
collaboration diagrams. Communication diagrams describe the interactions of two or more
things in the system that perform a behavior that is more than any one of the things can do
alone. For instance, a car can be broken down into several thousand individual parts. The parts
are put together to form the major subsystems of the vehicle: the engine, the transmission, the
brake system, and so forth. The individual parts of the car can be thought of as classes, because
they have distinct attributes and functions. The individual parts of the engine form a collaboration, because they “communicate” with each other to make the engine run when the driver
steps on the accelerator.
A communication diagram is made up of three parts: objects (also called participants), the
communication links, and the messages that can be passed along those links. Communication di-
CHAPTER 10 • OBJECT-ORIENTED SYSTEMS ANALYSIS AND DESIGN USING UML
297
1:initialize( )
3:selectProgram( )
::newStudent
UserInterface
::student
::program
4:studentComplete( )
2:selectDorm( )
::dorm
agrams show the same information as a sequence diagram but may be more difficult to read. In
order to show time ordering, you must indicate a sequence number and describe the message.
A communication diagram emphasizes the organization of objects, whereas a sequence diagram emphasizes the time ordering of messages. A communication diagram will show a path to
indicate how one object is linked to another.
Some UML modeling software, such as IBM’s Rational Rose, will automatically convert a sequence diagram to a communication diagram or a communication diagram to a sequence diagram
with the click of a button. A communication diagram for the student admission example is illustrated
in Figure 10.12. Each rectangle represents an object or a class. Connecting lines show the classes
that need to collaborate or work with each other. The messages sent from one class to another are
shown along connecting lines. Messages are numbered to show the time sequence. Return values
may also be included and numbered to indicate when they are returned within the time sequence.
CLASS DIAGRAMS
Object-oriented methodologies work to discover classes, attributes, methods, and relationships
between classes. Because programming occurs at the class level, defining classes is one of the
most important object-oriented analysis tasks. Class diagrams show the static features of the system and do not represent any particular processing. A class diagram also shows the nature of the
relationships between classes.
Classes are represented by a rectangle on a class diagram. In the simplest format, the rectangle may include only the class name, but may also include the attributes and methods. Attributes
are what the class knows about characteristics of the objects, and methods (also called operations)
are what the class knows about how to do things. Methods are small sections of code that work
with the attributes.
Figure 10.13 illustrates a class diagram for course offerings. Notice that the name is centered
at the top of the class, usually in boldface type. The area directly below the name shows the attributes, and the bottom portion lists the methods. The class diagram shows data storage requirements as well as processing requirements. Later in the chapter we will discuss the meaning of the
diamond symbols shown in this figure.
The attributes (or properties) are usually designated as private, or only available in the object. This is represented on a class diagram by a minus sign in front of the attribute name. Attributes may also be protected, indicated with a pound symbol (#). These attributes are hidden from
all classes except immediate subclasses. Under rare circumstances, an attribute is public, meaning that it is visible to other objects outside its class. Making attributes private means that the attributes are only available to outside objects through the class methods, a technique called
encapsulation, or information hiding.
A class diagram may show just the class name; or the class name and attributes; or the class
name, attributes, and methods. Showing only the class name is useful when the diagram is very
complex and includes many classes. If the diagram is simpler, attributes and methods may be included. When attributes are included, there are three ways to show the attribute information. The
simplest is to include only the attribute name, which takes the least amount of space.
FIGURE 10.12
A communication diagram for
student admission.
Communication diagrams show
the same information that is
depicted in a sequence diagram
but emphasize the organization of
objects rather than the time
ordering.
298
PART III • THE ANALYSIS PROCESS
Course
Department
–departmentName
–departmentChair
+addDepartment( )
+viewDepartment( )
has a
is for a
Textbook
–courseNumber
–courseDescription
–numberOfCredits
–departmentNumber
1
1..
+addCourse( )
+changeCourse( )
+findCourse( )
is a
consists
part
of
of
Assignment
FIGURE 10.13
A class diagram for course
offerings. The filled-in
diamonds show aggregation
and the empty diamond shows
a whole-part relationship.
is a
consists
part
of
of
–ISBN
–author
–title
–edition
–publisher
–required
+addText( )
+changeText( )
+findText( )
+removeText( )
Exam
–assignmentNumber
–assignmentDescription
–assignmentPoints
–assignmentDueDate
–examNumber
–examName
–examPoints
–examVersion
+addAssignment( )
+changeAssignment( )
+viewAssignment( )
+addExam( )
+changeExam( )
+findExam( )
The type of data (such as string, double, integer, or date) may be included on the class diagram. The most complete descriptions would include an equal sign (ϭ) after the type of data followed by the initial value for the attribute. Figure 10.14 illustrates class attributes.
If the attribute must take on one of a finite number of values, such as a student type with values of F for full-time, P for part-time, and N for nonmatriculating, these may be included in curly
brackets separated by commas: studentType:char{F,P,N}.
Information hiding means that objects’ methods must be available to other classes, so methods are often public, meaning that they may be invoked from other classes. On a class diagram,
public messages (and any public attributes) are shown with a plus sign (ϩ) in front of them.
Methods also have parentheses after them, indicating that data may be passed as parameters
along with the message. The message parameters, as well as the type of data, may be included
on the class diagram.
There are two types of methods: standard and custom. Standard methods are basic things that
all classes of objects know how to do, such as create a new object instance. Custom methods are
designed for a specific class.
Method Overloading
Method overloading refers to including the same method (or operation) several times in a class.
The method signature includes the method name and the parameters included with the method.
The same method may be defined more than once in a given class, as long as the parameters sent
as part of the message are different; that is, there must be a different message signature. There
may be a different number of parameters, or the parameters might be a different type, such as a
FIGURE 10.14
An extended Student class that
shows the type of data and, in
some cases, its initial value or
default value.
Student
studentNumber: Integer
lastName: String
firstName: String
creditsCompleted: Decimal=0.0
gradePointAverage: Decimal=0.0
currentStudent: Boolean=Y
dateEnrolled: Date=
new( )
changeStudent( )
viewStudent( )
CHAPTER 10 • OBJECT-ORIENTED SYSTEMS ANALYSIS AND DESIGN USING UML
number in one method and a string in another method. An example of method overloading may
be found in the use of a plus sign in many programming languages. If the attributes on either side
of the plus sign are numbers, the two numbers are added. If the attributes are strings of characters, the strings are concatenated to form one long string.
In a bank deposit example, a deposit slip could contain just the amount of the deposit, in
which case the bank would deposit the entire amount, or it could contain the deposit amount and
the amount of cash to be returned. Both situations would use a deposit check method, but the parameters (one situation would also request the amount of cash to be returned) would be different.
Types of Classes
Classes fall into four categories: entity, interface, abstract, and control. These categories are explained below.
ENTITY CLASSES. Entity classes represent real-world items, such as people, things, and so on.
Entity classes are the entities represented on an entity-relationship diagram. CASE tools such as
Visible Analyst will allow you to create a UML entity class from an entity on an E-R diagram.
The analyst needs to determine which attributes to include in the classes. Each object has
many attributes, but the class should include only those that are used by the organization. For example, when creating an entity class for a student at a college, you would need to know attributes
that identify the student, such as home and campus address, as well as grade point average, total
credits, and so on. If you were keeping track of the same student for an online clothing store, you
would have to know basic identifying information, as well as other descriptive attributes such as
measurements or color preferences.
BOUNDARY, OR INTERFACE, CLASSES. Boundary, or interface, classes provide a means for users
to work with the system. There are two broad categories of interface classes: human and system.
A human interface may be a display, window, Web form, dialog box, menu, list box, or other
display control. It may also be a touch-tone telephone, bar code, or other way for users to interact with the system. Human interfaces should be prototyped (as described in Chapter 6), and often a storyboard is used to model the sequence of interactions.
System interfaces involve sending data to or receiving data from other systems. This may include databases in the organization. If data are sent to an external organization, they are often in
the form of XML files or other well-published interfaces with clearly defined messages and protocols. External interfaces are the least stable, because there is often little or no control over an
external partner who may alter the format of the message or data.
XML helps to provide standardization, because an external partner may add new elements to
the XML document, but a corporation transforming the data to a format that may be used to append
to an internal database may simply choose to ignore the additional elements without any problems.
The attributes of these classes are those found on the display or report. The methods are those
required to work with the display, or to produce the report.
ABSTRACT CLASSES. Abstract classes are classes that cannot be directly instantiated. Abstract
classes are those that are linked to concrete classes in a generalization/specialization (gen/spec)
relationship. The name of an abstract class is usually denoted in italics.
CONTROL CLASSES. Control, or active, classes are used to control the flow of activities, and they act
as a coordinator when implementing classes. To achieve classes that are reusable, a class diagram
may include many small control classes. Control classes are often derived during system design.
Often a new control class will be created just to make another class reusable. An example
would be the logon process. There might be one control class that handles the logon user interface, containing the logic to check the user ID and password. The problem that arises is that the
logon control class is designed for a specific logon display. By creating a logon control class that
handles just the unique logon display, the data may be passed to a more general validation control class, which performs a check on user IDs and passwords received from many other control
classes receiving messages from specific user interfaces. This increases reusability and isolates
the logon verification methods from the user interface handling methods.
The rules for creating sequence diagrams are that all interface classes must be connected to
a control class. Similarly, all entity classes must be connected to a control class. Interface classes,
unlike the other two, are never connected directly to entity classes.
299
300
PART III • THE ANALYSIS PROCESS
Defining Messages and Methods
Each message may be defined using a notation similar to that described for the data dictionary (as
shown in Chapter 8). The definition would include a list of the parameters passed with the message as well as the elements contained in the return message. The methods may have logic defined using structured English, a decision table, or a decision tree, as depicted in Chapter 9.
The analyst can use the techniques of horizontal balancing with any class method. All the
data returned from an entity class must be obtained either from the attributes stored in the entity
class, from the parameters passed on the message sent to the class, or as a result of a calculation
performed by the method of the class. The method logic and parameters must be examined to ensure that the method logic has all the information required to complete its work. Horizontal balancing is further described in Chapter 7.
ENHANCING SEQUENCE DIAGRAMS
Once the class diagram is drawn, it may be desirable to go back to the sequence diagram and include special symbols for each of the different types of classes introduced in the last section. Sequence diagrams in particular can be overbearing if an analyst doesn’t have a systematic approach
to drawing them. The following steps are a useful approach to enhancing a sequence diagram:
1. Include the actor from the use case diagram in the enhanced sequence diagram. This will
be a stick figure from the use case diagram. There may be an additional actor on the right
side of the diagram, such as a credit card company or bank.
2. Define one or more interface classes for each actor. Each actor should have his or her own
interface class.
3. Create prototype Web pages for all human interfaces.
4. Ensure each use case has one control class, although more may be created during the
detailed design. Look for that control class and include it in the sequence diagram.
5. Examine the use case to see what entity classes are present. Include these on the diagram.
6. Realize that the sequence diagram may be modified again when doing detailed design,
such as creating additional Web pages or control classes (one for each Web form
submitted).
7. To obtain a greater degree of reuse, consider moving methods from a control class to an
entity class.
A Class Example for the Web
Classes may also be represented using special symbols for entity, boundary (or interface), and
control classes. These are called stereotypes, an extension to UML, which are special symbols
that may be used during analysis, but are often used when performing object-oriented design.
They allow the analyst freedom to play with the design to optimize reusability.
The different types of classes are often used when working in the systems design phase.
Figure 10.15 is an example illustrating a sequence diagram representing a student viewing his or
her personal and course information. In the diagram, :View Student User Interface is an example of an interface class; :Student, :Section, and :Course are examples of entity classes; and
:View Student Interface Controller and :Calculate Grade Point Average are control classes.
The student is shown on the left as an actor, and he or she provides a userLogon to the :View
Student User Interface class. This is a Web form that obtains the student’s user ID and password.
When the student clicks the Submit button, the Web form is passed to a :View Student Interface Controller. This class is responsible for the coordination of sending messages and receiving
returned information from all the other classes.
The :View Student Interface Controller sends a getStudent( ) message to the :Student
class, which reads a database table and proceeds to return the studentData.
The studentWebPage is returned to the :View Student User Interface, which displays the
information in the Web browser. At the bottom of the page is a nextButton that the student clicks
to view courses. When the user clicks this button, it sends a Web form to the :View Student Interface Controller. This form contains the studentNumber(), sent along with the
studentWebPage, and is used to send a message to the :Section class to obtain the section grade.
If the studentNumber() was not automatically sent, it would mean that the student would have
CHAPTER 10 • OBJECT-ORIENTED SYSTEMS ANALYSIS AND DESIGN USING UML
ary
Bound
r
o
ace
interf
s
clas
ol
Contr
s
s
la
c
y
Entit
s
s
la
c
:View
Student
User
Interface
:View
Student
Interface
Controller
301
:Student
:Section
:Calculate
Grade
Point
Average
:Course
Student
provide
userLogon
logon( )
getStudent( )
display studentWebPage
return studentWebPage
return
studentData
click
nextButton
send
studentNumber( )
getSection( )
return
sectionGrade
calculateGPA( )
getCourse( )
return courseData
display
courseWebPage
return
courseWebPage
getCredits( )
return credits
return GPA
FIGURE 10.15
to enter his or her studentNumber() again, which would not be a satisfactory user interface because it involves redundant keying. Notice that the :Student class is not involved, and that the
focus of control (the vertical bar that is connected to the :Student class) ends before the second
set of activities (the horizontal arrows pointing to the right) begins.
The :View Student Interface Controller class sends a getSection() message to the :Section
class, which returns a sectionGrade. The :Section class also sends a calculateGPA() message
to the :Calculate Grade Point Average class, which sends a message back to the :Course class.
The :Course class returns the credits, which enables the :Calculate Grade Point Average class
to determine the GPA and return it to the :View Student Interface Controller.
The :View Student Interface Controller would repeat sending messages to the :Section
class until all sections for the student have been included. At this time, the :View Student
A sequence diagram for using two
Web pages: one for student
information, one for course
information.
302
PART III • THE ANALYSIS PROCESS
Interface Controller would send the courseWebPage to the :View Student User Interface
class, which would display the information in the browser.
Using the user interface, control, and entity classes also allows the analyst to explore and play
with the design. The design mentioned previously would display all the student personal information on one page and the course information on a second page. The analyst may modify the
design so that the student personal information and the course information appear on one Web
page. These two possible scenarios would be reviewed with users to determine the best option.
One of the difficulties for the analyst is to determine how to include the studentNumber after clicking the Next button, because the :Student class is no longer available. There are three
ways to store and retransmit data from a Web page:
1. Include the information in the URL displaying in the address or location area of the
browser. In this case, the location line might read something like the following:
/>Everything after the question mark is data that may be used by the class methods. This
means of storing data is easy to implement and is often used in search engines.
There are several drawbacks to using this method, and the analyst must use due
caution. The first concern is privacy—anyone can read the Web address. If the application
involves medical information, credit card numbers, and so on, this is not a good choice.
Most browsers will also display previous Web address data in subsequent sessions if the
user enters the first few characters, and the information may be compromised, leading to
identity theft. A second disadvantage is that the data are usually lost after the user closes
the browser.
2. Store the information in a cookie, a small file stored on the client (browser) computer.
Cookies are the only way to store data that have persistence, existing beyond the current
browser session. This enables the Web page to display a message such as “Welcome back,
Robin. If you are not Robin, click here.” Cookies usually store primary key account
numbers, but not credit card numbers or other private information. Cookies are limited to
20 per domain (such as www.cpu.edu) and each cookie must be 4,000 characters or less.
The analyst must work with other business units to determine who needs to use
cookies, and there must be some central control over the names used in the cookies. If the
organization needs to have more than 20 cookies, a common solution is to create different
domain names used by the organization, such as support.cpu.edu or instruction.cpu.edu.
3. Use hidden Web form fields. These fields usually contain data that are sent by the server,
are invisible, and do not occupy any space on the Web page. In the view student
information example, the :View Student Interface Controller class added a hidden field
containing the studentNumber to the studentWebPage form along with the nextButton.
When the student clicks the nextButton, the studentNumber is sent to the server and the
:View Student Interface Controller knows which student to obtain course and grade
information for. The data in hidden forms is not saved from one browser session to another,
so privacy is maintained.
Presentation, Business, and Persistence Layers in Sequence Diagrams
In the previous example, we showed all of the classes in the same diagram. When it comes to writing code for systems, it has been useful to look at sequence diagrams as having three distinct layers as follows:
1. The presentation layer, which represents what the user sees. This layer contains the
interface or boundary classes.
2. The business layer, which contains the unique rules for this application. This layer contains
the control classes.
3. The persistence or data access layer, which describes obtaining and storing data. This layer
contains the entity classes.
Ideally program code would be written separately for each of these layers.
With the introduction of Ajax, the lines became blurred. Ajax, an acronym for asynchronous
JavaScript and XML, is a collection of techniques that allows Web applications to retrieve information from the server without altering the display of the current page. This turns out to be an ad-
CHAPTER 10 • OBJECT-ORIENTED SYSTEMS ANALYSIS AND DESIGN USING UML
303
vantage because the entire Web page does not need to be reloaded when it gets additional data
from the server.
Before Ajax was created a user visiting a Web site would answer some questions by entering
data on a Web-based form, then wait until a new page loaded. This was necessary because the code
to validate, get the data, then answer the user resided on the server. With the advent of Ajax, the
Web page is updated rapidly because much of the validation and other control logic is now
included in the browser JavaScript code or on the client side. This means that business rules are
included in both the boundary and the control class, so it might not be possible to have three
distinct layers.
ENHANCING CLASS DIAGRAMS
The class symbols also may be used on class and communication diagrams. Figure 10.16 illustrates the class diagram for a student viewing personal and course information on Web pages.
Each class has attributes and methods (which are not shown on diagrams using this notation).
If the class is a user interface type of class, the attributes are the controls (or fields) on the
screen or form. The methods would be those that work with the screen, such as submit or reset.
They might also be JavaScript for a Web page, because the code works directly with the Web
page.
If the class is a control class, the attributes would be those needed to implement the class,
such as variables used just in the control class. The methods would be those used to perform calculations, make decisions, and send messages to other classes.
If the class is an entity class, the attributes represent those stored for the entity and the methods working directly with the entity, such as creating a new instance, modifying, deleting, obtaining, or printing.
Web sites may use a combination of many different classes to accomplish user objectives.
For example, a Web site may use JavaScript to prevalidate data, then pass data to the server control classes, which perform thorough validation, including obtaining data. The server control
classes may in turn send JavaScript back to the Web page to do some formatting. It is not uncommon to have a Web application involve many classes, some of them containing only one line of
code in a method, in order to achieve the goal of reusability.
FIGURE 10.16
:View
Student
User
Interface
:View
Student
Interface
Controller
A class diagram for the
studentWebPage using special
class symbols.
Student
:Student
:Section
:Course
:Calculate
Grade
Point
Average
304
PART III • THE ANALYSIS PROCESS
Relationships
Another way to enhance class diagrams is to show relationships. Relationships are connections
between classes, similar to those found on an entity-relationship diagram. These are shown as
lines connecting classes on a class diagram. There are two categories of relationships: associations and whole/part relationships.
ASSOCIATIONS. The simplest type of relationship is an association, or a structural connection
between classes or objects. Associations are shown as a simple line on a class diagram. The end
points of the line are labeled with a symbol indicating the multiplicity, which is the same as
cardinality on an entity-relationship diagram. A zero represents none, a one represents one and
only one, and an asterisk represents many. The notation 0..1 represents from zero to one, and the
notation 1..* represents from one to many. Associations are illustrated in Figure 10.17.
FIGURE 10.17
Types of associations that may
occur in class diagrams.
Graduate Student
–studentNumber
–creditsCompleted
–gradePointAverage
–department
–major
–thesisNumber
–advisor
Thesis
–thesisNumber
–studentNumber
1 –thesisTitle
–dateStarted
–completionDate
–approvalDate
–approvedBy
1
has
+acceptStudent( )
+viewStudent( )
+changeStudent( )
+graduateStudent( )
+addThesis( )
+change( )
+approveThesis( )
Student
–studentNumber
–creditsCompleted
–gradePointAverage
–department
–major
Course
1
1..
enrolls in
+addCourse( )
+changeCourse( )
+findCourse( )
+initialize( )
+viewStudent( )
+changeStudent( )
+graduateStudent( )
Student
–studentNumber
–creditsCompleted
–gradePointAverage
–department
–major
Dorm Room
1
0..
is assigned to
Student
+initialize( )
+viewStudent( )
+changeStudent( )
+graduateStudent( )
–dormName
–roomNumber
–roomSize
–occupantGender
–numberVacancies
+addRoom( )
+changeRoom( )
+findRoom( )
+changeVacancy( )
+initialize( )
+viewStudent( )
+changeStudent( )
+graduateStudent( )
–studentNumber
–creditsCompleted
–gradePointAverage
–department
–major
–courseNumber
–courseDescription
–numberOfCredits
–departmentNumber
Volunteer Activity
1
participates in
–activityNumber
–activityDescription
–activityOrganization
–activityDate
–studentNumber
+addActivity( )
+changeActivity( )
+findActivity( )
+addVolunteer( )
CHAPTER 10 • OBJECT-ORIENTED SYSTEMS ANALYSIS AND DESIGN USING UML
Student
–studentNumber
–creditsCompleted
–gradePointAverage
–department
–major
–minor
+changeStudent( )
+findStudent( )
+graduateStudent( )
+initialize( )
+studentComplete( )
+viewStudent( )
Course
1..
0..
takes
has
–courseNumber
–courseDescription
–numberOfCredits
–departmentNumber
+addCourse( )
+changeCourse( )
+findCourse( )
Section
–studentNumber
–courseNumber
–year
–semester
–grade
+addSection( )
+changeGrade( )
+enrollStudent( )
+recordGrade( )
+withdrawStudent( )
Class diagrams do not restrict the lower limit for an association. For example, an association
might be 5..*, indicating that a minimum of five must be present. The same is true for upper limits. For example, the number of courses a student is currently enrolled in may be 1..10, representing from 1 to 10 courses. It can also include a range of values separated by commas, such as 2, 3,
4. In the UML model, associations are usually labeled with a descriptive name.
Association classes are those that are used to break up a many-to-many association between
classes. These are similar to associative entities on an entity-relationship diagram. Student and
Course have a many-to-many relationship, which is resolved by adding an association class
called Section between the classes of Student and Course. Figure 10.18 illustrates an association class called Section, shown with a dotted line connected to the many-to-many relationship
line.
An object in a class may have a relationship to other objects in the same class, called a reflexive association. An example would be a task having a precedent task, or an employee supervising another employee. This is shown as an association line connecting the class to itself, with
labels indicating the role names, such as task and precedent task.
WHOLE/PART RELATIONSHIPS. Whole/part relationships are when one class represents the whole
object and other classes represent parts. The whole acts as a container for the parts. These
relationships are shown on a class diagram by a line with a diamond on one end. The diamond is
connected to the object that is the whole. Whole/part relationships (as well as aggregation,
discussed later) are shown in Figure 10.19.
A whole/part relationship may be an entity object that has distinct parts, such as a computer
system that includes the computer, printer, display, and so on, or an automobile that has an engine, brake system, transmission, and so on. Whole/part relationships may also be used to describe a user interface, in which one GUI screen contains a series of objects such as lists, boxes,
or radio buttons, or perhaps a header, body, and footer area. Whole/part relationships have three
categories: aggregation, collection, and composition.
Aggregation An aggregation is often described as a “has a” relationship. Aggregation provides
a means of showing that the whole object is composed of the sum of its parts (other objects). In
the student enrollment example, the department has a course and the course is for a department.
This is a weaker relationship, because a department may be changed or removed and the course
may still exist. A computer package may not be available any longer, but the printers and other
components still exist. The diamond at the end of the relationship line is not filled in.
Collection A collection consists of a whole and its members. This may be a voting district with
voters or a library with books. The voters or books may change, but the whole retains its identity.
This is a weak association.
305
FIGURE 10.18
An example of an associative class
in which a particular section
defines the relationship between a
student and a course.