Quality evaluation of houttuynia cordata thunb by high performance liquid chromatography with photodiode array detection (HPLC DAD)
Bạn đang xem bản rút gọn của tài liệu. Xem và tải ngay bản đầy đủ của tài liệu tại đây (318.77 KB, 9 trang )
Quality evaluation of Houttuynia cordata Thunb. by high performance
liquid chromatography with photodiode-array detection (HPLC-DAD)
Zhan-nan Yang1,2, Yi-ming Sun1, Shi-qiong Luo2, Jin-wu Chen1, Zheng-wen Yu2
and Min Sun1*
1
School of Life Science, Southwest University, Key Laboratory of Eco-environments in Three Gorges Reservoir Region (MOE)
Chongqing, PR China
2
Key Laboratory for Information System of Mountainous Area and Protection of Ecological Environment of Guizhou Province,
Guizhou Normal University, Guiyang, PR China
Abstract: A new, validated method, developed for the simultaneous determination of 16 phenolics (chlorogenic acid,
scopoletin, vitexin, rutin, afzelin, isoquercitrin, narirutin, kaempferitrin, quercitrin, quercetin, kaempferol, chrysosplenol
D, vitexicarpin, 5-hydroxy-3,3',4',7-tetramethoxy flavonoids, 5-hydroxy-3,4',6,7-tetramethoxy flavonoids and
kaempferol-3,7,4'-trimethyl ether) in Houttuynia cordata Thunb. was successfully applied to 35 batches of samples
collected from different regions or at different times and their total antioxidant activities (TAAs) were investigated. The
aim was to develop a quality control method to simultaneously determine the major active components in H. cordata.
The HPLC-DAD method was performed using a reverse-phase C18 column with a gradient elution system (acetonitrilemethanol-water) and simultaneous detection at 345 nm. Linear behaviors of method for all the analytes were observed
with linear regression relationship (r2>0.999) at the concentration ranges investigated. The recoveries of the 16 phenolics
ranged from 98.93% to 101.26%. The samples analyzed were differentiated and classified based on the contents of the
16 characteristic compounds and the TAA using hierarchical clustering analysis (HCA) and principal component
analysis (PCA). The results analyzed showed that similar chemical profiles and TAAs were divided into the same group.
There was some evidence that active compounds, although they varied significantly, may possess uniform anti-oxidant
activities and have potentially synergistic effects.
Keywords: Hierarchical clustering analysis (HCA), Houttuynia cordata Thunb., phenolics, principal component analysis
(PCA), quality evaluation
INTRODUCTION
Houttuynia cordata Thunb., as a potentially medical and
edible functional food (Wu et al., 2005a; Wu et al.,
2005b), is a traditional Chinese medicine (TCM) that is
officially listed in the Chinese Pharmacopoeia (CP) (2010
edition) (Pharmacopoeia, 2010). In some Asian countries
(e.g. Thailand, Korea, India and Vietnam), While the
mature H. cordata, which are commonly used as a
traditional medical herb (Xu et al., 2011), possess a
variety of pharmacological activties (e.g., anti-oxidant,
antibacterial, immunomodulatory effects, anti-leukemic,
anti-platelet aggregation, anti-inflammatory, anti-tumor
and antimicrobial (Chang et al., 2001; Jong et al., 1993;
Nishiya et al., 1988; Proebstle et al., 1994). Recently, H.
cordata showed significant anti-SARS activity (Lau et al.,
2008). The flavonoids and chlorogenic acid, which are
two of the most common components in H. cordata,
possess anti-oxidant, free radical scavenging, antipyretic,
antibiotic, anti-neoplastic and anti-mutagenic capacities
(Chen et al., 2003; Choi et al., 2002). It is usually
believed that these components all contribute to the
therapeutic effects of H. cordata.
Because of the complexity of the components, it is often a
difficult process to establish quality control standards for
*Corresponding author: e-mail:
Pak. J. Pharm. Sci., Vol.27, No.2, March 2014, pp.223-231
TCMs. The quality evaluation of H. cordata was only
based on morphological characteristics in the CP (2010
edition). Previous research related to H. cordata has
isolated a number of compounds of various structural
types. Recently, the antioxidants identified in aqueous
extracts of H. cordata using high performance liquid
chromatography–mass
spectrometry
(HPLC-MS)
(Nuengchamnong et al., 2009) were reported. Eight
bioactive components (including flavonoids and alkaloids)
of H. cordata and related Saururaceae medicinal plants
were simultaneously analyzed (Meng et al., 2009). The
quality evaluation of HPLC-MS fingerprinting in H.
cordata had been established previously (Meng et al.,
2005; Meng et al., 2006), which was based on a
fingerprinting correlation coefficient developed according
to similarity of components and their contents.
The clinical effects of H. cordata are closely related to its
quality. Phenolics (e.g. flavonoids and chlorogenic acid,
etc.) varied remarkably in H. cordata plants with different
provenances, with different biological characteristics and
the geographic region where the plant grows (Wu et al.,
2009). However, more and more evidence is now
available that shows that the quality evaluation of the
fingerprinting characteristic is not mediated by the
clinical effects of H. cordata for the potential synergistic
223
Quality evaluation of Houttuynia cordata Thunb. by HPLC-DAD
effects among the bioactive compounds. Although the
phenolics varied remarkably, anti-oxidant activity may be
relatively uniform for potential synergistic effects among
the phenolics. It is therefore essential to establish a
method to evaluate the relationships between the
phenolics in H. cordata. In this regard, a simple and
comprehensive method for evaluating the quality of H.
cordata is urgently needed.
The aims of this study were to develop a quality control
method to simultaneously determine the major active
components in H. cordata using HPLC. The 16 markers
(Chlorogenic acid, scopoletin, vitexin, rutin, afzelin,
isoquercitrin,
narirutin,
kaempferitrin,
quercitrin,
quercetin, kaempferol, chrysosplenol D, vitexicarpin, 5hydroxy-3,3',4',7-tetramethoxy flavonoids, 5-hydroxy3,4',6,7-tetramethoxy flavonoids and kaempferol-3,7,4'trimethyl ether) contents of 35 H. cordata batches were
simultaneously determined and their antioxidant activities
evaluated by DPPH assay. The samples were differentiated and classified according to their active marker content
and the total antioxidant activity (TAA) by both
hierarchical clustering analysis (HCA) and principal
component analysis (PCA). This may provide important
information for the selection or evaluation of candidate
cultivars of H. cordata from a pharmacological
perspective.
MATERIALS AND METHODS
Chemicals and reagents
Sixteen markers (chlorogenic acid, scopoletin, vitexin,
rutin, afzelin, isoquercitrin, narirutin, kaempferitrin,
quercitrin, quercetin, kaempferol, chrysosplenol D,
vitexicarpin, 5-hydroxy-3,3',4',7-tetramethoxy flavonoids,
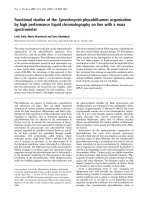
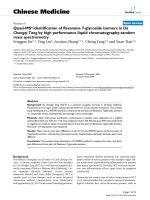
5-hydroxy-3,4',6,7-tetramethoxy flavonoids and kaempferol-3,7,4'-trimethyl ether) (fig. 1) were purchased from
Sigma (USA). Acetonitrile (HPLC) and methanol (HPLC)
were purchased from MERCK, Inc. (Germany). DPPH
was purchased from Sigma-Aldrich Chemie (Steinheim,
Germany) and formic acid was purchased from TianJin
Chemical Reagents Development Center (TianJin, China).
Ultrapure water (18.2 M) was prepared using a Sartorius
Arium 611UF water purification system (Sartorius,
Germany). Other reagents were analytical grade.
Plant materials
35 samples of H. cordata (table 1), which were collected
from different regions of Guizhou Province in China and
authenticated by Professor Chen Deyuan of Guiyang
Chinese Medical College, were air dried at room
temperature. Voucher specimens were stored in sealed
bottles at the Key Laboratory for Information System of
Mountainous Area and Protection of Ecological
Environment of Guizhou Province, Guizhou Normal
University, until they were required.
224
Standard solution
Preparation of a stock solution is that 16 markers weighed
accurately were dissolved in methanol in a 10mL
volumetric flask. Preparation of working solutions is that
the stock solutions were further diluted with the
appropriate methanol. The solutions prepared were stored
in the dark at 4°C.
Sample solution
Samples that had been pulverized using a homogenizer
were accurately weighed into 100 mL triangular flasks
and then extracted three times at 40°C (30 min each) by
sonication with 30 mL methanol. The extracts were
centrifuged using a centrifuge (Model 80-2, Jinda, Jiangsu)
for 8 min at 4000 r/min and then combined and
concentrated to about 15 mL at 40-50°C using rotary
evaporators (R-210, BUCHI, Switzerland). The
concentrated extracts were diluted to 25mL with methanol,
and then filtered through a 0.45 µm membrane filter.
HPLC conditions
A HPLC system LC-20AT series (Shimadzu, Japan)
including a diode array detector, two pumps, a
thermostated column compartment, an online vacuum
degasser and Chem Station software was performed for
chromatographic
analysis.
All
chromatographic
separations were performed on a reversed-phase Shimpack CLC-ODS (6.0 mm × 150 mm, I.D., 5 µm;
No.61626630). A linear gradient elution using eluent A
(acetonitrile: methanol=11: 5 (v/v)) and eluent B (0.1%
formic acid (m/v)) was carried out for the separations.
The elution program optimized was conducted as follows:
0-5 min, linear gradient 5% A; 5-8 min, linear gradient 516% A; 8-30 min, linear gradient 16-24% A; 30-47 min,
linear gradient 24-32% A; 47-68 min, linear gradient 3264% A; 68-75 min, linear gradient 64% A; 75-78 min,
linear gradient 64-100% A; 78-88 min, linear gradient
100% A; 88-89 min, linear gradient 100-5% A and 89-95
min, linear gradient 5%. The flow rate program was
conducted as follows: 0-5 min, 1.4mL/min; 5-10 min, 1.40.6 mL/min; 10-47 min, 0.6-0.8 mL/min; 47-50 min, 0.61.4 mL/min and 50-95 min, 1.4mL/min. The set detection
wavelength was 345 nm, the volume of injection was
20µL, and the column temperature maintained was 40°C.
DPPH assay
The DPPH assay was performed the standard method
(Brand-Williams et al., 1995) and slightly modified. The
reaction mixture is that a sample solution of H. cordata
(0.3mL) and 0.1mM DPPH (9.7mL) was mixed in
methanol. The reaction mixtures were incubated in the
dark for 30min. The absorbances (A) of the reaction
mixtures were measured on a Cary 100 (Warian, USA) at
515nm by methanol as a blank. The total antioxidant
activity (TAA) was obtained and calculated by the
following equation: TAA (%) =100× [(A control-A
sample) /A control], where A control and A sample is the
Pak. J. Pharm. Sci., Vol.27, No.2, March 2014, pp.223-231
Zhan-nan Yang et al
OH
O
OH
HO
HO
O
HO
OH
O
OH
HO
HO
OH
HO
O
OH
Scopoletin
O
HO
O
Rutin
OH
O
OH
OH
O
OH
OH
O
OH
O
O
O
O
OH
OH
OH
OH
HO
OH
O
OH OH
Vitexin
OH
O
HO
HO
OH
HO
OH
O
O
O
O
OH
Chlorogenic acid
OH
O
HO
H3CO
OH
CH2OH
OH
OH
CH3
HO
OH
O
CH3
HO
O
HO
O
OH
OH
O
O
CH3
O
OH
OH
HO
Afzelin
O
Isoquercitrin
OH
OH
O
CH3
OH
HO
OH
Narirutin
Quercitrin
OH
OH
OH O
HO
O
O
O
HO
O
OH
O
OH
OH
HO
H3CO
O
O
OH
OH
OH
OH
HO
OH
OH
OH
Kaempferitrin
O
H3CO
OCH3
O
Quercetin
OH
O
OCH3
OH
Kaempferol,
O
Chrysosplenol-D
OH
H3CO
O
H3CO
OCH3
OCH3
H3CO
O
O
H3CO
OCH3
OCH3
OH
OCH3
OH
H3CO
OCH3
H3CO
O
OCH3
O
OH
OCH3
OCH3
O
OH
5-Hydroxy-3,4',6,7-tetramethoxyflavone
5-Hydroxy-3,3',4',7-tetramethoxyflavone
Vitexicarpin
O
O
Kaempferol-3,7,4'-trimethyl ether
Fig. 1: Chemical structures of the sixteen markers
mAU(x100)
345nm ,4nm (1.00)
2.0
a
1.5
1.0
0.5
1 Chlorogenic acid
8 Kaempferitrin
2 Scopoletin
Quercitrin
9
3 Vitexin
34
5
4 Rutin
1
2
5 Afzelin
6
8
6 Isoquercitrin
7 Narirutin
7
9
14 5-hydroxy-3, 3', 4', 7-tetramethoxy flavonoids
15 kaempferol-3, 7, 4'-trimethyl ether
16 5-hydroxy-3, 4', 6, 7-tetramethoxy flavonoids
11 Kaempferol
10
10 Quercetin 13 12 Chrysosplenol D
13 Vitexicarpin
11 12
15
16
14
0.0
4.0
mAU(x100) 20
345nm4nm (1.00)
30
40
50
60
70
min
40
50
60
70
min
b
3.0
2.0
1.0
0.0
20
30
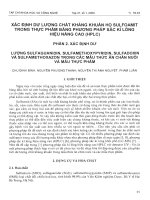
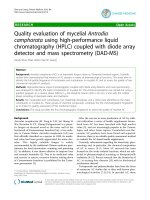
Fig. 2: Representative HPLC-DAD chromatographic profiles of mixed standard solution containing the 16 markers (a)
and the extract of H. cordata batch (samples no. 35) (b) at 345 nm.
Pak. J. Pharm. Sci., Vol.27, No.2, March 2014, pp.223-231
225
Quality evaluation of Houttuynia cordata Thunb. by HPLC-DAD
Table 1: Collection information of the samples and their total antioxidant activity (% TAA) by DPPH assay
No.
Voucher
specimen
1
2
3
4
5
6
7
8
9
10
11
12
13
14
15
16
17
18
19
20
21
22
23
24
25
26
27
28
29
30
31
32
33
34
35
JCS001
JCS002
JCS003
JCS004
JCS005
JCS006
JCS007
JCS008
JCS009
JCS010
JCS011
JCS012
JCS013
JCS014
JCS015
JCS016
JCS017
JCS018
JCS019
JCS020
JCS021
JCS022
JCS023
JCS024
JCS025
JCS026
JCS027
JCS028
JCS029
JCS030
JCS031
JCS032
JCS033
JCS034
JCS035
Sources (From Guizhou province, in China)
Gaoan in Congjiang county (N, 25°43'49.48", E, 109°13'22.31")
Shibantian in Chishui county (N, 28°31'16.27", E, 105°44'20.67")
Fengxiang in Yanhe county (N, 28°34'49.83", E, 108°30'04.96")
Miaoer in Yanhe county (N, 28°31'05.07", E, 108°29'16.83")
Guakou in Jiangkou county (N, 27°43'34.42", E, 108°54'21.53")
Changping in Fanjing mountain (N, 27°53'48.73", E, 108°54'56.64")
Banpotian in Tongren county (N, 27°44'36.10", E, 109°17'17.80")
Zhenjiang in Jiangkou county (N, 27°43'37.16" E, 108°49'56.17")
Guandong in Liling county (N, 26°03'51.20", E, 108°54'18.91")
Tucheng in Daozhen county (N, 28°52'54.26", E, 107°40'51.13")
Xinmin in Luodian county (N, 25°25'08.97", E, 106°47'02.83")
Changkan in Dejiang county (N, 28°19'00.28", E, 108°06'50.31")
Sandaoyan in Yinjiang county (N, 27°29'13.33", E, 108°13'24.17")
Qingqi in Zhenyuan county (N, 27°07'23.86", E, 108°44'57.46"
Majinggang in Wuchuan county (N, 28°33'21.10", E, 107°55'00.66")
Gancun in Zhengan county (N, 28°32'52.03", E, 107°29'39.17")
Dagao in Jianhe county (N, 26°43'24.41", E, 108°26'02.71")
Tiansheng in Zhengan county (N, 28°31'44.04", E, 107°27'44.42")
Guatang in Shiqian county (N, 27°36'05.07", E, 108°16'12.97")
Xiangyang in Dejiang county (N, 28°13'51.51", E, 108°07'35.02")
Gaoyang in Liping county (N, 26°02'26.67", E, 109°06'34.43")
Baiyuan in Fanjing mountain (N, 27°59'25.28", E, 108°32'25.82")
Luotang in Liuzhi county (N, 26°04'27.35", E, 105°10'19.38")
Qingchi in Jinsha county (N, 27°42'59.65", E, 105°56'17.53")
Caijiadi in Dushan county (N, 25°50'18.10", E, 105°33'31.72")
Dongfeng in Guiyang (N, 26°38'39.68", E, 106°49'02.42")
Changtian in Huishui county (N, 26°16'16.43", E, 106°40'41.34")
Dazai in Xinren county (N, 25°22'14.00", E, 105°18'49.52")
Shaoshan in Zhengfeng county (N, 25°22'14.88", E, 105°38'05.94")
Fanjing mountain (N, 27°50'33.63", E, 108°41'20.28")
Guantian in Qinglong county (N, 25°50'38.38", E, 105°13'40.38")
Duimen in Nayong county (N, 26°44'32.07", E, 105°24'39.03")
Hongyan in Bijie (N, 27°20'22.20", E, 105°20'50.07")
Fanjing mountain (N, 27°55'17.43", E, 108°39'35.83")
Caohai in Weining county (N, 26°50'12.60", E,104°05'52.49")
Altitud
(m)
Acquisition
time
159
248
302
331
333
358
382
394
405
443
454
470
497
507
509
533
584
634
634
660
660
726
769
778
993
1004
1060
1282
1328
1411
1479
1537
1658
2393
2555
2010.7.16
2010.7.13
2010.8.9
2010.8.9
2010.8.8
2010.8.2
2010.8.11
2010.8.8
2010.7.16
2010.7. 7
2010.9.1
2010.8.6
2010.8.5
2010.7.20
2010.7.7
2010.7.6
2010.7.20
2010.7.6
2010.8.7
2010.8.5
2010.7.16
2010.8.2
2010.8.20
2010.7.13
2010.7.10
2010.8.23
2010.9.1
2010.7.19
2010.8.17
2010.8.2
2010.8.17
2010.8.4
2010.8.11
2010.8.2
2010.8.10
TAAs
(%) ±
S.D.s
88.9±0.10
89.9±0.11
86.3±0.10
72.6±0.10
72.9±0.12
87.5±0.18
91.2±0.12
90.2±0.21
89.9±0.17
93.2±0.14
88.8±0.32
90.7±0.18
86.9±0.22
62.3±0.14
92.9±1.14
91.4±0.36
88.7±0.17
87.2±0.06
86.2±0.14
87.6±0.10
73.9±0.71
92.5±0.20
88.7±0.51
91.3±0.77
87.0±0.90
55.0±0.31
92.6±0.42
90.1±0.86
71.7±0.63
64.4±0.21
89.1±0.26
88.8±0.44
89.9±0.08
88.3±0.11
52.6±0.16
Notes: The activity data obtained are the average of three analyses ± standard deviations (S.D.s)
absorbance of the control and the tested sample after 30
min, respectively.
RESULTS
Calculations and statistical analyses
Each sample was carried out in triplicate. The data
obtained and calculated by the Excel (2003) were reported
as a mean (n=3). The analysis of variance were followed
by S.D.s and R.S.D.s.. HCA and PCA were undertaken
using SPSS 13.0 (SPSS Inc., USA).
Optimization of the extraction condition
The extraction efficiency was evaluated using methanol,
ethanol and acetonitrile, respectively. Methanol produced
fewer interfering peaks and obtained the highest values
for the contents of 16 compounds. Orthogonal array
design (OAD) based on a four-factor-three-level,
including the following components: number of times the
226
Pak. J. Pharm. Sci., Vol.27, No.2, March 2014, pp.223-231
Zhan-nan Yang et al
sample was subjected to sonication (one, two, and three
times), volume of methanol (20, 30 and 40mL) and
duration of extraction (10, 20, and 30min), was developed
so that the extraction could be optimized. The results
show that the optimized extraction condition was suitable
and appropriate for the analysis.
compounds investigated were determined and compared
using different analytical chromatographic columns
(Shim-pack CLC-ODS, Diamonsil C18 or CAPCELL
PAK C18) with methanol-0.1% formic acid, acetonitrile0.1% formic acid and acetonitrile-methanol-0.1% formic
acid at different programs of gradient elution, respective.
The results showed that the markers investigated could
efficiently been separated by the Shim-pack CLC-ODS
column with a gradient elution using mixed system of
acetonitrile-methanol-0.1% formic acid (fig. 2). After
analyzing the UV spectra for the 16 compounds recorded
by DAD, 345 nm was selected for monitoring the 16
compounds.
1
34
11
22
28
23
31
26
20
32
27
10
25
2
12
19
24
33
13
18
8
9
17
16
3
15
6
7
21
5
4
29
35
14
30
─┐
─┤
─┤
─┼─┐
─┤ │
─┤ │
─┤ ├─┐
─┘ │ │
─┐ │ │
─┼─┘ ├───┐
─┘
│
│
─┬───┤
│
─┘
│
│
─────┘
├─────┐
─┬─┐
│
│
─┘ ├───┐ │
│
─┬─┘
│ │
│
─┘
│ │
│
─┐
├─┘
│
─┤
│
├─────┐
─┼─┐
│
│
D │
─┘ ├───┘
│
│
───┤
│
│
───┘
│
│
─────┬─────────┤
├───────────────┐
─────┘
│
│
│
B
──────┬────────┘
│
│
──────┘
│
│
─┐
│
├───────────┐
II │
C │
─┼───┐
│
─┘
├───────────────┘
│
│
A │
─────┘
│
─────────────────────────────────────┘
I │
───────┬─────────────────────────────────────────┘
───────┘
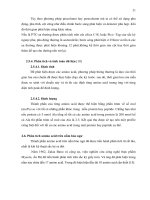
Fig. 3: Dendrogram of HCA for the 35 tested H. cordata
batches.
HPLC method Validation
Calibration curves, Limits of detection (LOD) and
quantitation (LOQ) Standard solutions of different
concentration levels were prepared by diluting the stock
solution of the 16 markers and the appropriate
concentration ranges needed to create the calibration
curves. The respective calibration curves were plotted by
linear regression to the mean peak areas versus
concentrations. LOD and LOQ under the optimal
chromatographic condition were tested at signal-to-noise
Pak. J. Pharm. Sci., Vol.27, No.2, March 2014, pp.223-231
ratios (S/N) of 3 and 10, respectively. The data of LOD
and LOQ are summarized in table 2.
Precision, repeatability and stability The precision was
examined, using the mixed standards solution of
appropriate concentration level and the sample solution
under the optimal extraction conditions, the inter-day and
intra-day variation. Repeatability was tested using
different working solutions prepared independently from
sample no. 35 and one of them was determined every 4 h
over a 20 h period in order to calculate the stability of the
sample solution. The results obtained are expressed in
R.S.D.s, which are shown in table 3.
Recovery Recovery test was undertaken by adding known
amounts of the 16 markers to H. cordata sample no. 35 at
three different levels (80%, 100% and 120%,
respectively). The resultant samples extracted and
processed with the proposed methods were analyzed by
the HPLC method developed. The results are given in
table 4.
B
C
A
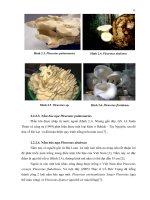
Fig. 4: The scatter plot obtained by PCA of the 35 H.
cordata batches.
Robustness Method robustness test was evaluated using
Shim-pack CLC-ODS (6.0 mm × 150 mm, I.D., 5 µm)
and CAPCELL PAK C18 (150 mm × 4.6 mm, I.D., 5 µm).
The same working solution of H. cordata sample no.35
was separately tested and the percent contents of the 16
compounds were calculated. The mean percent contents
of the 16 compounds (chlorogenic acid, scopoletin,
vitexin,
rutin,
afzelin,
isoquercitrin,
narirutin,
kaempferitrin,
quercitrin,
quercetin,
kaempferol,
chrysosplenol D, vitexicarpin, 5-hydroxy-3,3',4',7tetramethoxy flavonoids, 5-hydroxy-3,4',6,7-tetramethoxy
flavonoids and kaempferol-3,7,4'-trimethyl ether) were
0.161, 0.013, 0.073, 0.049, 0.116, 0.025, 0.030, 0.016,
0.550, 0.018 0.317, 0.018, 0.017, 0.019, 0.027 and
0.011%, respectively, for the Shim-pack CLC-ODS
column and 0.160, 0.014, 0.073, 0.048, 0.117, 0.025,
227
Quality evaluation of Houttuynia cordata Thunb. by HPLC-DAD
Table 2: Regression equation, regression relationship (r2), Linear range, limits of detection (LOD) and quantitation
(LOQ) of the sixteen markers
No.
1
2
3
4
5
6
7
8
9
10
11
12
13
14
15
16
Markers
Chlorogenic acid
Scopoletin
Vitexin
Rutin
Afzelin
Isoquercitrin
Narirutin
Kaempferitrin
Quercitrin
Quercetin
Kaempferol
Chrysosplenol D
Vitexicarpin
5-Hydroxy-3,3',4',7tetramethoxy flavonoids
5-Hydroxy-3,4',6,7tetramethoxy flavonoids
Kaempferol-3,7,4'-trimethyl
ether
Calibration curves a
Linear regression equation
r2
Y = 40828X-23026
0.9991
Y = 120214X-41728
0.9991
Y = 121488X-51466
0.9996
Y = 50329X-31137
0.9991
Y = 46720X-46272
0.9998
Y = 66196X-51166
0.9996
Y = 8028.8X-13330
0.9995
Y = 49297X-16833
0.9994
Y = 92666X-140888
0.9997
Y = 76009X-39600
0.9997
Y = 49723X-34557
0.9991
Y = 45312X-29331
0.9993
Y = 49135X-23556
0.9991
Linear range (µg)
0.0401-1.003
0.0120-0.300
0.0128-0.320
0.0258-0.644
0.0250-0.625
0.0130-0.325
0.0275-0.686
0.0121-0.303
0.0248-0.619
0.0126-0.316
0.0122-0.305
0.0122-0.305
0.0150-0.375
Y = 13397X-15695
0.9995
Y = 33817X-22774
Y = 22670X-11449
0.031, 0.016, 0.552, 0.017 0.316, 0.019, 0.017, 0.020,
0.026 and 0.011%, respectively, for the CAPCELL PAK
C18 column. A t-test (P>0.05) showed that there were no
significant differences between the results from the two
columns, indicating that the proposed HPLC method was
enough for evaluating results with performance.
Sample analysis
The newly validated HPLC-DAD method was applied to
analyze the 16 markers in the H. cordata batches, coded
1-35. The results showed that the contents of the 16
markers in the 35 H. cordata batches were chlorogenic
acid (0.01-0.701%), scopoletin (0.001-0.016%), vitexin
(0.002-0.073%), rutin (0.003-0.170%), afzelin (0.0050.839%), isoquercitrin (0.001-0.119%), narirutin (0.0020.034%), kaempferitrin (0.001-0.019%), quercitrin
(0.002-0.550%), quercetin (0.001-0.018%), kaempferol
(0.001-0.317%), chrysosplenol D (0.001-0.018%),
vitexicarpin
(0.001-0.017%),
5-hydroxy-3,3',4',7tetramethoxy flavonoids (0.002-0.119%), 5-hydroxy-3,4',
6,7-tetramethoxy
flavonoids
(0.001-0.077%)
and
kaempferol-3,7,4'-trimethyl
ether
(0.002-0.142%),
respectively. The contents of the markers varied
significantly in the 35 H. cordata batches.
Antioxidant activity analysis
The antioxidant activities of the 35 H. cordata batches
were analyzed by DPPH assay. The screening results are
listed in table 1 and show that the TAAs of batch nos. 4, 5,
14, 21, 29, 30 and 35 were 52.6-73.9% and the others
were 86.2-92.5%.
228
LOD (ng)
LOQ (ng)
0.275
0.088
0.119
0.090
0.172
0.135
0.142
0.269
0.051
4.208
0.111
0.076
0.217
0.916
0.292
0.395
0.301
0.575
0.451
0.474
0.896
0.169
14.028
0.370
0.253
0.725
0.0190-0.474
0.124
0.413
0.9991
0.0123-0.308
0.114
0.380
0.9995
0.0195-0.488
0.257
0.855
DISCUSSION
HCA of the samples
The contents of the 16 markers and the TAA were defined
as 17 characteristics in the analysis so that the H. cordata
samples could be analyzed, differentiated and classified
(fig. 3), which revealed the relationships among the H.
cordata samples. The 35 samples of H. cordata were
divided into two main clusters. Sample nos. 14 and 30
were in cluster I and the other samples were in cluster II,
which was subdivided into two subgroups. Sample no. 35
was in subgroup A, and the others were in subgroup B,
which was further subdivided into another two subgroups.
Sample nos. 4, 5, 21 and 29 were in subgroup C and the
others were in subgroup D. The results obtained indicated
that tested samples which had similar chemical profiles
and TAAs were divided into the same group.
PCA of the samples
The contents of the 16 markers and the TAA were
analyzed as variables, which were then translated
mathematically into two main comprehensive factors in
order to analyze the samples. The 35 H. cordata batches
were further analyzed and classified using PCA. The
scatter plot is presented in fig. 4, where each H. cordata
batch was represented as a marker. It is noticeable that the
35 H. cordata batches were clearly clustered into three
domains. Sample nos. 4, 5, 14, 21 and 30 were in domain
A, nos. 29 and 35 were in domain B and the others were
in domain C. The results were similar to those obtained
using HCA.
Pak. J. Pharm. Sci., Vol.27, No.2, March 2014, pp.223-231
Zhan-nan Yang et al
Table 3: Intra- and Inter-day variability, repeatability and stability for the assay of the sixteen markers
No.
1
2
3
4
5
6
7
8
9
10
11
12
13
14
15
16
Markers
Chlorogenic acid
Scopoletin
Vitexin
Rutin
Afzelin
Isoquercitrin
Narirutin
Kaempferitrin
Quercitrin
Quercetin
Kaempferol
Chrysosplenol D
Vitexicarpin
5-Hydroxy-3,3',4',7-tetramethoxy flavonoids
5-Hydroxy-3,4', 6,7-tetramethoxy flavonoids
Kaempferol-3,7,4'-trimethyl ether
Mean (%)
0.0160
0.0012
0.0070
0.0047
0.0115
0.0024
0.0031
0.0015
0.0551
0.0019
0.0314
0.0017
0.0018
0.0016
0.0025
0.0012
Mean (%)a
0.0161
0.0013
0.0073
0.0049
0.0116
0.0025
0.0030
0.0016
0.0550
0.0018
0.0317
0.0018
0.0017
0.0019
0.0027
0.0011
Precision (n = 6)
Inter-day
R.S.D.s (%)
Average peak area
3.43
2015630.2
2.05
617665.3
2.99
1767481.5
1.41
1497883.3
2.70
1338952.2
1.99
917986.0
2.38
235946.7
2.29
44016.3
3.07
2544842.0
2.10
1058386.8
1.93
641811.2
3.19
587375.8
2.04
806094.3
2.41
272086.8
2.52
93695.3
3.39
87142.7
Precision (n = 6)
Intra-day
R.S.D.s (%)
Average peak areab
1.25
1998963.5
2.43
615998.7
2.59
1767481.5
2.77
1494550.0
2.45
1340618.8
1.79
921319.3
2.67
237446.7
2.15
43516.3
2.88
2511508.7
2.38
1041720.2
2.92
640144.5
2.94
585709.2
2.54
806094.3
2.94
271253.5
2.49
93862.0
2.69
87092.7
R.S.D.s (%)
3.03
2.95
2.59
2.46
2.71
1.19
1.45
2.27
3.47
3.12
2.93
3.32
2.54
3.42
2.72
2.60
Repeatability
Mean
R.S.D.s
(%)
(%)
0.0159
2.31
0.0014
1.23
0.0075
1.54
0.0050
2.07
0.0117
2.13
0.0026
1.25
0.0032
1.64
0.0017
2.75
0.0558
2.89
0.0017
1.55
0.0320
0.92
0.0016
1.94
0.0015
2.00
0.0017
1.04
0.0028
1.47
0.0010
2.80
R.S.D.s (%)
1.05
2.13
2.49
2.67
0.92
2.23
1.46
2.51
1.98
1.80
2.02
1.14
1.19
1.63
2.92
2.18
Stability
Mean
R.S.D.s
(%)
(%)
0.0157
1.05
0.0012
0.43
0.0075
1.89
0.0048
1.77
0.0112
2.12
0.0027
0.59
0.0032
1.67
0.0017
3.18
0.0552
0.88
0.0016
2.30
0.0318
2.02
0.0017
2.01
0.0016
3.33
0.0020
2.27
0.0026
3.40
0.0011
2.95
Sample solution. bStandard mixture solution.
CONCLUSION
In this study, chlorogenic acid, scopoletin, vitexin, rutin,
afzelin, isoquercitrin, narirutin, kaempferitrin, quercitrin,
quercetin, kaempferol, chrysosplenol D, vitexicarpin, 5hydroxy-3,3',4',7-tetramethoxy flavonoids, 5-hydroxy3,4',6,7-tetramethoxy flavonoids and kaempferol-3,7,4'trimethyl ether in H. cordata were simultaneously
analyzed using a HPLC-DAD method developed by this
study. It is the first reported that these 16 markers have
been determined simultaneously with acceptable
performances for linearity, repeatability, precision,
accuracy and robustness for 90 min. Furthermore, the
method developed was successfully used to test 35 H.
cordata batches. HCA and PCA were performed in order
Pak. J. Pharm. Sci., Vol.27, No.2, March 2014, pp.223-231
to classify and differentiate the 35 H. cordata batches,
based on the contents of the 16 markers and the TAA.
There is some evidence that although the activity of the
compounds varied significantly, their activities may
possess uniform anti-oxidant activities and potentially
synergistic effects. The blending quality evaluation has
been shown to be able to save and guide rational herb
resources use in medicinal and herbal production.
ACKNOWLEDGMENTS
This work was supported by grants from the National
Natural Science Foundation of P.R China (No. 81260641
and 31060056).
229
Quality evaluation of Houttuynia cordata Thunb. by HPLC-DAD
Table 4: Recovery of the sixteen markers in H. cordata
No.
Markers
1
Chlorogenic acid
2
Scopoletin
3
Vitexin
4
Rutin
5
Afzelin
6
Isoquercitrin
7
Narirutin
8
Kaempferitrin
9
Quercitrin
10
Quercetin
11
Kaempferol
12
Chrysosplenol D
13
Vitexicarpin
14
5-Hydroxy-3,3',4',7tetramethoxy flavonoids
15
5-Hydroxy-3,4',6,7tetramethoxy flavonoids
16
Kaempferol-3,7,4'-trimethyl
ether
Samples
S1a
S2b
S3c
S1
S2
S3
S1
S2
S3
S1
S2
S3
S1
S2
S3
S1
S2
S3
S1
S2
S3
S1
S2
S3
S1
S2
S3
S1
S2
S3
S1
S2
S3
S1
S2
S3
S1
S2
S3
S1
S2
S3
S1
S2
S3
S1
S2
S3
MOriginal
(mg )
0.331
0.325
0.322
0.027
0.027
0.026
0.149
0.146
0.145
0.100
0.098
0.097
0.238
0.234
0.231
0.051
0.051
0.050
0.062
0.061
0.061
0.032
0.032
0.031
1.127
1.108
1.097
0.037
0.037
0.036
0.650
0.638
0.632
0.036
0.035
0.035
0.036
0.035
0.035
0.039
0.039
0.038
0.054
0.053
0.053
0.023
0.023
0.023
Contents
MAdded (mg)
0.265
0.322
0.386
0.022
0.027
0.032
0.119
0.145
0.174
0.080
0.098
0.117
0.190
0.229
0.278
0.041
0.050
0.060
0.050
0.061
0.073
0.026
0.032
0.038
0.902
1.109
1.317
0.030
0.037
0.043
0.520
0.630
0.759
0.029
0.035
0.042
0.029
0.035
0.042
0.032
0.039
0.046
0.044
0.053
0.064
0.019
0.023
0.027
MFound
(mg)
0.593
0.652
0.704
0.049
0.054
0.058
0.269
0.294
0.320
0.178
0.196
0.214
0.427
0.461
0.515
0.093
0.101
0.110
0.112
0.123
0.133
0.058
0.063
0.069
2.033
2.209
2.399
0.067
0.074
0.081
1.159
1.263
1.387
0.065
0.071
0.076
0.064
0.070
0.077
0.071
0.078
0.084
0.098
0.107
0.117
0.042
0.046
0.050
Recovery
(%)
99.12
101.64
98.96
99.46
101.15
100.37
101.21
101.98
100.52
98.25
99.18
100.38
99.69
99.12
102.01
100.91
101.11
99.50
98.56
100.71
99.31
100.62
98.94
99.10
100.4
99.25
98.88
100.12
101.56
102.10
98.10
99.21
99.47
101.65
102.21
98.43
99.19
100.26
101.42
100.54
99.56
98.12
99.42
100.48
101.23
102.54
100.21
99.89
Mean Recovery
(%)±R.S.D.s
99.91±1.52
100.33±1.78
101.23±2.34
99.27±1.82
100.27±1.50
100.51±1.33
99.53±2.36
99.55±1.24
99.51±1.42
101.26±1.11
98.93±2.76
100.76±1.61
100.29±1.89
99.41±0.98
100.38±2.02
100.88±2.14
% Recovery = ((Mfound−Moriginal)/Madded) ×100. The results obtained showed that the proposed method was accurate for the determination of the 16
markers.
a
The samples added 80% of the known amounts. b The samples added 100% of the known amounts. c The samples added 120% of the known
amounts.
230
Pak. J. Pharm. Sci., Vol.27, No.2, March 2014, pp.223-231
Zhan-nan Yang et al
REFERENCES
Brand-Williams W, Cuvelier ME and Berset C (1995).
Use of a free radical method to evaluate antioxidant
activity. Lebensm-Wiss. Technol., 28: 25-30.
Chang JS, Chiang CC, Liu LT, Wang KC and Lin CC
(2001). Antileukemic activity of Bidens pilosa L. var.
minor (Blume) Sherff and Houttuynia cordata Thunb.
Am. J. Chin. Med., 29: 303-312.
Chen YY, Liu J, Chen CM, Chao PY and Chang TJ
(2003). A study of the antioxidantive and
antimutagenic effects of Houttuynia cordata Thunb.
Using an oxidized frying oil-fed model. J. Nutr. Sci.
Vitaminol., 49: 327-333.
Choi CW, Kim SC, Hwang SS, Choi BK, Ahn HJ, Lee
MY, Park SH and Kim SK (2002). Antioxidant activity
and free radical scavenging capacity between Korean
medicinal plants and flavonoids by assay-guided
comparison. Plant Sci., 163: 1161-1168.
Jong TT and Jean MY (1993). Alkaloids from Houttuynia
cordata. J. Chin. Chem. Soc., 40: 301-303.
Lau KM, Lee KM, Koon CM, Cheung CSF, Lau CP, Ho
HM, Lee MYH, Au SWN, Cheng CHK, Lau CBS,
Tsui SKW, Wan DCC, Waye MMY, Wong KB, Wong
CK, Lam CWK, Leung PC and Fung KP (2008).
Immunomodulatory and anti-SARS activities of
Houttuynia cordata. J. Ethnopharmacol., 118: 79-85.
Meng J, Dong XP, Leung KS, Jiang ZH and Zhao ZZ
(2006). Study on chemical constituents of flavonoids in
fresh herb of Houttuynia cordata. China J. Chin. Mat.
Med., 31: 1335-1337.
Meng J, Leung KSY, Dong XP, Zhou YS, Jiang Z and
Zhao ZZ (2009). Simultaneous quantification of eight
bioactive components of Houttuynia cordata and
related Saururaceae medicinal plants by on-line high
performance liquid chromatography-diode array
detector-electrospray mass spectrometry. Fitoterapia.,
80: 468-474.
Pak. J. Pharm. Sci., Vol.27, No.2, March 2014, pp.223-231
Meng J, Leung KS, Jiang ZH, Dong XP, Zhao ZZ and Xu
LJ (2005). Establishment of HPLC-DAD-MS
fingerprint of fresh Houttuynia cordata. Chem. Pharm.
Bull., 53: 1604-1609.
Nishiya H, Ishiwata K, Komatsu K, Nakata O, Kitamura
K and Fujii S (1988). Platelet aggregation inhibitors
from Jyu-yaku (Houttuyniae Herb). Chem. Pharm.
Bull., 36: 1902-1904.
Nuengchamnong N, Krittasilp K and Ingkaninan K (2009).
Rapid screening and identification of antioxidants in
aqueous extracts of Houttuynia cordata using LC-ESIMS coupled with DPPH assay. Food Chem., 117: 750756.
Proebstle A, Neszmelyi A, Jerkovich G, Wagner H and
Bauer R (1994). Novel pyridine and 1,4dihydropyridine alkaloids from Houttuynia cordata.
Nat. Prod. Lett., 4: 235-240.
The State Pharmacopoeia Committee of P R China,
Pharmacopoeia of People’s Republic of China.
Chemical Industry Press Beijing, 2010, pp 118-119.
Wu LS, Si JP, Yuan XQ and Shi XR (2009). Quantitative
variation of flavonoids in Houttuynia cordata from
different geographic origins in China. Chin. J. Nat.
Med., 7: 40-46.
Wu W, Zheng YL, Chen L, Wei YM and Yan ZH (2005a).
Genetic diversity among the germplasm resources of
the genus Houttuynia Thunb. in China based on RAMP
markers. Genet. Resour. Crop. Evol., 52: 473-482.
Wu W, Zheng YL, Chen L, Wei YM, Yang RW and Yan
ZH (2005b). Evaluation of genetic relationships in the
genus Houttuynia Thunb. in China based on RAPD and
ISSR markers. Biochem. Syst. Ecol., 33: 1141-1157.
Xu YW, Zou YT, Husaini AM, Zeng JW, Guan LL, Liu
Q and Wu W (2011). Optimization of potassium for
proper growth and physiological response of
Houttuynia cordata Thunb. Environ. Exp. Bot., 71:
292-297.
231