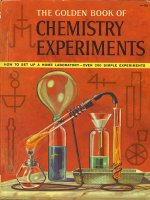
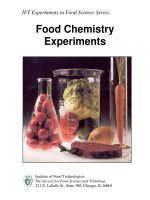
Ebook Chemistry experiments Part 2
Bạn đang xem bản rút gọn của tài liệu. Xem và tải ngay bản đầy đủ của tài liệu tại đây (4.26 MB, 104 trang )
11. Solutions and
Spectrophotometry
Topic
A spectrophotometer can be used to analyze the transmission of light
through different solutions.
Introduction
Solutions are types of homogenous mixtures in which one substance,
the solute, is dissolved in a solvent. Solutions can be described as
concentrated, where there is a large amount of solute dissolved in a
solvent, or dilute, where there is a small amount of solute. However, these
descriptions are qualitative and are generally not very precise. Solutions
can also be described quantitatively by using molarity (M), the number of
moles (mol) of solute per liter of solution. A solution with a high molarity is
more concentrated than one with a low molarity.
Many chemical solutions are transparent, and the molarity cannot be
known simply by looking at the solutions’ color. However, with some
solutions, the color of the solution changes as the concentration changes.
In these cases, the solutions can be analyzed using a spectrophotometer
(Figure 1a). Inside a spectrophotometer, a beam of light passes through
a monochromator, a device that changes the beam so that it is made
up of only one wavelength of light. This modified beam travels through
the sample to be tested, which is held in a cuvette, a thin glass tube.
A sensor on the other side of the sample detects the light, and the
device calculates the amount of light that is transmitted and the amount
absorbed by the solution (Figure 1b). In this experiment, you will create
copper (II) sulfate solutions of known concentrations, then test their
absorbance using a spectrophotometer. You will use your data to create a
graph of concentration versus light absorbance. Then, using the graph you
created, you will determine the concentration of an unknown solution of
copper (II) sulfate.
Time Required
60 minutes
74
© 2011 Facts on File. All Rights Reserved.
11. Solutions and Spectrophotometry
75
digital
status
readout indicators
wavelength
control
sample
compartment
transmittance/absorbance
control
power switch/zero
control
a. spectrophotometer
Figure 1
WALKER/WOOD Book 11 Chemistry Figure 1-(11-11-1)
source
monochromator
sample
b. the spectrophotometry process
Figure 2
Figure 1
WALKER/WOOD Book 11 Chemistry Figure 2-(11-11-2)
Materials
2
2
2
2
2
spectrophotometer
cuvettes
small beakers
distilled water
lens wipes
© 2011 Facts on File. All Rights Reserved.
detector
76
CHEMISTRY ExpERIMEnTS
2
2
1 molar (M) copper (II) sulfate (CuSO4) solution
2
2
2
2
2
2
10-milliliter (ml) volumetric flask with stopper
copper (II) sulfate solution of unknown concentration (between
0.1 and 1.0 M)
graduated cylinder
test-tube rack
graph paper
goggles
science notebook
Safety Note
Goggles must be worn at all times during this
experiment. Use caution when using chemicals. please review and
follow the safety guidelines at the beginning of this volume.
Procedure
1.
2.
3.
Turn on the spectrophotometer and allow it to warm up.
Label six cuvettes on the top rim with the following: 0 M, 0.25 M,
0.5 M, 0.75 M, 1.0 M, and unknown. Place the cuvettes in a testtube rack.
Your teacher will provide a 1.0 M solution of copper (II) sulfate and
distilled water (0.0 M). You will need to prepare the 0.25 M, 0.5 M,
and 0.75 M solutions of copper (II) sulfate by performing dilutions of
the 1.0 M solution. To do so:
a. Use the formula M1V1=M2V2, where V equals volume, to calculate
the volume of 1.0 M solution you will need to produce 10-ml
solutions with the desired concentrations (0.25 M, 0.5 M, and
0.75 M). Record your calculated values in the last column of
Data Table 1.
b. Measure out the calculated volume of 1.0 M CuSO4 needed for
the 0.25 M dilution using a graduated cylinder.
c. Carefully pour the measured amount of solution into a 10 ml
volumetric flask and dilute up to the line with distilled water.
Place the stopper in the flask and invert several times to mix.
d. Pour the solution into a small labeled beaker and set aside for
use in step 4.
© 2011 Facts on File. All Rights Reserved.
11. Solutions and Spectrophotometry
77
e. Repeat the dilution (steps b through d) for the two remaining (0.5
M and 0.75 M) dilutions.
4. Using a graduated cylinder, measure 2 ml of distilled water and add
it to the 0.0 M cuvette. Repeat with 2 ml of each of the remaining
known solutions (0.25 M, 0.5 M, 0.75 M, and 1.0 M) and the
unknown solution obtained from your teacher.
5. Answer Analysis questions 1 and 2.
6. Set the wavelength on the spectrophotometer to 610 nanometers
(nm) (refer to Figure 1a) and switch the mode to measure
absorbance, not transmittance. Be sure that the sample cover is
empty and closed, then turn the zeroing knob to “0 percent.”
7. Clean the outer surface of the 0.0 M distilled water cuvette with a
lens wipe to ensure that there are no fingerprints on the part of the
tube that will be read.
8. Place the 0.0 M cuvette into the sample well of the
spectrophotometer and close the lid. This tube will serve as your
“blank.” Set the control knob to “0 percent absorbance.” Remove
the cuvette and return it to the test-tube rack.
9. Wipe the 0.25 M cuvette and place it in the sample well. Close
the lid and wait for the absorbance reading to stabilize. Record
the percentage absorbance reading on Data Table 2. Remove the
cuvette and return it to the test-tube rack.
10. Repeat step 9 with the 0.5 M, 0.75 M, 1.0 M, and unknown
cuvettes.
11. Empty your samples into the appropriate waste container as
specified by your teacher.
Data Table 1
Molarity of
solution (M1)
Volume of solution
(V1)
Molarity of stock
solution (M2)
0.25 M
10 mL
1.0 M
0.5 M
10 mL
1.0 M
0.75 M
10 mL
1.0 M
© 2011 Facts on File. All Rights Reserved.
Volume of stock
solution (V2)
78
CHEMISTRY ExpERIMEnTS
Data Table 2
Sample
0 M CuSO4
% Absorbance
0.0
0.25 M CuSO4
0.5 M CuSO4
0.75 M CuSO4
1.0 M CuSO4
Unknown
Analysis
Describe the appearance of the five solutions you will test in this
experiment.
2. Which solution do you think will have the lowest light absorbance?
The highest? Why?
3. Why was it necessary to use a “blank” cuvette containing only
distilled water in this experiment?
4. Graph the results of this lab using the information from Data
Table 2. The molarity is the dependent variable (X-axis) and the
absorbance is the independent variable (Y-axis). Plot the molarity
versus absorbance for the known solutions using dots, and then
connect them with lines.
5. How is the molarity of copper (II) sulfate related to the absorbance
of light that passes through it?
6. How do your results compare with your prediction in Analysis
question 2? Were the results as you expected?
7. Using the line created from your known data on your graph, plot the
absorbance of the unknown solution and determine the molarity
based on its location on the line graph. What was the molarity of the
unknown solution?
1.
© 2011 Facts on File. All Rights Reserved.
11. Solutions and Spectrophotometry
8.
79
What are some sources of error in this experiment that could have
caused your results to be different than they should have been?
What’s Going On?
Copper (II) sulfate is a gray compound that turns blue when it is
hydrated. Concentrated solutions of CuSO4 have a darker blue color
than dilute solutions. Blue substances appear blue because they
reflect blue light but absorb all other colors within the visible spectrum
(see Figure 3). Blue solutions such as copper (II) sulfate most readily
absorb orange light, which ranges from 585 to 620 nm. When analyzed
using a spectrophotometer set to a wavelength within this range, the
darker solutions absorb more of the light than the pale ones. Since the
absorbance was set to 0 percent with pure water, as the concentration of
the CuSO4 increased, the amount of light absorbance increased as well.
Impurities in the solution as well as smudges on the cuvettes can cause
the readings to be different from those that are expected.
higher
frequency
400
lower
frequency
500
600
wavelength (in nm)
700
800
Figure 3
Figure 3
Visible
spectrum
Connections
Spectrophotometry
is frequently
for analytical
purposes. Since the
WALKER/WOOD
Bookused
11 Chemistry
Figure 3-(11-11-3)
wavelength can be adjusted within a large range, a spectrophotometer can
be calibrated to analyze a wide range of solutions. Spectrophotometric
analysis can reveal the purity of medications and the concentrations of
compounds within those medications. For example, the percentage of
aspirin in over-the-counter aspirin tablets can be analyzed due to the
reaction that aspirin has with iron (III) ion to produce an orange color.
Spectrophotometry can also be used to analyze samples that absorb
light outside of the visible spectrum, such as DNA and RNA. Since
© 2011 Facts on File. All Rights Reserved.
80
CHEMISTRY ExpERIMEnTS
DNA and RNA nucleotides absorb large amounts of ultraviolet light, the
concentration of nucleic acids within a sample can be analyzed based on
the absorbance of light in the 260-to-280 nm range.
Want to Know More?
See appendix for Our Findings.
Further Reading
Olson, John. “Determining Concentration using a Spectrophotometer.”
Available online. URL: />chemistry/spec.html. Accessed July 17, 2010. Olson, of Arlington High
School, St. Paul, Minnesota, explains how a spectrophotometer works on
this Web page.
“Spectroscopy Fact Sheet: How Astronomers Study Light.” Exploring Our
Universe: From the Classroom to Outer Space. Available online. URL:
Accessed July
17, 2010. This resource, part of the FUSE (Far Ultraviolet Spectroscopic
Explorer) Project’s Public Outreach and Education program, discusses
characteristics of visible light and the way these characteristics are
studied with spectroscopy.
Volland, Walt. “Spectroscopy Lab.” Available online. URL: http://www.
trschools.com/staff/g/cgirtain/Weblabs/spectrolab.htm. Accessed July
17, 2010. On this Web page, Volland discusses the visible spectrum and
explains how spectroscopy works.
© 2011 Facts on File. All Rights Reserved.
12. Endothermic and Exothermic
Reactions
Topic
Endothermic and exothermic reactions release or absorb heat as they
occur.
Introduction
In all phases of matter, atoms are in constant motion. Atoms in gases
have a free range of motion because the particles are spread very far
apart. Therefore, the particles in a gas have a large amount of kinetic
energy, the energy of motion. Particles in a liquid have less kinetic energy
than gases, but more than solids. The atoms in a solid are moving, but
they are locked into a structure that will not allow them to do more than
just vibrate in place (Figure 1). As any type of particle moves, it gives off
energy in the form of heat. The more kinetic energy a particle has the
more heat it will give off to its surroundings; that heat can be measured
as a change in temperature.
solid
liquid
gas
temperature
kinetic energy
Figure
1
Figure 1
The movement of particles in solids, liquids, and gases
WALKER/WOOD Book 11 Chemistry Figure 1-(11-12-1)
© 2011 Facts on File. All Rights Reserved.
81
82
CHEMISTRY ExpERIMEnTS
When a chemical reaction releases energy to its environment the
temperature of the environment rises. Such reactions are described
as exothermic. In exothermic reactions, heat is released when particle
movement slows and when high-energy bonds between atoms are broken.
Therefore, water freezing to form ice and combustion reactions are both
examples of exothermic reactions. The opposite of exothermic reactions
are endothermic reactions, which absorb energy from their environment.
In an endothermic reaction such as the melting of ice, the surrounding
environment loses heat. Chemical reactions that do not occur without
the addition of energy are endothermic. In this experiment, you will
perform endothermic and exothermic reactions, monitor the changes in
temperature that occurs in the surrounding environment, and plot your
results on a graph.
Time Required
25 minutes for Part A
25 minutes for Part B
Materials
2
2
2
2
2
2
2
2
2
barium hydroxide octahydrate (solid)
2
2
2
2
2
stirring rod
ammonium chloride (solid)
magnesium metal strips
6 molar (M) hydrochloric acid
baking soda
2 beakers (about 250 milliliters [ml])
electronic balance
disposable weigh boats
small block of wood (slightly larger than the diameter of the
beaker)
wash bottle filled with distilled water
Celsius (C) thermometer
hot mitts
goggles
© 2011 Facts on File. All Rights Reserved.
12. Endothermic and Exothermic Reactions
2
2
83
scissors
science notebook
Safety Note
Goggles must be worn at all times during this
experiment. Use extreme caution with the chemicals used in this lab.
perform the experiment in a fume hood if possible and never directly
sniff the beakers. please review and follow the safety guidelines at the
beginning of this volume.
Procedure, Part A: Endothermic Reaction
1.
2.
3.
4.
5.
6.
7.
8.
Copy Data Tables 1 and 2 into your science notebook. Leave room
to extend beyond 6 minutes.
Measure out 17 grams (g) of ammonium chloride and 32 g of
barium hydroxide octahydrate into separate weigh boats.
Place a block of wood flat on your lab table. Wet the entire top
surface of the wood using a wash bottle. Wet the bottom and sides
of a beaker, then place it on top the block of wood.
Pour the barium hydroxide powder into the beaker. Measure the
temperature of the beaker containing the solid. Record this as your
initial temperature (0 minutes [min]) on Data Table 1.
Add the solid ammonium chloride to the beaker and stir to mix.
While keeping the beaker on the block of wet wood, stir the contents
of the beaker and record the temperature every 60 seconds (sec)
until the temperature remains constant for two readings. Record
each temperature reading on Data Table 1.
Lift the beaker and observe. The mixture should have become cold
enough to freeze the beaker to the block of wood.
The contents of the beaker can be safely washed down the sink
with water.
Procedure, Part B: Exothermic Reaction
Add approximately 50 ml of 6M hydrochloric acid to a beaker. Place
a thermometer in the beaker and record the initial temperature (0
min) on Data Table 2.
2. Cut a 4-inch (in.) (10.2-centimeter [cm]) piece of magnesium ribbon
into small pieces (about 0.25 in. [0.6 cm] long).
1.
© 2011 Facts on File. All Rights Reserved.
84
CHEMISTRY ExpERIMEnTS
Add the magnesium ribbon pieces to the hydrochloric acid and stir
to mix.
Record the temperature every 60 sec until the temperature remains
constant for two readings. Record each temperature reading on
Data Table 2.
Neutralize the solution by adding baking soda to the beaker until
bubbling ceases. Wash the contents of the beaker down the drain.
3.
4.
5.
Data Table 2
Data Table 1
Time (min)
Temperature (°C)
Time (min)
0
0
1
1
2
2
3
3
4
4
5
5
6
6
Temperature (°C)
Analysis
1.
2.
3.
The reaction between barium hydroxide and ammonium chloride
forms ammonia gas, aqueous barium chloride, and liquid water.
Write the balanced chemical equation that occurs in this reaction.
Describe the visible evidence that a reaction was occurring between
the barium chloride and ammonium chloride.
Graph the temperature changes that occurred over time in the
endothermic reaction as a line graph.
© 2011 Facts on File. All Rights Reserved.
12. Endothermic and Exothermic Reactions
85
4. The reaction between magnesium metal and aqueous hydrochloric
acid forms hydrogen gas and aqueous magnesium chloride. Write
the balanced chemical equation for the reaction that occurs.
5. How could you tell that a reaction was occurring between the
magnesium and hydrochloric acid?
6. Graph the temperature changes that occurred over time in the
exothermic reaction as a line graph.
7. Compare the graphs of the endothermic and exothermic reactions.
How are the two graphs different?
What’s Going On?
All chemical reactions require a certain amount of activation energy
to begin the reaction process. Endothermic reactions require more
activation energy to get started than exothermic ones do. As a result,
endothermic reactions absorb heat energy from their environment to drive
the reaction forward. Figure 2 shows the amount of energy needed to
begin an endothermic reaction. A large amount of energy is required for
the reactants to form the activated complex, which will react and result in
the products formed in the reaction. After the initial energy, known as the
activation energy (Ea), is reached the reaction proceeds spontaneously
and will generally release a small amount of energy. However, the small
amount of energy given off in an endothermic reaction is not enough to
compensate for the extra energy required to start the reaction, and there
is still a marked temperature difference in the environment, noted as ∆H,
or the change in heat experienced in the environment. As the reaction
proceeds, the temperature of the surrounding environment decreases
because the heat is transferred from the surroundings to the reactants.
When barium hydroxide and ammonium chloride react, the reaction needs
so much energy that the temperature of the surrounding environment
drops below the freezing point of water.
In an exothermic reaction, the amount of activation energy needed is
much lower than in an endothermic one. These reactions may initially
absorb a small amount of heat, but as the reaction progresses, a much
greater amount of energy is given off in the form of heat. In Figure 3,
you can see that the amount of activation energy (Ea) needed to form
the activated complex is much lower than in an endothermic reaction.
After the activated complex is formed, the formation of products occurs
spontaneously and a large amount of energy is released. Even though a
© 2011 Facts on File. All Rights Reserved.
86
CHEMISTRY ExpERIMEnTS
potential energy (kJ)
small amount of energy is used to begin the reaction, a great deal more
energy is released than was needed as activation energy. The additional
energy released is given off as heat, indicated by ∆H. Exothermic
reactions release a large amount of energy due to the breaking of highenergy bonds between atoms or the increase in kinetic energy of the
products. In the reaction between magnesium metal and hydrochloric
acid, the metal ionizes and forms an aqueous solution and chloride ions
from the acid. The hydrogen from the aqueous acid solution is released
as a gas. Since the products have more kinetic energy than the reactants,
energy is released in the form of heat.
activated complex
products
activation
energy
Ea
ΔH
reactants
reaction pathway
Figure 2
Endothermic reaction
potential energy (kJ)
Figure 2
activated complex
activated
Ea
energy Book 11 Chemistry
WALKER/WOOD
Figure 2-(11-12-2)
reactants
ΔH
products
reaction pathway
Figure 3
Exothermic
Figurereaction
3
WALKER/WOOD Book 11 Chemistry Figure 3-(11-12-3)
© 2011 Facts on File. All Rights Reserved.
12. Endothermic and Exothermic Reactions
87
Connections
In exothermic reactions, the release of a large amount of energy occurs
all at once. For example, in the combustion of a hydrocarbon, the energy
is discharged in one large explosion. You might see this type of reaction
if an entire container of octane, the hydrocarbon in gasoline, were set
on fire. The container would erupt into a large flame that releases heat
in a huge burst into the environment. However, if that same container of
gasoline is put into a combustion engine of an automobile, the energy is
released slowly in smaller steps. In a combustion engine, small amounts
of gasoline are ignited in enclosed cylinders within the engine. As a result,
the quantity of energy released is controlled. Energy is still given off as
heat, but it is much more efficient than a large explosion that would have
occurred if the gasoline were simply to go through one large combustion
reaction. In this way, the energy released by breaking the bonds in the
hydrocarbon can be used to do work.
Want to Know More?
See appendix for Our Findings.
Further Reading
“Endothermic and Exothermic Processes.” Mr. Kent’s Chemistry Page.
Available online. URL: />EndoExo.htm. Accessed July 17, 2010. Two short video clips on this Web
page demonstrate endothermic and exothormic reactions.
“Energy Diagrams.” Mr. Guch’s Cavalcade O’Chemistry. Available online.
URL: Accessed July
17, 2010. Mr. Guch, a chemistry teacher, explains the transfer of energy
during a chemical reaction on this Web page.
Jones, Larry. “Endothermic vs. Exothermic Reactions,” June 27, 2009.
Pickens County School District. />endoexothermic.htm. Accessed July 17, 2010. On his school Web
site, Larry Jones provides concise, easy-to-understand explanations of
endothermic and exothermic chemical reactions.
© 2011 Facts on File. All Rights Reserved.
13. Finding Molar Mass
Topic
The ideal gas law can be used to determine the molar mass of butane.
Introduction
Gases behave differently from solids or liquids because their particles
move very rapidly and are spread far apart. Gases take the shape of
any container that they occupy. They can be pressurized by adding more
particles or increasing the temperature inside of a fixed-volume container.
All gases have similar characteristics; therefore, all gases behave in a
fairly predictable manner. The pressure, volume, number of moles, and
temperature of a gas are all related. Any one of these variables can be
determined when the others are known using the ideal gas equation:
PV= nRT
in which P represents pressure, measured in either atmospheres (atm) or
kilopascals (kPa); V represents volume in liters; n stands for the number
of mol of a gas; and T is the temperature in Kelvins (K). R is the ideal gas
constant, which is either
0.0821 L ×
atm
kPa
× K or 8.31 L ×
× K,
mol
mol
depending on the units that were used to measure the pressure.
The ideal gas equation is very versatile and can be rearranged to solve
for any of the variables in it. In this experiment, you will measure the
pressure, volume, and temperature of butane, the gas found in disposable
lighters (Figure 1). From this data, you determine the number of moles of
butane and the mass of butane collected during the experiment along with
the molar mass of butane.
Time Required
45 minutes
88
© 2011 Facts on File. All Rights Reserved.
13. Finding Molar Mass
89
Figure 1
Disposable butane lighter
Figure 1
Materials
2
2
2
2
2
WALKER/WOOD
11 Chemistry Figure 1-(11-13-1)
disposable
butaneBook
lighter
2
2
2
2
2
2
access to water
hair dryer
electronic balance
50-milliliter (ml) graduated cylinder
plastic container or trough for holding water (at least 12 inches
[in.] [30 centimeters (cm)] deep)
barometer
vapor pressure table
Celsius (C) thermometer
periodic table of elements (see page 175)
science notebook
© 2011 Facts on File. All Rights Reserved.
90
CHEMISTRY ExpERIMEnTS
Safety Note
Be careful when handling the lighter. please review and
follow the safety guidelines at the beginning of this volume.
Procedure
1.
2.
3.
4.
5.
6.
7.
8.
Find the mass of a disposable butane lighter to the nearest 0.01
gram (g). Record the mass on the first row of Data Table 1.
Fill a large plastic container with room temperature water. Find
the temperature of the water using a thermometer. Record the
temperature on Data Table 1.
Remove the plastic base from a 50-ml graduated cylinder so that
you can see the bottom of it. Immerse the graduated cylinder under
the water in the large container, filling it with water. Keeping the
mouth of the graduated cylinder underwater, invert it. Check to make
sure that no air bubbles are trapped in the cylinder.
Hold the lighter in one hand and the graduated cylinder in the
other (or have a partner hold the cylinder for you). Lift the cylinder
slightly and place the lighter in the water directly beneath the
graduated cylinder.
Carefully release butane from the lighter by pressing the button that
controls the gas valve until the gas fills the cylinder to nearly 45 ml.
Remove the lighter and set the mouth of the graduated cylinder down
on the bottom of the container, inverted, for 2 to 3 minutes (min).
Move the graduated cylinder so that the waterline inside the cylinder
is even with the waterline in the plastic container (this ensures that
the pressure is equal to atmospheric pressure) and measure the
exact volume of gas collected in the graduated cylinder. Record this
measurement on Data Table 1.
Use a hair dryer to dry the lighter completely (about 3 to 5 min).
Once the water has been dried off, find the mass of the lighter.
Record the mass on the second row of Data Table 1.
Take a barometric pressure reading from the barometer and record it
on the data table.
Analysis
1.
Calculate the mass of butane used by subtracting the mass of the
lighter after releasing the butane from the initial mass. Record the
mass on Data Table 1.
© 2011 Facts on File. All Rights Reserved.
13. Finding Molar Mass
91
Data Table 1
Mass of lighter before butane is released
Mass of lighter after butane is released
Mass of butane (lighter mass before
minus lighter mass after)
Temperature (°C) of water
Volume of butane (ml)
Barometric pressure
Pressure of butane (barometric pressure
minus partial pressure of water vapor)
2. Which of the following values for the gas constant (R) will you use:
atm
kPa
0.0821 L ×
× K or 8.31 L ×
× K?
mol
mol
(Hint: look at the units in your barometric pressure reading.)
3. Using the temperature of the water from Data Table 1, find the
partial pressure of water vapor in your experiment on Data Table
2, which shows how water vapor pressure varies as temperature
increases. Use the value from Data Table 2 as well as the
barometric pressure to determine the partial pressure of butane
using the following equation (Dalton’s law of partial pressure):
Ptotal = P1+ P2
where Ptotal is the barometric pressure, P1 is the vapor pressure of
water, and P2 is the pressure of butane.
4. Convert the volume measurement from Data Table 1 from milliliters
to liters by dividing by 1,000.
© 2011 Facts on File. All Rights Reserved.
92
CHEMISTRY ExpERIMEnTS
Data Table 2
Water Vapor Pressure Table
Temperature
(°C)
Pressure
(mmHg)
Temperature
(°C)
Pressure
(mmHg)
Temperature
(°C)
Pressure
(mmHg)
0.0
4.6
19.5
17.0
27.0
26.7
5.0
6.5
20.0
17.5
28.0
28.3
10.0
9.2
20.5
18.1
29.0
30.0
12.5
10.9
21.0
18.6
30.0
31.8
15.0
12.8
21.5
19.2
35.0
42.2
15.5
13.2
22.0
19.8
40.0
55.3
16.0
13.6
22.5
20.4
50.0
92.5
16.5
14.1
23.0
21.1
60.0
149.4
17.0
14.5
23.5
21.7
70.0
233.7
17.5
15.0
24.0
22.4
80.0
355.1
18.0
15.5
24.5
23.1
90.0
525.8
18.5
16.0
25.0
23.8
95.0
633.9
19.0
16.5
26.0
25.2
100.0
760.0
Note: for conversions: 1 atm = 760 mmHg = 101.325 kPa
Convert the temperature from Data Table 1 to K (°C + 273).
Use the information that you have to calculate the moles of butane,
using the ideal gas equation, PV = nRT, which can be rearranged to:
PV
n=
RT
where n = moles.
7. Use the moles of butane and the mass of butane from the data
table to calculate the experimental molar (m) mass of butane using
the equation:
m
M=
n
where M = molar mass, m = mass, and n = moles.
8. The formula for butane is C4H10. Using the periodic table of the
elements, calculate the molar mass of butane.
9. Determine the percent error for your calculated value using the
equation:
experimental value − actual value/actual value × 100 percent.
5.
6.
© 2011 Facts on File. All Rights Reserved.
13. Finding Molar Mass
10.
93
How close was your calculated value to the actual molar mass of
butane? What were some sources of error that could have caused
the results to be different from what was expected?
What’s Going On?
The chemical formula for butane is C4H10 and the actual molar mass of
butane is 58.12 g/mol. Figure 2 shows the structural formula of butane.
In this experiment, the butane was collected in a graduated cylinder
that was held under water to ensure that the gas was not lost to the
atmosphere. The volume was measured at the surface of the water to
ensure that the atmospheric pressure was equal to the combination of
gases within the graduated cylinder, which included butane and some
water vapor that was present due to evaporation. For this reason, Dalton’s
law was used to calculate the pressure of butane. The pressure, volume,
and temperature can all be used to calculate the number of moles of
butane collected. Since the number of moles of a substance is equal to
its mass divided by its molar mass, the moles of butane and the mass
obtained from weighing the lighter before and after collection could be
used to determine the experimental molar mass of butane.
H
H
H
H
H
C
C
C
C
H
H
H
H
H
Figure 2
Structural formula for butane
Connections
The ideal gas equation was established as a combination of several
existing gas laws. Boyle’s law (P1V1 = P2V2) shows the relationship between
pressure and volume. Charles’ law (V1/T1= V2/T2) shows the relationship
between volume and temperature. Avogadro’s law (V1/n1 = V2/n2)
discusses the relationship between the volume of a gas and the number
of moles, and Gay-Lussac’s law (P1/T1 = P2/T2) shows the relationship
© 2011 Facts on File. All Rights Reserved.
94
CHEMISTRY ExpERIMEnTS
between pressure and temperature. All of these laws are expressed in
the combined gas law, P1V1/T1 = P2V2/T2. The pressure of a combination
of gases can be determined using Dalton’s law of partial pressures (Ptotal
= P1 + P2 + P3. . . ), where the partial pressures of all gases can be added
together to equal the total pressure of a gas.
The ideal gas law ties in the relationship between temperature, pressure,
volume, and the number of moles of gas in a closed system. However,
for a gas to be considered an “ideal gas” that can be calculated by this
equation, it must follow the rules of the kinetic theory. The kinetic theory
has five parts:
1. Gas molecules are in constant, random motion.
2. Most of the volume of a gas is empty space and the volume of
the molecules is negligible.
3. The molecules of a gas experience no forces of attraction or
repulsion.
4. The impact of gas molecules is completely elastic and therefore
no energy is lost in collision between molecules.
5. The temperature of a gas is equal to the kinetic energy of all its
molecules.
Under normal conditions, the ideal gas law is reasonably accurate.
However, when a gas is near its condensation point, its critical point, or
is highly pressurized, the ideal gas equation will not be accurate. In such
cases, a real-gas equation such as the van der Waals gas equation (Figure
3), which accounts for attractive forces, can be used.
a•n2
)(v - n•b) = n•R•T
V2
liquid
gas
pressure
(p +
where:
p = pressure
V = volume
T = temperature
R = gas content
a and b = specific constants
for each gas
volume
Figure 3
Van der Waals equation for real gas and a graph of the equation
© 2011 Facts on File. All Rights Reserved.
13. Finding Molar Mass
95
Want to Know More?
See appendix for Our Findings.
Further Reading
Blauch, David N. “Gas Laws,” 2009. Virtual Chemistry. Available online.
URL: Accessed July 17,
2010. Blauch provides an interactive page where students can change the
pressure or temperature of a gas to see how volume is affected.
“Gas Laws.” UNC–Chapel Hill Chemistry Fundamentals Program, 2008.
Available online. URL: />gas/index.html. Accessed July 17, 2010. This Web page discusses the
characteristics and behavior of gases and relates these to the gas laws.
Nave, C. R. “Ideal Gas Law.” Hyperphysics, 2005. Available online.
URL: />Accessed on July 17, 2010. Hosted by the Department of Physics and
Astronomy, Georgia State University, Hyperphysics explains many basic
concepts in science, including the Ideal Gas Law.
© 2011 Facts on File. All Rights Reserved.
14. Chemical Moles
Topic
In the conversion of baking soda to table salt, the ratio of moles of
reactant to moles of product can be calculated.
Introduction
Chemical equations show the reactants and products of a chemical
reaction. Chemical equations must be balanced to show that matter is not
gained or lost in a reaction. Therefore, the amounts of each type of atom
must be the same on both the reactant and product sides of the equation.
A balanced chemical equation includes coefficients that show the mole
ratio, ratio of reactants and products to each other. For example, in the
chemical equation
2 Mg + O2 2 MgO
the coefficients show that the reaction requires 2 moles of magnesium for
every 1 mole of oxygen gas to form 2 moles of magnesium oxide.
By using mole ratios and the amount of one reactant or product, the
amount of the other reactant or product in a chemical reaction can be
calculated. In this experiment, you will determine how many grams (g)
of sodium chloride, or table salt, will be produced from the reaction of a
precise amount of baking soda with an excess amount of hydrochloric
acid (see Figure 1). Then you will perform the reaction, isolate sodium
chloride, and determine the percent yield of your reaction.
Time Required
45 minutes
Materials
2
2
baking soda (sodium bicarbonate), about 2 g
6 molars (M) hydrochloric acid
96
© 2011 Facts on File. All Rights Reserved.
14. Chemical Moles
97
+
For Baking, Cleaning & Deodorizing
hydrochloric
acid
salt
Fresh Box For Baking
NET WT. 1LB (454 g)
Figure 1
When baking soda reacts with hydrochloric acid, table salt is produced
2
2
2
2
2
2
2
2
2
2
2
2
2
2
2
2
medium (250-to-400 milliliter
Figure 1 [ml]) beaker
electronic balance
graduated
cylinderBook 11 Chemistry Figure 1-(11-14-1)
WALKER/WOOD
scoopula
ring stand
ring clamp
wire gauze
Bunsen burner
flint sparker
stirring rod
watch glass (diameter of beaker or larger)
calculator
hot mitts
goggles
periodic table of elements (see page 175)
science notebook
Safety Note
Goggles must be worn at all times during this
experiment. Use caution when using strong acids and while heating over
an open flame. perform this experiment under a fume hood or in a wellventilated area as dangerous vapors will be produced. please review and
follow the safety guidelines at the beginning of this volume.
© 2011 Facts on File. All Rights Reserved.
98
CHEMISTRY ExpERIMEnTS
Procedure
1.
2.
3.
4.
5.
6.
7.
8.
9.
10.
11.
12.
Find the mass of a beaker with a watch glass “lid.” Record the
mass of both items together to the nearest 0.01 gram (g) on the
data table.
Remove the watch glass from the beaker, zero the balance, and add
approximately 2.00 g of baking soda to the beaker. Record the exact
mass to the nearest 0.01 g on the data table.
Measure 5 to 6 ml of 6 M hydrochloric acid into a graduated cylinder.
The exact amount is not important, as this reagent is in excess.
Slowly and carefully add the hydrochloric acid to the beaker of
baking soda. The mixture will bubble rapidly and the beaker will be
very hot.
After the intense bubbling has slowed, stir the mixture with a stirring
rod until the bubbling ceases.
Set up a ring clamp on a ring stand and place a piece of wire gauze
on the ring to serve as a base for the beaker to sit on (Figure 2).
Position the Bunsen burner under the wire gauze.
Place the beaker on top of the ring apparatus and place the watch
glass over the top of the beaker to prevent splattering.
Light the Bunsen burner using a flint sparker and adjust the
flame so that it is nearly touching the bottom of the beaker on the
ring apparatus.
Heat the mixture in the beaker until all the liquid has evaporated.
Allow the beaker and its contents to cool for about 5 minutes.
Find the mass of the beaker, watch glass, and all of its contents to
the nearest 0.01 g. Record the mass on the data table.
The material in the beaker is table salt, which can be thrown in the
trash can or dissolved in water and washed down the sink when you
clean up.
Analysis
Write the complete balanced equation that occurs between baking
soda (NaHCO3) and hydrochloric acid (HCl) to form sodium chloride
(NaCl), water (H2O), and carbon dioxide (CO2).
2. What is the mole ratio of baking soda to sodium chloride?
1.
© 2011 Facts on File. All Rights Reserved.