Economic valuation and environmental assessment
Bạn đang xem bản rút gọn của tài liệu. Xem và tải ngay bản đầy đủ của tài liệu tại đây (728.7 KB, 132 trang )
TRAINING MANUAL
ECONOMIC VALUATION
AND
ENVIRONMENTAL ASSESSMENT
John Mburu (editor)
Contributors:
Richard Abila, Iason Diafas, Paul Guthiga, Richard Hatfield,
Serah Kiragu and Cecilia Ritho
Acknowledgement
The preparation of this training manual has been funded by the German Ministry of Education and
Research (BMBF) through Subproject E13 of the BIOTA-East Africa Project and accomplished through
the cooperation of the Center for Development Research (ZEF) and IUCN - The World Conservation
Union-Eastern Africa Regional Office (IUCN-EARO)
About the Training Manual Authors
John Mburu is a Senior Research Fellow, Center for Development Research, University of Bonn
Richard Abila is Assistant Director, Kenya Marine and Fisheries Research Institute, Kisumu
Iason Diafas is PhD Fellow at the Center for Development Research, University of Bonn
Paul Guthiga is PhD Fellow at the Center for Development Research, University of Bonn.
Richard Hatfield is Senior Program Design Officer with African Wildlife Foundation
Serah Kiragu is Programme Officer with IUCN – The World Conservation Union.
Cecilia Ritho is a Lecturer with the University of Nairobi
i
Preface
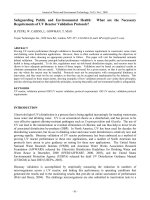
This training manual is aimed at policy-makers and practitioners involved in the
conservation and management of natural resources. It is meant to equip senior and midlevel ministerial personnel, staff members of conservation state corporations and
representatives of NGOs and CBOs in Kenya with basic principles of environmental
economics and valuation techniques in order to endow them with the necessary skills for
assessing and justifying the importance of biodiversity conservation.
The manual is organized in three parts. Part A consists of the first three chapters and
provides an introduction to basic ecological and economic concepts that are relevant to
valuation and assessment of natural resources. Part B offers a detailed discussion of
valuation concepts and methods or techniques applied in economic valuation, while part
C delineates decision-making criteria that can be applied in environmental assessment.
These include environmental impact assessment (EIA), a number of cost-based methods
as well as cost-benefit analysis, which considers both benefit and cost streams.
The primary emphasis of this manual has been placed on natural resources (forests,
wildlife, wetlands, etc.) and the biodiversity within them, but it can also be applied to all
renewable and non-renewable resources as well as to environmental aspects such as
pollution control, water and sanitation, and general public health. Although the manual is
not exhaustive, it offers a catalogue of several important approaches to economic
valuation and practical decision-making, providing empirical examples that support the
theoretical discussions. It is hoped that the manual will positively contribute towards
understanding the economic value of natural resources and biodiversity and hence
promote their conservation and sustainable use.
ii
Table of Contents
Preface: ………………………………………………………………………….. ii
Part A: Introduction to Ecological and Economical Concepts.......................... 1
1.
Natural Resources and Biodiversity ............................................................ 1
1.1 Types and definitions of natural resource ..............................................1
1.2 The significance of differing resource characteristics ...........................2
1.3 Definition of biological diversity (biodiversity)......................................2
1.4 Ecological services and functions of biodiversity...................................4
1.5 Major threats and challenges to biodiversity conservation ..................9
1.6 Discussion questions: ..............................................................................10
2.
Economic Theory and the Problem of Resource Allocation.................... 11
2.1 The rational of economic theory ............................................................11
2.2 Why economics of natural resources.....................................................12
2.3 Natural resources as scarce resources...................................................13
2.4 Economic criteria for decision making in solving NR problems ........15
2.5 Economic valuation and the demand curve .........................................19
2.6 Negative externalities as a source of natural resource problems. ......21
2.7 Discussion Questions...............................................................................23
3.
Policy, Market and Institutional Failures in Natural Resources
Conservation ................................................................................................ 24
3.1 Introduction.............................................................................................24
3.2 The importance of non-market institutions..........................................25
3.3 Market failures........................................................................................27
3.4 Sources of market failures......................................................................28
3.5 Property rights regimes and emergence of different management
approaches of natural resources........................................................... 30
3.6 Political economy considerations...........................................................35
3.7 Discussion questions................................................................................35
PART B: Economic Valuation Concepts and Methods.................................... 36
4.
Introduction to Economic Valuation of Natural Resources and
Biodiversity................................................................................................... 36
4.1 Definition of economic valuation and its importance ..........................36
4.2 Historical perspective of economic valuation .......................................39
4.3 Introduction to differents concepts of value.........................................40
4.4 Measurement of economic value............................................................42
iii
4.5
4.6
5.
Choice of methods of economic valuation.............................................45
Discussion questions................................................................................47
Revealed Preference Methods .................................................................... 48
Market-price based approaches ............................................................48
Human capital approach ........................................................................51
Production function/ Change in productivity method.........................53
Travel cost method..................................................................................55
Hedonic pricing method .........................................................................58
Preventive expenditure/ Damage avoided/ Replacement costs
approaches .............................................................................................. 61
5.7 Discussion questions................................................................................64
5.1
5.2
5.3
5.4
5.5
5.6
6.
Stated or Expressed WTP Methods and Benefits Transfer..................... 65
6.1 Contingent Valuation..............................................................................65
6.2 Choice Experiments ................................................................................71
6.3 Choice modeling versus contingent valuation ......................................74
6.4 Benefits transfer method ........................................................................75
6.5 Dicussion questions .................................................................................76
7.
Measuring Costs of Conserving Natural Resources and Biodiversity.... 78
7.1 Management costs ...................................................................................78
7.2 Opportunity costs of conservation.........................................................80
7.3 Other (external) costs .............................................................................81
7.4 Discussion questions: ..............................................................................81
Part C: Decision Criteria in Practice ................................................................. 83
8.
Environmental Impact Assessment (EIA)................................................. 83
8.1 Introduction to Environmental Impact assessment (EIA)..................83
8.2 Overview of EIA Processes ....................................................................86
8.3 EIA Methods And Tools .........................................................................91
8.4 EIA and Biodiversity ..............................................................................94
8.5 Environmental Audits ..........................................................................100
8.6 Environmental Impact Assessment: Case Studies .............................100
8.7 Discussion questions..............................................................................103
9.
Cost-Benefit Analysis (CBA) .................................................................... 104
9.1 Stages of conducting cost......................................................................104
9.2 Major challenges of conducting CBA .................................................107
9.3 Social or distributive analysis in CBA ................................................108
9.4 Examples of Application on CBA in natural resources.....................108
iv
10. Other Decision-Making criteria ............................................................... 110
10.1 Cost-Effectiveness Analysis..................................................................110
10.2 Multi-criteria analysis ..........................................................................112
10.3 Precautionary approaches....................................................................113
10.4 Moral Approaches and Environmental Ethics in Decision Making 115
10.5 Discussion questions..............................................................................116
References ........................................................................................................... 117
Appendix 1: Evaluating the welfare effects of improved water quality using
the choice experiment method (Abou-Ali and Carlsson, 2004)............. 120
APPENDIX 2: A Financial and economic model for estimating annual use
values of forest resources. ......................................................................... 124
v
TABLES
Table 1: Millennium Development Goal 7 ………………………………………………………13
Table 2: Summary of valuation approaches and techniques used ……………………………….46
Table 3: Calculating the gross value of crop production in Nakivubo Wetland, Uganda, using
Market prices (1993) ……………………………………………………………………50
Table 4: Examples of Elicitation formats ……………………………………………………….68
Table 5: Landowners’ and other stakeholders’ production and transaction costs of comanagement (per participating householda) …………………………………………….79
Table 6: Direct management costs and revenues of the four conservation areas in Kenya ……..79
FIGURES
Figure 1: The relationship between the economic system and the environment ……………….14
Figure 1: Production Possibility Curve (PPF) ………………………………………………….15
Figure 3: Production Possibility Frontier and Optimal Production …………………………….17
Figure 2: Producer and Consumer Surplus ……………………………………………………..19
Figure 3: Demand and WTP ……………………………………………………………………20
Figure 4: Marginal Costs of Production ………………………………………………………...23
Figure 5: Classification of values of natural resources and biodiversity ……………………….42
Figure 8: Classification of economic values (benefits) of natural resources …………………...45
Figure 9: A classification of decision approaches from the perspective of cost-effectiveness ...111
vi
Part A: Introduction to Ecological and Economical Concepts
1. Natural Resources and Biodiversity
1.1
Types and definitions of natural resource
The resources of land, forests, savannahs and seas fall into several categories. Two main
types of natural resource can be distinguished
(a) Non-renewable natural resources
(b) Renewable natural resources
Non-renewable natural resources are those of fixed supply such as oil, coal, gold or iron –
that is, their continued use will inevitably result in exhaustion.
Renewable natural
resources are those that have the capacity to regenerate themselves, and are therefore
potentially inexhaustible when used appropriately, e.g. fish, forests, solar energy, water,
and the atmosphere.
Economists think of the world as consisting of ‘goods’ (physical components) and
‘services’ (non-physical components).
Both non-renewable and renewable natural
resources are ‘goods’ i.e. they are tangible and exist as physical ‘stock’ within a limited
area. As such, they can be privately, communally, or governmentally owned and/or
managed. And since they are tangible in nature, they are also generally recognised to
have market value, although the market values do not always reflect their true value to
society.
Environmental resources, on the other hand, are those that are of benefit to humankind
but are difficult, if not impossible, to own: what economists refer to as ‘public goods’.
Many of these are based on a functioning ecosystem.
Examples include clean air,
flowing rivers, the existence of particularly plants and scenic beauty.
1
1.2
The significance of differing resource characteristics
The primary reason why economists distinguish between non-renewable, renewable and
environmental resources is that the overall management challenge of each differs. The
primary question for non-renewable resource management is: “at what rate should a
resource of fixed supply be depleted?”. By contrast, the main consideration in managing
renewable resources is that they have the potential to be inexhaustible. The primary
question then becomes: “what balance should be maintained between the rate of use and
the rate of resource regeneration?”.
Whilst the primary question in managing
environmental resources becomes “what are the costs to society of diminished ecosystem
functions as a result of renewable and/or non-renewable resource depletion?” or,
alternatively, “what are the benefits to society of enhanced ecosystem functions as a
result of renewable and/or non-renewable resource increase or enrichment?”.
1.3
Definition of biological diversity (biodiversity)
In terms of the discussion so far, non-renewable, renewable, and environmental resources
combine to constitute ‘biological resources’ (the word biodiversity is a contraction of
biological diversity). These biological resources are simply the physical manifestation of
biological diversity. Biodiversity has varied definitions but this manual defines
biodiversity in accordance with the Convention on Biodiversity (CBD) and that is:
biological diversity is the variability among living organisms from all sources including
inter alia, terrestrial, marine, and other aquatic ecosystems and the ecological
complexities of which they are part; this includes diversity within species, between
species and of ecosystems1 (See other definitions in Box 1). These three are the levels of
biodiversity. The first one, genetic biodiversity, defines the adaptation capacities of the
species in the long term by way of evolution, thus species or groups of them with less
flexible genomics will tend to become extinct. At species level, this is basically
supported by a recognized structure (taxonomy), sampling, and derivation of statistical
operators; the number and types of species and changes on their populations are used to
1
See UN, 1992, The Convention on Biological Diversity
2
give a comprehensive measurement of the health of an ecosystem. The ecosystem level,
refers to a community whose spatial and temporal boundaries are not defined, as may be
Box 1. What is biological diversity?
Biological diversity is an umbrella term for the degree and extent of nature’s variety, including the
number and frequency of ecosystems, species, or genes in a given assemblage. It is usually considered at
three levels, “genetic diversity”, “species diversity”, and “ecosystem diversity”. Genetic diversity is a
concept of the variability within a species, as measured by the variation in genes (chemical units of
hereditary information that can be passed from one generation to another) within a particular species,
variety, subspecies, or breed. Species diversity is a concept of the variety of living organisms on earth,
and is [generally] measured by the total number of species in the world (variously estimated as from 5 to
30 million or more, though only about 1.4 million have actually been described), or in a given area under
study.
In general, the larger the population size of a species, the greater the chance of there being high genetic
diversity. But population increase in some species may lead to a population decline in other species, and
even to a reduction in species diversity. Since it is usually not possible to have both maximum species
diversity and maximum genetic diversity, national policy-makers should define the optimum biological
diversity consistent with their development objectives; one key element is to ensure that no species falls
below the minimum critical population size at which genetic diversity is rapidly lost.
Ecosystem diversity related to the diversity and health of the ecological complexes within which species
occur.
Ecosystems provide natural cycles of nutrients (from production to consumption to
decomposition), of water, of oxygen and carbon dioxide (thereby affecting the climate), and of other
chemicals like sulphur, nitrogen, and carbon. Ecological processes govern primary and secondary
production (i.e. energy flow), mineralization of organic matter in the soils and sediments, and storage and
transport of minerals and biomass. Efforts to conserve species must therefore also conserve the
ecosystems of which they are a part.
Source: McNeely (1988), drawn from OTA (1987); Ricklefs, Naveh and Turner (1984)
a fragment of forest or may be the entire biosphere; its study focuses on patterns of
distribution of the species and their roles: functions and interactions to maintain the
homeostasis of the system
Diversity is a concept, which refers to the range of variation or differences among some
set of entities; biological diversity thus refers to variety within the living world. The term
biodiversity is therefore used to describe the number, variety and variability of living
organisms.
Three examples in the Kenyan context include:
•
The genetic diversity of wildebeest versus cheetah, determined through DNA
analysis: the genetic variety within the white bearded gnu is greater than between
some species of antelope. This is mainly due to their high populations level and
3
wide distribution, split by the formation of the Rift Valley. By contrast, the
cheetah gene ‘pool’ is relatively narrow, a fact that is believed to have contributed
to their decline to a level that is considered to be approaching the ‘minimum
viable population’ threshold.
•
The abundance of elephants versus other species: the growth and concentration of
elephants in and around Amboseli National Park is thought to have resulted in the
demise of many other species, due to the role they play in consuming tree and
bush re-growth, in particular. These include primarily the browser and species:
black rhino, eland, kudu, impala, duiker, dik-dik together with leopard, which rely
on browser species. A similar situation also occurred in Tsavo National Parks
during the peak elephant population of the 1970s.
•
Local participation of communities in ecosystem diversity: from a biodiversity
perspective, the main rationale for the need to include local communities in
wildlife management is in order to maintain the functions and services that
ecosystems provide, recognising that the survival of most, if not all, Kenya’s
protected areas are ultimately dependent on the impact of forces outside the
protected area boundaries on ecosystem functions.
1.4
Ecological services and functions of biodiversity
The principal biodiversity goods and functions can be summarized as follows:
-
Regulation of global processes: atmospheric flow of gases that affect global and local
climates and the breathing air;
-
Conservation of soil and water: maintenance of the hydrologic cycle and erosion
control;
-
Cycling of nutrients and energy: photosynthesis, soil renewal, nitrogen fixation,
organic matter decomposition, etc.;
-
Saving of genetic information: that warrants the permanence of life on earth;
-
Maintenance of plant reproduction through pollination and seed dispersal;
4
-
Provision of raw material for sustaining human activities: agriculture, medicine,
manufacturing, industry, etc.; and
-
Provision of recreation opportunities
Detailed description of these services and functions is indicated in Box 2 below.
Box 2: The services of natural resources and biodiversity
Type of service
or function
1. Raw material
2. Life support
3. Energy
Examples
Soil, water, wood and air. They are transformed into consumer products by the
production process.
Hospitable surroundings for human and other forms of life. Life as it exists on
earth is not possible in other planets.
Energy, which fuels the transformation. Trees tap energy from the sun through
photosynthesis. Other sources are fossil fuels, wind and geothermal .
The environment also provides services indirectly to consumers
4. Amenity
in form of a variety of amenities for which there are no
substitutes, for example, lakes and rivers for recreation, wildlife etc. Natural
vegetation and landscapes have innate beauty and are valued by human beings
The raw material and energy finally return to the environment in from of
5. Receptor for
waste. For example, micro-organism cause organic residues to decade.
waste products
Poisonous CO is converted in to less harm CO2. Equatorial rain forests
ecosystem is top on the list for CO2 sequestration
In sum: Tangible services - 1,2,3: Functional services – 5: Intangible services – 4
Ecological measurement of biodiversity
From the above discussion, it can be appreciated that the primary interest in measuring
biodiversity is that biodiversity level is an indicator of well-being of ecological systems,
which also dictate the productivity to humankind of those systems.
5
Biodiversity has two dimensions: richness (variety) and abundance (number). Ecologists
typically utilise three types of biodiversity measure:
•
Species richness indices – a measure of the number of species in a defined
sampling unit.
•
Species abundance indices – compares the level of evenness amongst numbers of
each species versus unevenness (unequal). Usually some species are abundant
whereas most are not i.e. a few species dominate.
•
Proportional abundance indices – which seek to summarise richness and evenness
into a single figure e.g. Shannon and Simpson indices.
Ecological and economic importance of biodiversity
As stated earlier, biodiversity is manifested in the form of biological resources.
However, the presence of biological resources is only the end result of a set of
interrelated ecosystem processes, or functions:
•
Water cycle. The status of a water cycle in any given environment ranges from
‘ineffective’ to ‘effective’. An effective water cycle is one that retains and makes
available to the system the greatest percentage of rainfall received.
One
characteristic tends to be higher and longer duration river/stream flows. High
levels of plant cover (whether grasses or otherwise) are usually required to
facilitate an effective water cycle, which in turn results in higher ecosystem
productivity; together with higher biodiversity levels.
•
Mineral cycle.
Productive systems are dependent on a varied and available
supply of minerals for regeneration. Greater biomass levels contribute healthy
mineral supplies, which in turn result in higher ecosystem productivity and higher
biodiversity levels.
•
Energy flow. Energy flow is a measure of the productivity of the system, and is
determined by the system’s ability to convert sunlight into plant production
through photosynthesis, which in turn is dependent on plant cover.
6
•
The three processes act in tandem, and therefore constitute a set of processes.
This set can move in three directions: ‘spiralling up’, resulting in greater
ecosystem productivity and manifested by greater biodiversity; ‘ spiralling down’,
manifested by decreased productivity and biodiversity; and ‘neutral’.
From an ecological perspective, the diversity increases the ecosystem's stability (capacity
to maintain itself into healthy margins of variation adapting recurrently to changes) and
resilience (ability to respond and recover to great stress events), which is an extraordinary
quality, because it means that biodiversity is able to maintain itself in the time, owing to
the called biogeochemical cycles:
1. Energy, using the photosynthesis by which green plants convert sunlight, water,
nutrients, and carbon dioxide into chemical fuel (carbohydrates), which is the
basis of all food webs, and is the foremost important source of energy (even
including the fossil one, that derives from it);
2. Water, activated by solar energy, the transpiration and evapo-transpiration of the
vegetation contribute to the water purification by catching, holding and recycling
rainwater; in addition, wetlands and estuaries purify water and prevent and control
flooding;
3. Carbon and oxygen cycles, the carbon dioxide produced by animal respiration,
plant decomposition and fuel burning is absorbed by green plants in the biosphere
and phytoplankton in the hydrosphere, which later release oxygen back to the
atmosphere, in order to get a gaseous equilibrium, that enable almost all forms of
life to exist.
4. Nitrogen cycle, nitrogen is a key component of all organisms (base of the aminoacid molecules that integrate proteins), on its natural atmospheric form isn’t
accessible to most organisms, needs to be available being transformed by some
bacteria that live in the roots of legumes.
From economics perspective, biodiversity is important in terms of its use or potential use
value to society i.e. a ‘utilitarian’ view. These uses, which are discussed further in
Chapter 4, include:
7
Extractive use encompasses direct use of biological resources, for either production or
consumption:
•
Fuelwood, timber, water, fish, ivory, medicinal plants, fodder, construction
material, dyes, etc.
•
Employment
Non-extractive use entails use value without extracting the resource (‘indirect’ use),
either for production or consumption:
•
Recreation/Tourism
•
Education and Research
•
Employment opportunities
•
Ecosystem services (as opposed to ‘goods’) provided by ecosystem processes,
including:
o Plant production through photosynthesis
o Plant reproduction through pollination, cross-fertilization, gene flow, etc.
o Watershed protection, recharging ground water and buffering extreme
conditions (e.g. floods, drought)
o Production of soil and protection of soil from erosion
o Supply of essential nutrients
o Absorption and breakdown of pollutants and organic waste
Non-use values encompass value that is not derived from use:
•
Spiritual, historical or cultural value is well-being derived from, for example, a
‘sense of belonging’.
•
Existence value derived from knowing that a landscape, habitat or species exists,
even though an individual may have no intention of ever visiting that area.
•
Option value is the value attached to retain the option, or possibility, of having
future access to a given landscape, habitat or species. This value reflects an
8
individual or society’s perception of uncertainty, both in terms of future needs or
desires; and future threats to the biological resource(s) in question.
Bequest value is closely related to existence value, and is the value derived from
•
knowing that certain landscapes, habitat or species exist for the benefit of future
generations.
1.5
Major threats and challenges to biodiversity conservation
Three major threats are posed to biodiversity:
•
Habitat alteration, usually from higher-diverse natural ecosystems to less
diverse (‘monoculture’ in the extreme case).
This is perhaps the most
important threat to biodiversity and, by extension, system productivity. Two
important cases in Kenya concern conversion of forests to cultivation
(prevalent in all major forests); and conversion of rangeland to cropland –
which is often later abandoned.
•
Over-harvesting, that is, an extraction rate that is higher than the regeneration
rate, leading to eventual exhaustion of the resource. Again, over-harvesting of
trees and grasses are particularly relevant issues in Kenya.
•
Climatic change, often related to changing regional-level vegetation patterns,
and involving features such as carbon dioxide build-up (global warming) and
the El Nino and La Nina phenomena (climate regime reversal).
The importance of natural resource conservation cannot be denied, given that ecosystem
processes and services provide the foundation for our current existence, and that future
consumption depends, to a great extent, on stock of natural ‘capital’. Seen in this light,
conservation is a precondition for sustainable development.
A number of broad challenges exist, however:
9
•
Challenge 1: The fundamental problem is that more people earn greater
immediate benefits from exploiting biological resources than they do from
conserving them.
•
Challenge 2: Areas of the world with the greatest levels of biodiversity are often
those with fewest economic means to implement conservation.
One of the
greatest challenges is to reconcile this situation.
•
Challenge 3: Whilst over-harvesting and/or depletion of a renewable resource
may be a conscious choice, perhaps the greatest need is for resource harvesting to
be conducted under efficient management, rather than mismanagement, in order
that society can realise the greatest possible gains.
1.6
Discussion questions:
1. Why in essence can we say all natural resources can be termed as renewable and
as well as non-renewable?
2. Discuss, giving examples, the main forest functions and services that Kenyans
have been enjoying from their forest?
3. What do you consider the main issues underlying each of the challenges 1, 2 & 3
to be?
10
2.
Economic Theory and the Problem of Resource Allocation
2.1
The rational of economic theory
Making CHOICES is an every day occurrence. Individuals, households, firms producing
goods and services, governments and even the international community make choices.
Choices have to be made for the simple reason that there is SCARCITY. The best-known
scarcity is that of money to buy all the things we desire as individuals, households, or
even governments. Time is scarce, therefore we have to make a choice on the way we
spend the twenty four hours in a day. Natural resources are scarce. For instance land in
the high potential areas of Kenya is only a certain area. Similarly the forest area in Kenya
is scarce in the sense we would want to have more forests, but forestland can also be
cultivated because food produced is scarce. Scarcity implies that a choice has to be made.
Economics is the science of choices. It can be defined as the social science that studies
the choices that we (human beings) make as we cope with scarcity (such as of natural
resources) and the institutions (such traditional norms of natural resource use and
management or government regulations (such as the pending forest bill) that have
evolved and continue to evolve to influence and reconcile our choices. Economic theory
is the body of knowledge that has been accumulated by observing human behaviour in
the process of making choices imposed by scarcity. This body of knowledge continues to
be generated. It is used as one way of analyzing some of the problems that face humanity
by identifying and organizing the facts pertaining to a specific problem with a view to
suggesting or alternative solutions and evaluating their possible.
Economics is divided into two broad areas: Micro- and Macroeconomics.
Microeconomics is the study of the choices the individuals (households) and businesses
(firms) in dealing with scarcity, the interaction of these decisions, and the effect of
government regulation on these decisions. The effect of individual, households, business
firms and government on the national and global economy constitutes the study of
Macroeconomics. For example, how will the maize market in Kenya be affected by free
trade among the three East African countries? How will reduction on the tax on paraffin
and gas?
11
2.2
Why economics of natural resources
As the twenty-first century begins it is clear that the welfare of humanity is closely linked
to the quantity and quality of the natural resources. Long ago, natural resources were a
free good but today they are a scarce good. The relationship is starkly demonstrated by
countries in Sub-Saharan Africa and elsewhere in developing countries, where the majority
of the people derive their livelihood directly from natural resources as farmers, livestock
keepers, fishermen or by harvesting products from forests ecosystems. However, poverty
and degradation of natural resources in these countries is on the increase. It is also
becoming increasingly clear that although there are natural resources issues that are
regional or even country specific, others are of global concern and impact, as clearly
demonstrated by the global warming, depletion of the ozone layer, and reduction of the
equatorial forests resulting in loss of their irreplaceable benefits and functions such as the
Kakamega forest.
It is also evident that governments in specific countries are increasingly being confronted
with natural resource linked conflicts. This is because without consideration of peoples’
interests, sustainable natural resources conservation is not possible. Kenya has a
wealth of these conflicts: cultivation in the Mau Escarpment after alleged land purchases;
fencing off of some sections of the Aberdare Range to minimize human-wildlife conflict;
seemingly idle individually owned prime land in high potential areas amidst many
landlessness and jobless people; contentious cultivation and grazing livestock in gazetted
forest areas; the pending forest bill; natural resources issues with a historical twist such as
treaties governing use of Lake Victoria waters and 99-year colonial land leases versus the
current claims of the communities who lost the land.
It is also recognized that natural resources just like other resources such as other capital
resources (other forms of capital include human capital, financial capital, social capital,
political capital) respond to policies and governance. Economic policies particularly
influence the nature of natural resources. It is now acknowledged that natural resources are
not merely biophysical entities but are also economic commodities essentially dynamic
12
and embedded in the social and political setting. Therefore, appropriate natural resource
management (NRM) systems can only be developed if natural, economic and governance
components are appreciated and integrated. This means that appropriated NRM systems are
derived by combining inputs from resource characteristics, policies, institutions,
technology, skills and economic signals.
The focus on natural resource and environmental issues is current and topical because they
are focused on in the global millennium goals as the 7th goal.
Table 3: Millennium Development Goal 7
Millennium Development Goals (8) – Global Target for 2015
Goal 7 (out of 8 goals) - Ensure environmental sustainability
Target 9 (out of 18 targets)
Integrate
sustainable
the
principle
development
4 Indicators (out of 48 indicators)
of
into
- Proportion of land area covered by forests
- Land area protected to maintain biological diversity
country policies and programs and
reverse the loss of environmental
resources
- GDP per unit of energy use (as proxy for energy efficiency)
- Carbon dioxide emission (per capita) [Plus two figures of
atmospheric of global atmospheric pollution ozone depletion and
the accumulation of global warming gases]
2.3
Natural resources as scarce resources
Natural resources, often termed as “the free gifts of nature”, are neither free nor finite.
Therefore, welfare of a society depends on how it allocates its scarce natural resources
among the competing needs by making choices. Economics as study of choice can
contribute to natural resource and environmental management by:
•
Identifying circumstances which generate natural resource problems
•
Determining the causes of these problems
•
Identifying possible solution and comparing their cost and benefits
13
In making the choices, tradeoffs have to be made, that is giving up one thing in order to
get something else. Economists have three main areas where trade-offs are made: what is
produced with the available (natural) resources such as land, how much is produced (food
crops or forest products) and for whom goods and services are produce (who will enjoy
the food crops and the forest products produced from the land resource).
How do economists define the natural resources and the environment (NRE)? Economists
are interested in NRE as they affect mankind, directly or indirectly. Therefore their
definition and the changes they consider in NRE are human centered. That is, they include
not only short-run and direct effects on mankind but indirect and long run effects as well.
Economist view NRE as non-reproducible composite capital asset or capital good
that produces a stream of various services to mankind as show in Figure 1.
Figure 6: The relationship between the economic system and the environment
Waste products
Environment
Waste products
•
Raw material
Production
sector
Final
Products
The Economic System
14
Household
sector
•
The services produced by NRE are affected by the production and consumption
activities of mankind (extraction of resources) and the way they dispose their
residuals or wastes. These activities constitute the economic system.
As with all assets, preventing undue depreciation of the value of the asset, contributes to
its efficient use.
2.4 Economic criteria for decision making in solving NR problems
The amount of resource available to a country or a single producer defines the limit of
what can be produce given the available technology. Assume that the resource in question
is the amount of land and the alternative use is to cultivate food crop or retain forest
vegetation. The different combinations of the two alternatives possible can be presented
in a graphical model as in Figure 2.
Food crop
Figure 7: Production Possibility Curve (PPF)
16
14
12
10
8
6
4
2
0
A
B
C
D
E
F
1
2
3
4
Forest
5
6
PPF
The combination of food crop and forest falling on the production possibility frontier
(PPF) is the maximum possible given the resources and technology. Production on
this curve constitutes technical efficiency that is maximum physical output given the
available resources and technology. Combinations below and to the left of PPF will
leave some land idle while combinations above and to the left of the line are
unattainable from the land area available.
15
To produce more food crop we have to give up some forestland (opportunity cost).
All economic questions arise because we want more than we can get. We want to
keep our forests but we also want land for growing crops. We want an atmosphere
devoid of harmful ultraviolet rays and other gases from the sun filtered by the ozone
layer, but we also want the good and service whose production process emits gases
that destroy the ozone layer.
Every choice involves a cost. Opportunity cost is the highest-valued alternative that is
given up to get something. The opportunity cost for forest in terms of food crop
increases the less of the food crop we have. From combination A (Figure 2), to get
one more unit of forest and move to combination B, we need to give up one unit of
food crop. But to get one more unit of forest and move to C we need to give up two
units of food crop. This is the increasing marginal cost of production (MC) as shown
in Figure 3b. It explains why the supply curve of a commodity is upward sloping
increasing from left to right.
16
Figure 8: Production Possibility Frontier and Optimal Production
(3a)
Units of food crop produced
12
PPF
10
6
2
Marginal benfit and cost in Food
crop per unit if forest
Units of forest produced
MB
(Demand curve)
MC
(Supply currve)
6
4
2
0
A
1
B
2
C
3
D
4
E
5
F
6
G
(3b)
Units of Forest produced
The PPF can also be used to illustrate benefits received from the choices made. At B, one
unit of forest is worth seven units of food crops. At D however, one unit of forest is only
worth two and a quarter units of food crop. This relationship between the value of an
additional unit of a good consumed is termed as marginal benefit (MB) and it decreases
the more units of the commodity are consumed.
Figure 3b shows what the consumers would be able and willing to pay for the
consumption of one more unit of the good, that is the price per unit. The MB curve is
downward sloping from left to right. It also explains where the demand is downward
17
sloping in the same manner. The demand curve (marginal benefit curve) can also be
termed as the marginal benefit line or curve because it shows the amount the consumer is
willing to pay for an additional unit. The area to the left and below the demand curve
shows the total willingness to pay (WTP) for the units consumed.
The combination of forest and food crop that equates MC to MB is allocatively efficient
in the sense that we cannot produce more of one of the two goods without giving up a
quantity of the other good that we value more highly. Equating MC to MB in use of a
resource translates into static efficiency, that is, efficiency considering resource allocation
in one time period. The criterion also applies when there is enough resources to met the
demand for each time period.
Allocation of scarce resources over different time periods means that scarcity will be
manifested in one or more periods. Scarcity imposes an additional opportunity cost. The
present value of the forgone opportunity is the additional value created by scarcity. It is
termed as marginal user cost. Dynamically, efficient allocation of a scarce resource over
time dictates that the MB be equated to the sum of MC and marginal user cost.
The point was made that MB curve can be interpreted as the demand curve and MC as the
supply curve. Therefore, the marginal benefit is the price consumers are willing to pay for
an additional unit of the good. Similarly the MC is the price minimum price at which the
suppliers would be willing to supply an additional unit of the good (Figure 4). Optimal
allocation of resource to production of a good requires that quantity demanded and the
quantity supplied is equal (OQ1). The allocation maximizes the total benefit to society (area
P1P3R), which has two components in relation to the equilibrium price OP2.
18