Ebook Handbook of biolological statistics (3rd edition) Part 2
Bạn đang xem bản rút gọn của tài liệu. Xem và tải ngay bản đầy đủ của tài liệu tại đây (4.34 MB, 173 trang )
STUDENT’S
T-‐TEST
FOR
TWO
SAMPLES
Student’s t–test for two
samples
Use Student’s t–test for two samples when you have one measurement variable and
one nominal variable, and the nominal variable has only two values. It tests whether the
means of the measurement variable are different in the two groups.
Introduction
There are several statistical tests that use the t-distribution and can be called a t–test.
One of the most common is Student’s t–test for two samples. Other t–tests include the
one-sample t–test, which compares a sample mean to a theoretical mean, and the paired t–
test.
Student’s t–test for two samples is mathematically identical to a one-way anova with
two categories; because comparing the means of two samples is such a common
experimental design, and because the t–test is familiar to many more people than anova, I
treat the two-sample t–test separately.
When to use it
Use the two-sample t–test when you have one nominal variable and one measurement
variable, and you want to compare the mean values of the measurement variable. The
nominal variable must have only two values, such as “male” and “female” or “treated”
and “untreated.”
Null hypothesis
The statistical null hypothesis is that the means of the measurement variable are equal
for the two categories.
How the test works
The test statistic, t , is calculated using a formula that has the difference between the
means in the numerator; this makes t get larger as the means get further apart. The
denominator is the standard error of the difference in the means, which gets smaller as the
sample variances decrease or the sample sizes increase. Thus t gets larger as the means get
farther apart, the variances get smaller, or the sample sizes increase.
You calculate the probability of getting the observed t value under the null hypothesis
using the t-distribution. The shape of the t-distribution, and thus the probability of getting
s
s
s
s
127
HANDBOOK
OF
BIOLOGICAL
STATISTICS
a particular t value, depends on the number of degrees of freedom. The degrees of
freedom for a t–test is the total number of observations in the groups minus 2, or n +n –2.
s
1
2
Assumptions
The t–test assumes that the observations within each group are normally distributed.
Fortunately, it is not at all sensitive to deviations from this assumption, if the distributions
of the two groups are the same (if both distributions are skewed to the right, for example).
I’ve done simulations with a variety of non-normal distributions, including flat, bimodal,
and highly skewed, and the two-sample t–test always gives about 5% false positives, even
with very small sample sizes. If your data are severely non-normal, you should still try to
find a data transformation that makes them more normal, but don’t worry if you can’t find
a good transformation or don’t have enough data to check the normality.
If your data are severely non-normal, and you have different distributions in the two
groups (one data set is skewed to the right and the other is skewed to the left, for
example), and you have small samples (less than 50 or so), then the two-sample t–test can
give inaccurate results, with considerably more than 5% false positives. A data
transformation won’t help you here, and neither will a Mann-Whitney U-test. It would be
pretty unusual in biology to have two groups with different distributions but equal
means, but if you think that’s a possibility, you should require a P value much less than
0.05 to reject the null hypothesis.
The two-sample t–test also assumes homoscedasticity (equal variances in the two
groups). If you have a balanced design (equal sample sizes in the two groups), the test is
not very sensitive to heteroscedasticity unless the sample size is very small (less than 10 or
so); the standard deviations in one group can be several times as big as in the other group,
and you’ll get P<0.05 about 5% of the time if the null hypothesis is true. With an
unbalanced design, heteroscedasticity is a bigger problem; if the group with the smaller
sample size has a bigger standard deviation, the two-sample t–test can give you false
positives much too often. If your two groups have standard deviations that are
substantially different (such as one standard deviation is twice as big as the other), and
your sample sizes are small (less than 10) or unequal, you should use Welch’s t–test
instead.
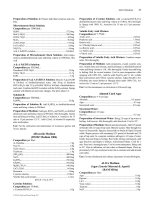
Example
In fall 2004, students in the 2 p.m. section of my Biological Data Analysis class had an
average height of 66.6 inches, while the average height in the 5 p.m. section was 64.6
inches. Are the average heights of the two sections significantly different? Here are the
data:
128
STUDENT’S
T-‐TEST
FOR
TWO
SAMPLES
2 p.m.
69
70
66
63
68
70
69
67
62
63
76
59
62
62
75
62
72
63
5 p.m.
68
62
67
68
69
67
61
59
62
61
69
66
62
62
61
70
There is one measurement variable, height, and one nominal variable, class section.
The null hypothesis is that the mean heights in the two sections are the same. The results
of the t–test (t=1.29, 32 d.f., P=0.21) do not reject the null hypothesis.
Graphing the results
Because it’s just comparing two numbers, you’ll rarely put the results of a t–test in a
graph for publication. For a presentation, you could draw a bar graph like the one for a
one-way anova.
Similar tests
Student’s t–test is mathematically identical to a one-way anova done on data with two
categories; you will get the exact same P value from a two-sample t–test and from a oneway anova, even though you calculate the test statistics differently. The t–test is easier to
do and is familiar to more people, but it is limited to just two categories of data. You can
do a one-way anova on two or more categories. I recommend that if your research always
involves comparing just two means, you should call your test a two-sample t–test, because
it is more familiar to more people. If you write a paper that includes some comparisons of
two means and some comparisons of more than two means, you may want to call all the
tests one-way anovas, rather than switching back and forth between two different names
(t–test and one-way anova) for the same thing.
The Mann-Whitney U-test is a non-parametric alternative to the two-sample t–test that
some people recommend for non-normal data. However, if the two samples have the same
distribution, the two-sample t–test is not sensitive to deviations from normality, so you
can use the more powerful and more familiar t–test instead of the Mann-Whitney U-test. If
the two samples have different distributions, the Mann-Whitney U-test is no better than
the t–test. So there’s really no reason to use the Mann-Whitney U-test unless you have a
true ranked variable instead of a measurement variable.
129
HANDBOOK
OF
BIOLOGICAL
STATISTICS
If the variances are far from equal (one standard deviation is two or more times as big
as the other) and your sample sizes are either small (less than 10) or unequal, you should
use Welch’s t–test (also know as Aspin-Welch, Welch-Satterthwaite, Aspin-WelchSatterthwaite, or Satterthwaite t–test). It is similar to Student’s t–test except that it does not
assume that the standard deviations are equal. It is slightly less powerful than Student’s t–
test when the standard deviations are equal, but it can be much more accurate when the
standard deviations are very unequal. My two-sample t–test spreadsheet
(www.biostathandbook.com/twosamplettest.xls) will calculate Welch’s t–test. You can
also do Welch’s t–test using this web page (graphpad.com/quickcalcs/ttest1.cfm), by
clicking the button labeled “Welch’s unpaired t–test”.
Use the paired t–test when the measurement observations come in pairs, such as
comparing the strengths of the right arm with the strength of the left arm on a set of
people.
Use the one-sample t–test when you have just one group, not two, and you are
comparing the mean of the measurement variable for that group to a theoretical
expectation.
How to do the test
Spreadsheets
I’ve set up a spreadsheet for two-sample t–tests
(www.biostathandbook.com/twosamplettest.xls). It will perform either Student’s t–test or
Welch’s t–test for up to 2000 observations in each group.
Web pages
There are web pages to do the t–test (graphpad.com/quickcalcs/ttest1.cfm and
vassarstats.net/tu.html). Both will do both the Student’s t–test and Welch’s t–test.
SAS
You can use PROC TTEST for Student’s t–test; the CLASS parameter is the nominal
variable, and the VAR parameter is the measurement variable. Here is an example
program for the height data above.
DATA sectionheights;
INPUT section $ height
DATALINES;
2pm 69 2pm 70 2pm 66
2pm 67 2pm 62 2pm 63
2pm 75 2pm 62 2pm 72
5pm 68 5pm 62 5pm 67
5pm 59 5pm 62 5pm 61
5pm 61 5pm 70
;
PROC TTEST;
CLASS section;
VAR height;
RUN;
@@;
2pm
2pm
2pm
5pm
5pm
63
76
63
68
69
2pm 68
2pm 59
2pm 70
2pm 62
2pm 69
2pm 62
5pm 69
5pm 66
5pm 67
5pm 62
5pm 61
5pm 62
The output includes a lot of information; the P value for the Student’s t–test is under “Pr >
|t| on the line labeled “Pooled”, and the P value for Welch’s t–test is on the line labeled
“Satterthwaite.” For these data, the P value is 0.2067 for Student’s t–test and 0.1995 for
Welch’s.
130
STUDENT’S
T-‐TEST
FOR
TWO
SAMPLES
Variable
height
height
Method
Variances
DF
t Value
Pr > |t|
Pooled
Satterthwaite
Equal
Unequal
32
31.2
1.29
1.31
0.2067
0.1995
Power analysis
To estimate the sample sizes needed to detect a significant difference between two
means, you need the following:
•the effect size, or the difference in means you hope to detect;
•the standard deviation. Usually you’ll use the same value for each group, but if you
know ahead of time that one group will have a larger standard deviation than the
other, you can use different numbers;
•alpha, or the significance level (usually 0.05);
•beta, the probability of accepting the null hypothesis when it is false (0.50, 0.80 and
0.90 are common values);
•the ratio of one sample size to the other. The most powerful design is to have equal
numbers in each group (N /N =1.0), but sometimes it’s easier to get large numbers
of one of the groups. For example, if you’re comparing the bone strength in mice
that have been reared in zero gravity aboard the International Space Station vs.
control mice reared on earth, you might decide ahead of time to use three control
mice for every one expensive space mouse (N /N =3.0)
1
2
1
2
The G*Power program will calculate the sample size needed for a two-sample t–test.
Choose “t tests” from the “Test family” menu and “Means: Difference between two
independent means (two groups” from the “Statistical test” menu. Click on the
“Determine” button and enter the means and standard deviations you expect for each
group. Only the difference between the group means is important; it is your effect size.
Click on “Calculate and transfer to main window”. Change “tails” to two, set your alpha
(this will almost always be 0.05) and your power (0.5, 0.8, or 0.9 are commonly used). If
you plan to have more observations in one group than in the other, you can make the
“Allocation ratio” different from 1.
As an example, let’s say you want to know whether people who run regularly have
wider feet than people who don’t run. You look for previously published data on foot
width and find the ANSUR data set, which shows a mean foot width for American men of
100.6 mm and a standard deviation of 5.26 mm. You decide that you’d like to be able to
detect a difference of 3 mm in mean foot width between runners and non-runners. Using
G*Power, you enter 100 mm for the mean of group 1, 103 for the mean of group 2, and 5.26
for the standard deviation of each group. You decide you want to detect a difference of 3
mm, at the P<0.05 level, with a probability of detecting a difference this large, if it exists, of
90% (1–beta=0.90). Entering all these numbers in G*Power gives a sample size for each
group of 66 people.
131
HANDBOOK
OF
BIOLOGICAL
STATISTICS
Independence
Most statistical tests assume that you have a sample of independent observations,
meaning that the value of one observation does not affect the value of other observations.
Non-independent observations can make your statistical test give too many false positives.
Measurement variables
One of the assumptions of most tests is that the observations are independent of each
other. This assumption is violated when the value of one observation tends to be too
similar to the values of other observations. For example, let’s say you wanted to know
whether calico cats had a different mean weight than black cats. You get five calico cats,
five black cats, weigh them, and compare the mean weights with a two-sample t–test. If
the five calico cats are all from one litter, and the five black cats are all from a second litter,
then the measurements are not independent. Some cat parents have small offspring, while
some have large; so if Josie the calico cat is small, her sisters Valerie and Melody are not
independent samples of all calico cats, they are instead also likely to be small. Even if the
null hypothesis (that calico and black cats have the same mean weight) is true, your
chance of getting a P value less than 0.05 could be much greater than 5%.
A common source of non-independence is that observations are close together in space
or time. For example, let’s say you wanted to know whether tigers in a zoo were more
active in the morning or the evening. As a measure of activity, you put a pedometer on
Sally the tiger and count the number of steps she takes in a one-minute period. If you treat
the number of steps Sally takes between 10:00 and 10:01 a.m. as one observation, and the
number of steps between 10:01 and 10:02 a.m. as a separate observation, these
observations are not independent. If Sally is sleeping from 10:00 to 10:01, she’s probably
still sleeping from 10:01 to 10:02; if she’s pacing back and forth between 10:00 and 10:01,
she’s probably still pacing between 10:01 and 10:02. If you take five observations between
10:00 and 10:05 and compare them with five observations you take between 3:00 and 3:05
with a two-sample t–test, there a good chance you’ll get five low-activity measurements in
the morning and five high-activity measurements in the afternoon, or vice-versa. This
increases your chance of a false positive; if the null hypothesis is true, lack of
independence can give you a significant P value much more than 5% of the time.
There are other ways you could get lack of independence in your tiger study. For
example, you might put pedometers on four other tigers—Bob, Janet, Ralph, and
Loretta—in the same enclosure as Sally, measure the activity of all five of them between
10:00 and 10:01, and treat that as five separate observations. However, it may be that when
one tiger gets up and starts walking around, the other tigers are likely to follow it around
and see what it’s doing, while at other times all five tigers are likely to be resting. That
would mean that Bob’s amount of activity is not independent of Sally’s; when Sally is
more active, Bob is likely to be more active.
Regression and correlation assume that observations are independent. If one of the
measurement variables is time, or if the two variables are measured at different times, the
132
INDEPENDENCE
data are often non-independent. For example, if I wanted to know whether I was losing
weight, I could weigh my self every day and then do a regression of weight vs. day.
However, my weight on one day is very similar to my weight on the next day. Even if the
null hypothesis is true that I’m not gaining or losing weight, the non-independence will
make the probability of getting a P value less than 0.05 much greater than 5%.
I’ve put a more extensive discussion of independence on the regression/correlation
page.
Nominal variables
Tests of nominal variables (independence or goodness-of-fit) also assume that
individual observations are independent of each other. To illustrate this, let’s say I want to
know whether my statistics class is more boring than my evolution class. I set up a video
camera observing the students in one lecture of each class, then count the number of
students who yawn at least once. In statistics, 28 students yawn and 15 don’t yawn; in
evolution, 6 yawn and 50 don’t yawn. It seems like there’s a significantly (P=2.4×10 )
higher proportion of yawners in the statistics class, but that could be due to chance,
because the observations within each class are not independent of each other. Yawning is
contagious (so contagious that you’re probably yawning right now, aren’t you?), which
means that if one person near the front of the room in statistics happens to yawn, other
people who can see the yawner are likely to yawn as well. So the probability that Ashley
in statistics yawns is not independent of whether Sid yawns; once Sid yawns, Ashley will
probably yawn as well, and then Megan will yawn, and then Dave will yawn.
–8
Solutions for lack of independence
Unlike non-normality and heteroscedasticity, it is not easy to look at your data and see
whether the data are non-independent. You need to understand the biology of your
organisms and carefully design your experiment so that the observations will be
independent. For your comparison of the weights of calico cats vs. black cats, you should
know that cats from the same litter are likely to be similar in weight; you could therefore
make sure to sample only one cat from each of many litters. You could also sample
multiple cats from each litter, but treat “litter” as a second nominal variable and analyze
the data using nested anova. For Sally the tiger, you might know from previous research
that bouts of activity or inactivity in tigers last for 5 to 10 minutes, so that you could treat
one-minute observations made an hour apart as independent. Or you might know from
previous research that the activity of one tiger has no effect on other tigers, so measuring
activity of five tigers at the same time would actually be okay. To really see whether
students yawn more in my statistics class, I should set up partitions so that students can’t
see or hear each other yawning while I lecture.
For regression and correlation analyses of data collected over a length of time, there
are statistical tests developed for time series. I don’t cover them in this handbook; if you
need to analyze time series data, find out how other people in your field analyze similar
data.
133
HANDBOOK
OF
BIOLOGICAL
STATISTICS
Normality
Most tests for measurement variables assume that data are normally distributed (fit a
bell-shaped curve). Here I explain how to check this and what to do if the data aren’t
normal.
Introduction
Histogram of dry weights of the amphipod crustacean Platorchestia platensis.
A probability distribution specifies the probability of getting an observation in a
particular range of values; the normal distribution is the familiar bell-shaped curve, with a
high probability of getting an observation near the middle and lower probabilities as you
get further from the middle. A normal distribution can be completely described by just
two numbers, or parameters, the mean and the standard deviation; all normal
distributions with the same mean and same standard deviation will be exactly the same
shape. One of the assumptions of an anova and other tests for measurement variables is
that the data fit the normal probability distribution. Because these tests assume that the
data can be described by two parameters, the mean and standard deviation, they are
called parametric tests.
When you plot a frequency histogram of measurement data, the frequencies should
approximate the bell-shaped normal distribution. For example, the figure shown at the
right is a histogram of dry weights of newly hatched amphipods (Platorchestia platensis),
data I tediously collected for my Ph.D. research. It fits the normal distribution pretty well.
Many biological variables fit the normal distribution quite well. This is a result of the
central limit theorem, which says that when you take a large number of random numbers,
the means of those numbers are approximately normally distributed. If you think of a
variable like weight as resulting from the effects of a bunch of other variables averaged
together—age, nutrition, disease exposure, the genotype of several genes, etc.—it’s not
surprising that it would be normally distributed.
134
NORMALITY
Two non-normal histograms.
Other data sets don’t fit the normal distribution very well. The histogram on the left is
the level of sulphate in Maryland streams (data from the Maryland Biological Stream
Survey, www.dnr.state.md.us/streams/MBSS.asp). It doesn’t fit the normal curve very
well, because there are a small number of streams with very high levels of sulphate. The
histogram on the right is the number of egg masses laid by indivuduals of the lentago host
race of the treehopper Enchenopa (unpublished data courtesy of Michael Cast). The curve
is bimodal, with one peak at around 14 egg masses and the other at zero.
Parametric tests assume that your data fit the normal distribution. If your
measurement variable is not normally distributed, you may be increasing your chance of a
false positive result if you analyze the data with a test that assumes normality.
What to do about non-normality
Once you have collected a set of measurement data, you should look at the frequency
histogram to see if it looks non-normal. There are statistical tests of the goodness-of-fit of a
data set to the normal distribution, but I don’t recommend them, because many data sets
that are significantly non-normal would be perfectly appropriate for an anova or other
parametric test. Fortunately, an anova is not very sensitive to moderate deviations from
normality; simulation studies, using a variety of non-normal distributions, have shown
that the false positive rate is not affected very much by this violation of the assumption
(Glass et al. 1972, Harwell et al. 1992, Lix et al. 1996). This is another result of the central
limit theorem, which says that when you take a large number of random samples from a
population, the means of those samples are approximately normally distributed even
when the population is not normal.
Because parametric tests are not very sensitive to deviations from normality, I
recommend that you don’t worry about it unless your data appear very, very non-normal
to you. This is a subjective judgement on your part, but there don’t seem to be any
objective rules on how much non-normality is too much for a parametric test. You should
look at what other people in your field do; if everyone transforms the kind of data you’re
collecting, pr uses a non-parametric test, you should consider doing what everyone else
does even if the non-normality doesn’t seem that bad to you.
If your histogram looks like a normal distribution that has been pushed to one side,
like the sulphate data above, you should try different data transformations to see if any of
them make the histogram look more normal. It’s best if you collect some data, check the
normality, and decide on a transformation before you run your actual experiment; you
don’t want cynical people to think that you tried different transformations until you found
one that gave you a signficant result for your experiment.
135
HANDBOOK
OF
BIOLOGICAL
STATISTICS
If your data still look severely non-normal no matter what transformation you apply,
it’s probably still okay to analyze the data using a parametric test; they’re just not that
sensitive to non-normality. However, you may want to analyze your data using a nonparametric test. Just about every parametric statistical test has a non-parametric substitute,
such as the Kruskal–Wallis test instead of a one-way anova, Wilcoxon signed-rank test
instead of a paired t–test, and Spearman rank correlation instead of linear
regression/correlation. These non-parametric tests do not assume that the data fit the
normal distribution. They do assume that the data in different groups have the same
distribution as each other, however; if different groups have different shaped distributions
(for example, one is skewed to the left, another is skewed to the right), a non-parametric
test will not be any better than a parametric one.
Skewness and kurtosis
Graphs illustrating skewness and kurtosis.
A histogram with a long tail on the right side, such as the sulphate data above, is said
to be skewed to the right; a histogram with a long tail on the left side is said to be skewed
to the left. There is a statistic to describe skewness, g , but I don’t know of any reason to
calculate it; there is no rule of thumb that you shouldn’t do a parametric test if g is greater
than some cutoff value.
Another way in which data can deviate from the normal distribution is kurtosis. A
histogram that has a high peak in the middle and long tails on either side is leptokurtic; a
histogram with a broad, flat middle and short tails is platykurtic. The statistic to describe
kurtosis is g , but I can’t think of any reason why you’d want to calculate it, either.
1
1
2
How to look at normality
Spreadsheet
I’ve written a spreadsheet that will plot a frequency histogram for untransformed, logtransformed and square-root transformed data
(www.biostathandbook.com/histogram.xls). It will handle up to 1000 observations.
136
NORMALITY
If there are not enough observations in each group to check normality, you may want
to examine the residuals (each observation minus the mean of its group). To do this, open
a separate spreadsheet and put the numbers from each group in a separate column. Then
create columns with the mean of each group subtracted from each observation in its
group, as shown below. Copy these numbers into the histogram spreadsheet.
A spreadsheet showing the calculation of residuals.
Web pages
There are several web pages that will produce histograms, but most of them aren’t
very good; the histogram calculator at
www.shodor.com/interactivate/activities/Histogram/ is the best I’ve found.
SAS
You can use the PLOTS option in PROC UNIVARIATE to get a stem-and-leaf display,
which is a kind of very crude histogram. You can also use the HISTOGRAM option to get
an actual histogram, but only if you know how to send the output to a graphics device
driver.
References
Glass, G.V., P.D. Peckham, and J.R. Sanders. 1972. Consequences of failure to meet
assumptions underlying fixed effects analyses of variance and covariance. Review of
Educational Research 42: 237-288.
Harwell, M.R., E.N. Rubinstein, W.S. Hayes, and C.C. Olds. 1992. Summarizing Monte
Carlo results in methodological research: the one- and two-factor fixed effects
ANOVA cases. Journal of Educational Statistics 17: 315-339.
Lix, L.M., J.C. Keselman, and H.J. Keselman. 1996. Consequences of assumption violations
revisited: A quantitative review of alternatives to the one-way analysis of variance F
test. Review of Educational Research 66: 579-619.
137
HANDBOOK
OF
BIOLOGICAL
STATISTICS
Homoscedasticity and
heteroscedasticity
Parametric tests assume that data are homoscedastic (have the same standard
deviation in different groups). Here I explain how to check this and what to do if the data
are heteroscedastic (have different standard deviations in different groups).
Introduction
One of the assumptions of an anova and other parametric tests is that the withingroup standard deviations of the groups are all the same (exhibit homoscedasticity). If the
standard deviations are different from each other (exhibit heteroscedasticity), the
probability of obtaining a false positive result even though the null hypothesis is true may
be greater than the desired alpha level.
To illustrate this problem, I did simulations of samples from three populations, all
with the same population mean. I simulated taking samples of 10 observations from
population A, 7 from population B, and 3 from population C, and repeated this process
thousands of times. When the three populations were homoscedastic (had the same
standard deviation), the one-way anova on the simulated data sets were significant
(P<0.05) about 5% of the time, as they should be. However, when I made the standard
deviations different (1.0 for population A, 2.0 for population B, and 3.0 for population C), I
got a P value less than 0.05 in about 18% of the simulations. In other words, even though
the population means were really all the same, my chance of getting a false positive result
was 18%, not the desired 5%.
There have been a number of simulation studies that have tried to determine when
heteroscedasticity is a big enough problem that other tests should be used.
Heteroscedasticity is much less of a problem when you have a balanced design (equal
sample sizes in each group). Early results suggested that heteroscedasticity was not a
problem at all with a balanced design (Glass et al. 1972), but later results found that large
amounts of heteroscedasticity can inflate the false positive rate, even when the sample
sizes are equal (Harwell et al. 1992). The problem of heteroscedasticity is much worse
when the sample sizes are unequal (an unbalanced design) and the smaller samples are
from populations with larger standard deviations; but when the smaller samples are from
populations with smaller standard deviations, the false positive rate can actually be much
less than 0.05, meaning the power of the test is reduced (Glass et al. 1972).
What to do about heteroscedasticity
You should always compare the standard deviations of different groups of
measurements, to see if they are very different from each other. However, despite all of
the simulation studies that have been done, there does not seem to be a consensus about
138
HOMOSCEDASTICITY
AND
HETEROSCEDASTICITY
when heteroscedasticity is a big enough problem that you should not use a test that
assumes homoscedasticity.
If you see a big difference in standard deviations between groups, the first things you
should try are data transformations. A common pattern is that groups with larger means
also have larger standard deviations, and a log or square-root transformation will often fix
this problem. It’s best if you can choose a transformation based on a pilot study, before
you do your main experiment; you don’t want cynical people to think that you chose a
transformation because it gave you a significant result.
If the standard deviations of your groups are very heterogeneous no matter what
transformation you apply, there are a large number of alternative tests to choose from (Lix
et al. 1996). The most commonly used alternative to one-way anova is Welch’s anova,
sometimes called Welch’s t–test when there are two groups.
Non-parametric tests, such as the Kruskal–Wallis test instead of a one-way anova, do
not assume normality, but they do assume that the shapes of the distributions in different
groups are the same. This means that non-parametric tests are not a good solution to the
problem of heteroscedasticity.
All of the discussion above has been about one-way anovas. Homoscedasticity is also
an assumption of other anovas, such as nested and two-way anovas, and regression and
correlation. Much less work has been done on the effects of heteroscedasticity on these
tests; all I can recommend is that you inspect the data for heteroscedasticity and hope that
you don’t find it, or that a transformation will fix it.
Bartlett’s test
There are several statistical tests for homoscedasticity, and the most popular is
Bartlett’s test. Use this test when you have one measurement variable, one nominal
variable, and you want to test the null hypothesis that the standard deviations of the
measurement variable are the same for the different groups.
Bartlett’s test is not a particularly good one, because it is sensitive to departures from
normality as well as heteroscedasticity; you shouldn’t panic just because you have a
significant Bartlett’s test. It may be more helpful to use Bartlett’s test to see what effect
different transformations have on the heteroscedasticity; you can choose the
transformation with the highest (least significant) P value for Bartlett’s test.
An alternative to Bartlett’s test that I won’t cover here is Levene’s test. It is less sensitive to
departures from normality, but if the data are approximately normal, it is less powerful
than Bartlett’s test.
While Bartlett’s test is usually used when examining data to see if it’s appropriate for a
parametric test, there are times when testing the equality of standard deviations is the
primary goal of an experiment. For example, let’s say you want to know whether variation
in stride length among runners is related to their level of experience—maybe as people
run more, those who started with unusually long or short strides gradually converge on
some ideal stride length. You could measure the stride length of non-runners, beginning
runners, experienced amateur runners, and professional runners, with several individuals
in each group, then use Bartlett’s test to see whether there was significant heterogeneity in
the standard deviations.
How to do Bartlett’s test
Spreadsheet
I have put together a spreadsheet that performs Bartlett’s test for homogeneity of
standard deviations for up to 1000 observations in each of up to 50 groups
(www.biostathandbook.com/bartletts.xls). It allows you to see what the log or square-root
139
HANDBOOK
OF
BIOLOGICAL
STATISTICS
transformation will do. It also shows a graph of the standard deviations plotted vs. the
means. This gives you a visual display of the difference in amount of variation among the
groups, and it also shows whether the mean and standard deviation are correlated.
Entering the mussel shell data from the one-way anova web page into the spreadsheet,
the P values are 0.655 for untransformed data, 0.856 for square-root transformed, and
0.929 for log-transformed data. None of these is close to significance, so there’s no real
need to worry. The graph of the untransformed data hints at a correlation between the
mean and the standard deviation, so it might be a good idea to log-transform the data:
Standard deviation vs. mean AAM for untransformed and log-transformed data.
Web page
There is web page for Bartlett’s test that will handle up to 14 groups
(home.ubalt.edu/ntsbarsh/Business-stat/otherapplets/BartletTest.htm). You have to
enter the variances (not standard deviations) and sample sizes, not the raw data.
SAS
You can use the HOVTEST=BARTLETT option in the MEANS statement of PROC
GLM to perform Bartlett’s test. This modification of the program from the one-way anova
page does Bartlett’s test.
PROC GLM DATA=musselshells;
CLASS location;
MODEL aam = location;
MEANS location / HOVTEST=BARTLETT;
run;
References
Glass, G.V., P.D. Peckham, and J.R. Sanders. 1972. Consequences of failure to meet
assumptions underlying fixed effects analyses of variance and covariance. Review of
Educational Research 42: 237-288.
Harwell, M.R., E.N. Rubinstein, W.S. Hayes, and C.C. Olds. 1992. Summarizing Monte
Carlo results in methodological research: the one- and two-factor fixed effects
ANOVA cases. Journal of Educational Statistics 17: 315-339.
Lix, L.M., J.C. Keselman, and H.J. Keselman. 1996. Consequences of assumption violations
revisited: A quantitative review of alternatives to the one-way analysis of variance F
test. Review of Educational Research 66: 579-619.
140
DATA
TRANSFORMATIONS
Data transformations
If a measurement variable does not fit a normal distribution or has greatly different
standard deviations in different groups, you should try a data transformation.
Introduction
Many biological variables do not meet the assumptions of parametric statistical tests:
they are not normally distributed, the standard deviations are not homogeneous, or both.
Using a parametric statistical test (such as an anova or linear regression) on such data may
give a misleading result. In some cases, transforming the data will make it fit the
assumptions better.
Histograms of number of Eastern mudminnows per 75 m section of stream (samples with 0
mudminnows excluded). Untransformed data on left, log-transformed data on right.
To transform data, you perform a mathematical operation on each observation, then
use these transformed numbers in your statistical test. For example, as shown in the first
graph above, the abundance of the fish species Umbra pygmaea (Eastern mudminnow) in
Maryland streams is non-normally distributed; there are a lot of streams with a small
density of mudminnows, and a few streams with lots of them. Applying the log
transformation makes the data more normal, as shown in the second graph.
Here are 12 numbers from the from the mudminnow data set; the first column is the
untransformed data, the second column is the square root of the number in the first
column, and the third column is the base-10 logarithm of the number in the first column.
141
HANDBOOK
OF
BIOLOGICAL
STATISTICS
Untransformed
38
1
13
2
13
20
50
9
28
6
4
43
Square-root
transformed
6.164
1.000
3.606
1.414
3.606
4.472
7.071
3.000
5.292
2.449
2.000
6.557
Log
transformed
1.580
0.000
1.114
0.301
1.114
1.301
1.699
0.954
1.447
0.778
0.602
1.633
You do the statistics on the transformed numbers. For example, the mean of the
untransformed data is 18.9; the mean of the square-root transformed data is 3.89; the mean
of the log transformed data is 1.044. If you were comparing the fish abundance in different
watersheds, and you decided that log transformation was the best, you would do a oneway anova on the logs of fish abundance, and you would test the null hypothesis that the
means of the log-transformed abundances were equal.
Back transformation
Even though you’ve done a statistical test on a transformed variable, such as the log of
fish abundance, it is not a good idea to report your means, standard errors, etc. in
transformed units. A graph that showed that the mean of the log of fish per 75 meters of
stream was 1.044 would not be very informative for someone who can’t do fractional
exponents in their head. Instead, you should back-transform your results. This involves
doing the opposite of the mathematical function you used in the data transformation. For
the log transformation, you would back-transform by raising 10 to the power of your
number. For example, the log transformed data above has a mean of 1.044 and a 95%
confidence interval of ±0.344 log-transformed fish. The back-transformed mean would be
10 =11.1 fish. The upper confidence limit would be 10
=24.4 fish, and the lower
confidence limit would be 10
=5.0 fish. Note that the confidence interval is not
symmetrical; the upper limit is 13.3 fish above the mean, while the lower limit is 6.1 fish
below the mean. Also note that you can’t just back-transform the confidence interval and
add or subtract that from the back-transformed mean; you can’t take 10 and add or
subtract that.
1.044
(1.044+0.344)
(1.044-0.344)
0.344
Choosing the right transformation
Data transformations are an important tool for the proper statistical analysis of
biological data. To those with a limited knowledge of statistics, however, they may seem a
bit fishy, a form of playing around with your data in order to get the answer you want. It
is therefore essential that you be able to defend your use of data transformations.
There are an infinite number of transformations you could use, but it is better to use a
transformation that other researchers commonly use in your field, such as the square-root
transformation for count data or the log transformation for size data. Even if an obscure
transformation that not many people have heard of gives you slightly more normal or
142
DATA
TRANSFORMATIONS
more homoscedastic data, it will probably be better to use a more common transformation
so people don’t get suspicious. Remember that your data don’t have to be perfectly
normal and homoscedastic; parametric tests aren’t extremely sensitive to deviations from
their assumptions.
It is also important that you decide which transformation to use before you do the
statistical test. Trying different transformations until you find one that gives you a
significant result is cheating. If you have a large number of observations, compare the
effects of different transformations on the normality and the homoscedasticity of the
variable. If you have a small number of observations, you may not be able to see much
effect of the transformations on the normality and homoscedasticity; in that case, you
should use whatever transformation people in your field routinely use for your variable.
For example, if you’re studying pollen dispersal distance and other people routinely logtransform it, you should log-transform pollen distance too, even if you only have 10
observations and therefore can’t really look at normality with a histogram.
Common transformations
There are many transformations that are used occasionally in biology; here are three of
the most common:
Log transformation. This consists of taking the log of each observation. You can use
either base-10 logs (LOG in a spreadsheet, LOG10 in SAS) or base-e logs, also known as
natural logs (LN in a spreadsheet, LOG in SAS). It makes no difference for a statistical test
whether you use base-10 logs or natural logs, because they differ by a constant factor; the
base-10 log of a number is just 2.303... × the natural log of the number. You should specify
which log you’re using when you write up the results, as it will affect things like the slope
and intercept in a regression. I prefer base-10 logs, because it’s possible to look at them
and see the magnitude of the original number: log(1)=0, log(10)=1, log(100)=2, etc.
The back transformation is to raise 10 or e to the power of the number; if the mean of
your base-10 log-transformed data is 1.43, the back transformed mean is 10 =26.9 (in a
spreadsheet, “=10^1.43”). If the mean of your base-e log-transformed data is 3.65, the back
transformed mean is e =38.5 (in a spreadsheet, “=EXP(3.65)”. If you have zeros or
negative numbers, you can’t take the log; you should add a constant to each number to
make them positive and non-zero. If you have count data, and some of the counts are zero,
the convention is to add 0.5 to each number.
Many variables in biology have log-normal distributions, meaning that after logtransformation, the values are normally distributed. This is because if you take a bunch of
independent factors and multiply them together, the resulting product is log-normal. For
example, let’s say you’ve planted a bunch of maple seeds, then 10 years later you see how
tall the trees are. The height of an individual tree would be affected by the nitrogen in the
soil, the amount of water, amount of sunlight, amount of insect damage, etc. Having more
nitrogen might make a tree 10% larger than one with less nitrogen; the right amount of
water might make it 30% larger than one with too much or too little water; more sunlight
might make it 20% larger; less insect damage might make it 15% larger, etc. Thus the final
size of a tree would be a function of nitrogen×water×sunlight×insects, and
mathematically, this kind of function turns out to be log-normal.
1.43
3.65
Square-root transformation. This consists of taking the square root of each
observation. The back transformation is to square the number. If you have negative
numbers, you can’t take the square root; you should add a constant to each number to
make them all positive.
People often use the square-root transformation when the variable is a count of
something, such as bacterial colonies per petri dish, blood cells going through a capillary
per minute, mutations per generation, etc.
143
HANDBOOK
OF
BIOLOGICAL
STATISTICS
Arcsine transformation. This consists of taking the arcsine of the square root of a
number. (The result is given in radians, not degrees, and can range from –"/2 to "/2.)
The numbers to be arcsine transformed must be in the range 0 to 1. This is commonly used
for proportions, which range from 0 to 1, such as the proportion of female Eastern
mudminnows that are infested by a parasite. Note that this kind of proportion is really a
nominal variable, so it is incorrect to treat it as a measurement variable, whether or not
you arcsine transform it. For example, it would be incorrect to count the number of
mudminnows that are or are not parasitized each of several streams in Maryland, treat
the arcsine-transformed proportion of parasitized females in each stream as a
measurement variable, then perform a linear regression on these data vs. stream depth.
This is because the proportions from streams with a smaller sample size of fish will have a
higher standard deviation than proportions from streams with larger samples of fish,
information that is disregarded when treating the arcsine-transformed proportions as
measurement variables. Instead, you should use a test designed for nominal variables; in
this example, you should do logistic regression instead of linear regression. If you insist on
using the arcsine transformation, despite what I’ve just told you, the back-transformation
is to square the sine of the number.
How to transform data
Spreadsheet
In a blank column, enter the appropriate function for the transformation you’ve
chosen. For example, if you want to transform numbers that start in cell A2, you’d go to
cell B2 and enter =LOG(A2) or =LN(A2) to log transform, =SQRT(A2) to square-root
transform, or =ASIN(SQRT(A2)) to arcsine transform. Then copy cell B2 and paste into all
the cells in column B that are next to cells in column A that contain data. To copy and
paste the transformed values into another spreadsheet, remember to use the “Paste
Special...” command, then choose to paste “Values.” Using the “Paste Special...Values”
command makes Excel copy the numerical result of an equation, rather than the equation
itself. (If your spreadsheet is Calc, choose “Paste Special” from the Edit menu, uncheck the
boxes labeled “Paste All” and “Formulas,” and check the box labeled “Numbers.”)
To back-transform data, just enter the inverse of the function you used to transform
the data. To back-transform log transformed data in cell B2, enter =10^B2 for base-10 logs
or =EXP^B2 for natural logs; for square-root transformed data, enter =B2^2; for arcsine
transformed data, enter =(SIN(B2))^2
Web pages
I’m not aware of any web pages that will do data transformations.
SAS
To transform data in SAS, read in the original data, then create a new variable with the
appropriate function. This example shows how to create two new variables, square-root
transformed and log transformed, of the mudminnow data.
144
DATA
TRANSFORMATIONS
DATA mudminnow;
INPUT location $ banktype $ count;
countlog=log10(count);
countsqrt=sqrt(count);
DATALINES;
Gwynn_1
forest 38
Gwynn_2
urban
1
Gwynn_3
urban 13
Jones_1
urban
2
Jones_2
forest 13
LGunpowder_1 forest 20
LGunpowder_2 field 50
LGunpowder_3 forest 9
BGunpowder_1 forest 28
BGunpowder_2 forest 6
BGunpowder_3 forest 4
BGunpowder_4 field 43
;
The dataset “mudminnow” contains all the original variables (“location”, “banktype” and
“count”) plus the new variables (“countlog” and “countsqrt”). You then run whatever
PROC you want and analyze these variables just like you would any others. Of course,
this example does two different transformations only as an illustration; in reality, you
should decide on one transformation before you analyze your data.
The SAS function for arcsine-transforming X is ARSIN(SQRT(X)).
You’ll probably find it easiest to backtransform using a spreadsheet or calculator, but
if you really want to do everything in SAS, the function for taking 10 to the X power is
10**X; the function for taking e to a power is EXP(X); the function for squaring X is X**2;
and the function for backtransforming an arcsine transformed number is SIN(X)**2.
145
HANDBOOK
OF
BIOLOGICAL
STATISTICS
One-way anova
Use one-way anova when you have one nominal variable and one measurement
variable; the nominal variable divides the measurements into two or more groups. It tests
whether the means of the measurement variable are the same for the different groups.
When to use it
Analysis of variance (anova) is the most commonly used technique for comparing the
means of groups of measurement data. There are lots of different experimental designs
that can be analyzed with different kinds of anova; in this handbook, I describe only oneway anova, nested anova and two-way anova.
In a one-way anova (also known as a one-factor, single-factor, or single-classification
anova), there is one measurement variable and one nominal variable. You make multiple
observations of the measurement variable for each value of the nominal variable. For
example, here are some data on a shell measurement (the length of the anterior adductor
muscle scar, standardized by dividing by length; I’ll call this “AAM length”) in the mussel
Mytilus trossulus from five locations: Tillamook, Oregon; Newport, Oregon; Petersburg,
Alaska; Magadan, Russia; and Tvarminne, Finland, taken from a much larger data set
used in McDonald et al. (1991).
Tillamook
0.0571
0.0813
0.0831
0.0976
0.0817
0.0859
0.0735
0.0659
0.0923
0.0836
Newport
0.0873
0.0662
0.0672
0.0819
0.0749
0.0649
0.0835
0.0725
Petersburg
0.0974
0.1352
0.0817
0.1016
0.0968
0.1064
0.1050
Magadan
0.1033
0.0915
0.0781
0.0685
0.0677
0.0697
0.0764
0.0689
Tvarminne
0.0703
0.1026
0.0956
0.0973
0.1039
0.1045
The nominal variable is location, with the five values Tillamook, Newport, Petersburg,
Magadan, and Tvarminne. There are six to ten observations of the measurement variable,
AAM length, from each location.
Null hypothesis
The statistical null hypothesis is that the means of the measurement variable are the
same for the different categories of data; the alternative hypothesis is that they are not all
the same. For the example data set, the null hypothesis is that the mean AAM length is the
146
ONE-‐WAY
ANOVA
same at each location, and the alternative hypothesis is that the mean AAM lengths are
not all the same.
How the test works
The basic idea is to calculate the mean of the observations within each group, then
compare the variance among these means to the average variance within each group.
Under the null hypothesis that the observations in the different groups all have the same
mean, the weighted among-group variance will be the same as the within-group variance.
As the means get further apart, the variance among the means increases. The test statistic
is thus the ratio of the variance among means divided by the average variance within
groups, or F . This statistic has a known distribution under the null hypothesis, so the
probability of obtaining the observed F under the null hypothesis can be calculated.
The shape of the F-distribution depends on two degrees of freedom, the degrees of
freedom of the numerator (among-group variance) and degrees of freedom of the
denominator (within-group variance). The among-group degrees of freedom is the
number of groups minus one. The within-groups degrees of freedom is the total number
of observations, minus the number of groups. Thus if there are n observations in a groups,
numerator degrees of freedom is a-1 and denominator degrees of freedom is n-a. For the
example data set, there are 5 groups and 39 observations, so the numerator degrees of
freedom is 4 and the denominator degrees of freedom is 34. Whatever program you use
for the anova will almost certainly calculate the degrees of freedom for you.
The conventional way of reporting the complete results of an anova is with a table (the
“sum of squares” column is often omitted). Here are the results of a one-way anova on the
mussel data:
s
s
among groups
within groups
total
sum of squares
0.00452
0.00539
0.00991
d.f.
4
34
38
mean square
0.001113
0.000159
F
7.12
s
P
2.8×10
-4
If you’re not going to use the mean squares for anything, you could just report this as
“The means were significantly heterogeneous (one-way anova, F =7.12, P=2.8×10 ).” The
degrees of freedom are given as a subscript to F, with the numerator first.
Note that statisticians often call the within-group mean square the “error” mean
square. I think this can be confusing to non-statisticians, as it implies that the variation is
due to experimental error or measurement error. In biology, the within-group variation is
often largely the result of real, biological variation among individuals, not the kind of
mistakes implied by the word “error.” That’s why I prefer the term “within-group mean
square.”
4, 34
-4
Assumptions
One-way anova assumes that the observations within each group are normally
distributed. It is not particularly sensitive to deviations from this assumption; if you apply
one-way anova to data that are non-normal, your chance of getting a P value less than
0.05, if the null hypothesis is true, is still pretty close to 0.05. It’s better if your data are
close to normal, so after you collect your data, you should calculate the residuals (the
difference between each observation and the mean of its group) and plot them on a
histogram. If the residuals look severely non-normal, try data transformations and see if
one makes the data look more normal.
147
HANDBOOK
OF
BIOLOGICAL
STATISTICS
If none of the transformations you try make the data look normal enough, you can use
the Kruskal-Wallis test. Be aware that it makes the assumption that the different groups
have the same shape of distribution, and that it doesn’t test the same null hypothesis as
one-way anova. Personally, I don’t like the Kruskal-Wallis test; I recommend that if you
have non-normal data that can’t be fixed by transformation, you go ahead and use oneway anova, but be cautious about rejecting the null hypothesis if the P value is not very far
below 0.05 and your data are extremely non-normal.
One-way anova also assumes that your data are homoscedastic, meaning the standard
deviations are equal in the groups. You should examine the standard deviations in the
different groups and see if there are big differences among them.
If you have a balanced design, meaning that the number of observations is the same in
each group, then one-way anova is not very sensitive to heteroscedasticity (different
standard deviations in the different groups). I haven’t found a thorough study of the
effects of heteroscedasticity that considered all combinations of the number of groups,
sample size per group, and amount of heteroscedasticity. I’ve done simulations with two
groups, and they indicated that heteroscedasticity will give an excess proportion of false
positives for a balanced design only if one standard deviation is at least three times the
size of the other, and the sample size in each group is fewer than 10. I would guess that a
similar rule would apply to one-way anovas with more than two groups and balanced
designs.
Heteroscedasticity is a much bigger problem when you have an unbalanced design
(unequal sample sizes in the groups). If the groups with smaller sample sizes also have
larger standard deviations, you will get too many false positives. The difference in
standard deviations does not have to be large; a smaller group could have a standard
deviation that’s 50% larger, and your rate of false positives could be above 10% instead of
at 5% where it belongs. If the groups with larger sample sizes have larger standard
deviations, the error is in the opposite direction; you get too few false positives, which
might seem like a good thing except it also means you lose power (get too many false
negatives, if there is a difference in means).
You should try really hard to have equal sample sizes in all of your groups. With a
balanced design, you can safely use a one-way anova unless the sample sizes per group
are less than 10 and the standard deviations vary by threefold or more. If you have a
balanced design with small sample sizes and very large variation in the standard
deviations, you should use Welch’s anova instead.
If you have an unbalanced design, you should carefully examine the standard
deviations. Unless the standard deviations are very similar, you should probably use
Welch’s anova. It is less powerful than one-way anova for homoscedastic data, but it can
be much more accurate for heteroscedastic data from an unbalanced design.
Additional analyses
Tukey-Kramer test
If you reject the null hypothesis that all the means are equal, you’ll probably want to
look at the data in more detail. One common way to do this is to compare different pairs
of means and see which are significantly different from each other. For the mussel shell
example, the overall P value is highly significant; you would probably want to follow up
by asking whether the mean in Tillamook is different from the mean in Newport, whether
Newport is different from Petersburg, etc.
It might be tempting to use a simple two-sample t–test on each pairwise comparison
that looks interesting to you. However, this can result in a lot of false positives. When
there are a groups, there are (a –a)/2 possible pairwise comparisons, a number that quickly
goes up as the number of groups increases. With 5 groups, there are 10 pairwise
2
148
ONE-‐WAY
ANOVA
comparisons; with 10 groups, there are 45, and with 20 groups, there are 190 pairs. When
you do multiple comparisons, you increase the probability that at least one will have a P
value less than 0.05 purely by chance, even if the null hypothesis of each comparison is
true.
There are a number of different tests for pairwise comparisons after a one-way anova,
and each has advantages and disadvantages. The differences among their results are fairly
subtle, so I will describe only one, the Tukey-Kramer test. It is probably the most
commonly used post-hoc test after a one-way anova, and it is fairly easy to understand.
In the Tukey–Kramer method, the minimum significant difference (MSD) is calculated
for each pair of means. It depends on the sample size in each group, the average variation
within the groups, and the total number of groups. For a balanced design, all of the MSDs
will be the same; for an unbalanced design, pairs of groups with smaller sample sizes will
have bigger MSDs. If the observed difference between a pair of means is greater than the
MSD, the pair of means is significantly different. For example, the Tukey MSD for the
difference between Newport and Tillamook is 0.0172. The observed difference between
these means is 0.0054, so the difference is not significant. Newport and Petersburg have a
Tukey MSD of 0.0188; the observed difference is 0.0286, so it is significant.
There are a couple of common ways to display the results of the Tukey–Kramer test.
One technique is to find all the sets of groups whose means do not differ significantly from
each other, then indicate each set with a different symbol.
location
Newport
Magadan
Tillamook
Tvarminne
Petersburg
mean
AAM
0.0748
0.0780
0.0802
0.0957
0.1030
a
a, b
a, b
b, c
c
Then you explain that “Means with the same letter are not significantly different from
each other (Tukey–Kramer test, P>0.05).” This table shows that Newport and Magadan
both have an “a”, so they are not significantly different; Newport and Tvarminne don’t
have the same letter, so they are significantly different.
Another way you can illustrate the results of the Tukey–Kramer test is with lines
connecting means that are not significantly different from each other. This is easiest when
the means are sorted from smallest to largest:
Mean AAM (anterior adductor muscle scar standardized by total shell length) for Mytilus trossulus
from five locations. Pairs of means grouped by a horizontal line are not significantly different from
each other (Tukey–Kramer method, P>0.05).
149
HANDBOOK
OF
BIOLOGICAL
STATISTICS
There are also tests to compare different sets of groups; for example, you could
compare the two Oregon samples (Newport and Tillamook) to the two samples from
further north in the Pacific (Magadan and Petersburg). The Scheffé test is probably the
most common. The problem with these tests is that with a moderate number of groups,
the number of possible comparisons becomes so large that the P values required for
significance become ridiculously small.
Partitioning variance
The most familiar one-way anovas are “fixed effect” or “model I” anovas. The
different groups are interesting, and you want to know which are different from each
other. As an example, you might compare the AAM length of the mussel species Mytilus
edulis, Mytilus galloprovincialis, Mytilus trossulus and Mytilus californianus; you’d want to
know which had the longest AAM, which was shortest, whether M. edulis was
significantly different from M. trossulus, etc.
The other kind of one-way anova is a “random effect” or “model II” anova. The
different groups are random samples from a larger set of groups, and you’re not
interested in which groups are different from each other. An example would be taking
offspring from five random families of M. trossulus and comparing the AAM lengths
among the families. You wouldn’t care which family had the longest AAM, and whether
family A was significantly different from family B; they’re just random families sampled
from a much larger possible number of families. Instead, you’d be interested in how the
variation among families compared to the variation within families; in other words, you’d
want to partition the variance.
Under the null hypothesis of homogeneity of means, the among-group mean square
and within-group mean square are both estimates of the within-group parametric
variance. If the means are heterogeneous, the within-group mean square is still an
estimate of the within-group variance, but the among-group mean square estimates the
sum of the within-group variance plus the group sample size times the added variance
among groups. Therefore subtracting the within-group mean square from the amonggroup mean square, and dividing this difference by the average group sample size, gives
an estimate of the added variance component among groups. The equation is:
among-group variance =
MSamong − MSwithin
no
where n is a number that is close to, but usually slightly less than, the arithmetic mean of
the sample size (n ) of each of the a groups:
o
i
€
$
n i2 '
∑
1 &
no =
∑ ni − n ))
a −1 &%
∑ i(
Each component of the variance is often expressed as a percentage of the total variance
components. Thus an anova table for a one-way anova would indicate the among-group
variance component
and the within-group variance component, and these numbers would
€
add to 100%.
Although statisticians say that each level of an anova “explains” a proportion of the
variation, this statistical jargon does not mean that you’ve found a biological cause-andeffect explanation. If you measure the number of ears of corn per stalk in 10 random
locations in a field, analyze the data with a one-way anova, and say that the location
“explains” 74.3% of the variation, you haven’t really explained anything; you don’t know
150
ONE-‐WAY
ANOVA
whether some areas have higher yield because of different water content in the soil,
different amounts of insect damage, different amounts of nutrients in the soil, or random
attacks by a band of marauding corn bandits.
Partitioning the variance components is particularly useful in quantitative genetics,
where the within-family component might reflect environmental variation while the
among-family component reflects genetic variation. Of course, estimating heritability
involves more than just doing a simple anova, but the basic concept is similar.
Another area where partitioning variance components is useful is in designing
experiments. For example, let’s say you’re planning a big experiment to test the effect of
different drugs on calcium uptake in rat kidney cells. You want to know how many rats to
use, and how many measurements to make on each rat, so you do a pilot experiment in
which you measure calcium uptake on 6 rats, with 4 measurements per rat. You analyze
the data with a one-way anova and look at the variance components. If a high percentage
of the variation is among rats, that would tell you that there’s a lot of variation from one
rat to the next, but the measurements within one rat are pretty uniform. You could then
design your big experiment to include a lot of rats for each drug treatment, but not very
many measurements on each rat. Or you could do some more pilot experiments to try to
figure out why there’s so much rat-to-rat variation (maybe the rats are different ages, or
some have eaten more recently than others, or some have exercised more) and try to
control it. On the other hand, if the among-rat portion of the variance was low, that would
tell you that the mean values for different rats were all about the same, while there was a
lot of variation among the measurements on each rat. You could design your big
experiment with fewer rats and more observations per rat, or you could try to figure out
why there’s so much variation among measurements and control it better.
There’s an equation you can use for optimal allocation of resources in experiments. It’s
usually used for nested anova, but you can use it for a one-way anova if the groups are
random effect (model II).
Partitioning the variance applies only to a model II (random effects) one-way anova. It
doesn’t really tell you anything useful about the more common model I (fixed effects) oneway anova, although sometimes people like to report it (because they’re proud of how
much of the variance their groups “explain,” I guess).
Example
Here are data on the genome size (measured in picograms of DNA per haploid cell) in
several large groups of crustaceans, taken from Gregory (2014). The cause of variation in
genome size has been a puzzle for a long time; I’ll use these data to answer the biological
question of whether some groups of crustaceans have different genome sizes than others.
Because the data from closely related species would not be independent (closely related
species are likely to have similar genome sizes, because they recently descended from a
common ancestor), I used a random number generator to randomly choose one species
from each family.
151