Ebook Lippincott illustrated reviews flash cards Physiology Part 2
Bạn đang xem bản rút gọn của tài liệu. Xem và tải ngay bản đầy đủ của tài liệu tại đây (40.99 MB, 210 trang )
5.1 Question
Lung Airways
Contrast the properties of airways that make up the bronchial tree’s
conducting zone with those of the respiratory zone.
Why are smokers prone to coughing episodes and bronchitis?
Conducting zone
Which airways create the greatest resistance to airflow in a normal lung,
and why?
0 Trachea
1
2
3
Bronchi
4
Bronchiole
5
Respiratory zone
17
18 Respiratory
bronchiole
19
20
Alveolar
21 duct
22
Alveolar
23 sac
Lippincott Illustrated Reviews Flash Cards: Physiology
Preston_Unit05.indd 197
Copyright © 2015 Wolters Kluwer
5/2/14 8:02 PM
5.1 Answer
Lung Airways
Conducting zone versus respiratory zone airways:
Respiratory zone
• Houses the blood–gas interface
0 Trachea
Conducting zone
Conducting zone
• Do not participate in gas exchange
• Mechanically supported with cartilage (larger airways)
• Lined with a ciliated epithelium
2
3
Bronchi
4
Bronchiole
The sites of highest resistance to airflow are the pharynx and larger airways
(generations 0 through ϳ7). Resistance is proportional to cross-sectional
area. Although larger airways are wider than smaller airways, the latter are
far more numerous so their collective cross-sectional area is proportionally
greater. [Note: Airflow resistance is calculated with the Poiseuille law
(see 4.18).]
5
17
Respiratory zone
Tobacco smoke immobilizes respiratory cilia, which normally propel mucus
with entrapped particulates, including bacteria, upward and out of the lungs
(the mucociliary escalator). When allowed to accumulate, these inhaled
irritants cause epithelial inflammation and infection, thereby predisposing
smokers to coughing and bronchitis.
1
18 Respiratory
bronchiole
19
20
Alveolar
21 duct
22
Alveolar
23 sac
Lippincott Illustrated Reviews Flash Cards: Physiology
Preston_Unit05.indd 198
Copyright © 2015 Wolters Kluwer
5/2/14 8:02 PM
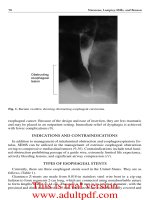
5.2 Question
Blood–Gas Interface
What are the functions of the structures located at the blood–gas
interface, as indicated by boxed numerals?
How does the pulmonary circulation differ from the bronchial
circulation?
What effect does aspirating freshwater have on pulmonary function, as seen in a case of nonfatal drowning?
Alveolus
(airspace)
2
1
3
4
Alveolus
(airspace)
Alveolus
(airspace)
Lippincott Illustrated Reviews Flash Cards: Physiology
Preston_Unit05.indd 199
Copyright © 2015 Wolters Kluwer
5/2/14 8:02 PM
5.2 Answer
Blood–Gas Interface
Blood–gas interface structures and their functions:
1. Pulmonary capillary: brings the circulation into close proximity to air
2. Type I pneumocyte: creates a thin barrier between air and the pulmonary interstitium
3. Type II pneumocyte: synthesizes surfactant and repairs alveolar damage
4. Lamellar inclusion body: contains surfactant
Alveolus
(airspace)
2
1
Pulmonary versus bronchial circulations:
Pulmonary
• Low-pressure circuit
• Presents the entire contents of the circulation to the blood–gas interface
Bronchial
• Circuit of the high-pressure systemic circulation
• Provides the airways with nutrients
[Note: The bronchial circulation drains O2-poor venous blood into the
pulmonary veins, creating a physiologic shunt.]
3
4
Alveolus
(airspace)
Alveolus
(airspace)
Aspirating freshwater decreases pulmonary compliance, which increases
the work of breathing. Fluid in the airways additionally prevents gas exchange, resulting in hypoxia. The compliance effects are due to water entering
the pulmonary vasculature under the influence of colloid oncotic pressure (c).
Capillary hydrostatic pressure is very low in the pulmonary circulation, so c
dominates. [Note: Drowning victims do not absorb sufficient water to affect
serum electrolyte levels and ventricular function, as originally hypothesized.]
Lippincott Illustrated Reviews Flash Cards: Physiology
Preston_Unit05.indd 200
Copyright © 2015 Wolters Kluwer
5/2/14 8:02 PM
Surfactant
5.3 Question
What is surfactant’s composition and origin?
In what ways does surfactant assist lung function?
Surfactant
molecules
What is the cause and what are the symptoms of infant respiratory
distress syndrome (IRDS)?
Alveolus
(airspace)
Water
molecules
Alveolar
lining fluid
Lippincott Illustrated Reviews Flash Cards: Physiology
Preston_Unit05.indd 201
Copyright © 2015 Wolters Kluwer
5/2/14 8:02 PM
5.3 Answer
Surfactant
Surfactant is a mixture of phospholipids and a small number
of essential proteins (ϳ5% by weight) that is produced and
secreted by type II pneumocytes. Surfactant phospholipids are
amphipathic, causing them to localize to the air–water interface
when secreted into the alveolar lumen.
Surfactant reduces alveolar lining fluid surface tension,
which has several benefits, including:
• Helps stabilize alveolar size. Surface tension favors
alveolar collapse, but collapse concentrates the surfactant
molecules which negates the effects of surface tension.
Alveolar inflation has the opposite effect.
• Increases lung compliance. Decreasing surface tension
decreases the work of breathing.
• Helps keep lungs dry. Surface tension promotes fluid
movement from the vasculature into alveoli. Surfactant
reduces this tendency.
Surfactant
Water
molecules
Surfactant molecules
interpose themselves
between water
molecules and reduce
surface tension.
Alveolus
(airspace)
IRDS is caused by surfactant deficiency in preterm infants.
Immature lungs secrete inadequate amounts of surfactant,
so work of breathing is high. Such infants show signs of respiratory distress and hypoxia, including tachypnea, use of accessory
respiratory muscles, and cyanosis.
Lippincott Illustrated Reviews Flash Cards: Physiology
Preston_Unit05.indd 202
Copyright © 2015 Wolters Kluwer
5/2/14 8:02 PM
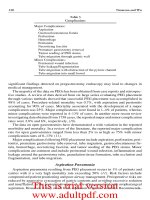
5.4 Question
Pleura
Identify the structures and compartments indicated by the boxed
numerals.
1
4
2
Compartments [3] and [4] are filled with fluid. What are its principal
functions?
What happens if air is introduced into either compartment [3] or [4]?
Right
lung
Left
lung
3
Diaphragm
Lippincott Illustrated Reviews Flash Cards: Physiology
Preston_Unit05.indd 203
Mediastinum
Copyright © 2015 Wolters Kluwer
5/2/14 8:02 PM
5.4 Answer
Pleura
Four structures:
1. Parietal pleura
2. Visceral pleura
3. Left pleural space
4. Right pleural space
[Note: The right and left lungs are completely enclosed within
their own pleura.]
Pleural spaces are filled with ϳ10 mL of pleural fluid, whose
functions include:
• Lubrication: The fluid allows the pleurae to slide over each
other during breathing movements.
• Cohesion: Fluid is spread in a thin film that creates cohesion
between the two pleurae, allowing forces generated by chest wall
movement to be transferred to the underlying lungs.
If air is allowed to enter the pleural space (pneumothorax), the
lung collapses, causing dyspnea and chest pain. Pneumothorax
occurs when the pleurae are breached following chest wall trauma,
for example, or spontaneously as a result of underlying lung disease.
The lung’s elastic recoil holds the pleural space at a negative pressure
relative to the atmosphere, which is why air flows in when the pleurae
are compromised.
Lippincott Illustrated Reviews Flash Cards: Physiology
Preston_Unit05.indd 204
1
4
2
Right
lung
Left
lung
3
Diaphragm
Mediastinum
Copyright © 2015 Wolters Kluwer
5/2/14 8:02 PM
5.5 Question
Pressure–Volume Loop
Explain the features of the red plot. Why does the loop begin
and end at a positive value?
How might restrictive pulmonary disease
(e.g., pulmonary fibrosis) affect a pressure–volume loop
compared with a healthy lung?
100
Lung volume (% TLC)
What do the red [1] and blue [2] plots in the graph
represent?
75
1
50
2
20
0
0
10
20
Transpulmonary pressure (cm H2O)
Lippincott Illustrated Reviews Flash Cards: Physiology
Preston_Unit05.indd 205
Copyright © 2015 Wolters Kluwer
5/2/14 8:02 PM
Pressure–Volume Loop
Plots represent:
1. Lung-volume changes during inspiration (ascending limb,
right) and expiration (descending limb, left)
2. Volume changes in a saline-filled lung
The difference between the two reflects the effects of alveolar
lining fluid surface tension on lung compliance.
Features of the pressure–volume loop:
Inspiration: Smaller airways are collapsed and sealed by
surface tension at low lung volumes. After sufficient pressure
has been applied to reopen them, lung inflation proceeds
linearly.
Hysteresis: Inflation recruits surfactant to the alveolar lining,
decreasing the force favoring lung deflation.
Offset: Airway collapse seals and traps air within alveoli, so
lung volume does not fall to zero upon expiration.
Pulmonary fibrosis and other restrictive diseases impair lung
expansion, so higher transpulmonary pressures are required to
achieve inflation, which manifests as a rightward shift in the loop.
Lippincott Illustrated Reviews Flash Cards: Physiology
Preston_Unit05.indd 206
100
Lung volume (% TLC)
5.5 Answer
75
1
50
2
20
0
0
10
20
Transpulmonary pressure (cm H2O)
Copyright © 2015 Wolters Kluwer
5/2/14 8:02 PM
5.6 Question
Airflow During Inspiration
List the steps that result in air being drawn into the lungs during inspiration,
as shown.
PB=0
What is the main factor limiting airflow in the lungs, and how does it account for
the apex-to-base intrapulmonary pressure gradient shown?
Short-acting beta-agonists (SABs) provide quick short-term relief of asthma
symptoms by what mechanism of action?
–5
–10
–12
Numerals indicate pressure in cm H2O.
PB ϭ barometric pressure.
Lippincott Illustrated Reviews Flash Cards: Physiology
Preston_Unit05.indd 207
Copyright © 2015 Wolters Kluwer
5/2/14 8:02 PM
5.6 Answer
Airflow During Inspiration
Steps causing airflow:
1. Diaphragm and external intercostal muscles contract.
2. Intrapleural pressure (Ppl) becomes more negative.
3. Negative Ppl causes the lungs to expand, decreasing
alveolar pressure (PA).
4. Air flows into lungs, driven by the barometric
Ͼ alveolar pressure gradient.
Airway diameter is the principal airflow-limiting factor
(see 4.18). The large airways have a high resistance to
airflow and are a significant determinant of lung inflation
rate. In practice, this means that PA at the lung base may
remain lower than toward the apex for some time.
[Note: Airflow is also influenced by gas viscosity and
turbulence within airways.]
Asthma symptoms are caused by bronchoconstriction,
which limits airflow. SABs bind to 2-ARs on
parasympathetic nerve terminals and inhibit ACh-mediated
airway smooth muscle contraction. 2-Receptors normally
mediate bronchodilation during sympathetic activation.
Negative Ppl expands lungs, and
PA becomes negative as a result,
creating a pressure gradient
between alveoli and the external
atmosphere.
PB=0
Ppl = –15
Air flows into lungs
down a PB >PA
pressure gradient.
–5
–10
–12
Pressures are in cm H2O.
Lippincott Illustrated Reviews Flash Cards: Physiology
Preston_Unit05.indd 208
Copyright © 2015 Wolters Kluwer
5/2/14 8:02 PM
5.7 Question
Airflow During Expiration
How does “radial traction” decrease airway resistance to airflow
during inspiration?
1
What do the three plots at right demonstrate?
Airflow (L/s)
Why do patients with chronic obstructive pulmonary
disease (COPD) often demonstrate pursed-lip breathing?
2
100
Lippincott Illustrated Reviews Flash Cards: Physiology
Preston_Unit05.indd 209
3
Lung volume (%TLC)
10
Copyright © 2015 Wolters Kluwer
5/2/14 8:02 PM
5.7 Answer
Airflow During Expiration
Airways and surrounding alveoli are all linked mechanically.
During inspiration, alveoli and airways expand as one,
causing airway resistance to fall. During expiration, alveoli
deflate and airway diameter decreases, which increases
resistance to airflow.
Subject inhales to 100% TLC
and then exhales with varying
degrees of force.
Descending portions of
the three curves are
superimposed because
expiration rate is limited
by airway resistance.
1
irati
on
3
Exp
Pursed-lip breathing, or “puffing,” moves the main
site of airway resistance close to the lips, which prolongs
the time during which airway pressure remains high.
This delays airway collapse and coincident reduction in
airflow, partly offsetting the negative effects of disease
on ventilation.
2
Airflow (L/s)
A forceful expiration raises intrapleural pressure to increase
airflow, but it also collapses airways which limits maximal
flow rates. Thus, while progressive increases in exhalation
force do initially increase airflow (as shown), the three
curves inevitably superimpose when airway collapse occurs.
100
Inspiration
10
Lung volume (%TLC)
Lippincott Illustrated Reviews Flash Cards: Physiology
Preston_Unit05.indd 210
Copyright © 2015 Wolters Kluwer
5/2/14 8:02 PM
5.8 Question
Pulmonary Function Tests
Identify the lung volumes and capacities indicated by boxed
numerals.
Maximal
inspiration
6
Because spirometry alone is insufficient to determine all eight
volumes and capacities, what additional tests are needed and
what information do they provide?
5
Lung volume (L)
Contrast the effects of obstructive and restrictive
pulmonary disease on measured lung volumes.
1
6
2
8
3
7
4
Maximal
expiration
0
Time
Lippincott Illustrated Reviews Flash Cards: Physiology
Preston_Unit05.indd 211
Copyright © 2015 Wolters Kluwer
5/2/14 8:02 PM
Pulmonary Function Tests
Eight lung volumes and capacities:
1. Inspiratory reserve volume (IRV)
2. Tidal volume (TV)
3. Expiratory reserve volume (ERV)
4. Residual volume (RV)
5. Vital capacity (VC)
6. Inspiratory capacity (IC)
7. Functional residual capacity (FRC)
8. Total lung capacity (TLC)
Spirometry cannot measure RV. A full set of pulmonary
function tests (PFTs) includes body plethysmography,
helium-dilution tests, or nitrogen-washout assays to yield RV,
from which TLC and FRC can be calculated. [Note: PFTs also
measure forced expiratory volume in 1 second (FEV1), which is
useful in documenting obstructive pulmonary disease.]
Maximal
inspiration
6
1
5
Lung volume (L)
5.8 Answer
Patients with obstructive pulmonary disease typically
work at high lung volumes because exhalation is impaired by
obstruction. RV is increased and FEV1 markedly reduced. In
contrast, restrictive pulmonary disease makes the lungs
noncompliant and difficult to expand, reducing TLC.
6
2
8
3
7
4
Maximal
expiration
0
Time
Lippincott Illustrated Reviews Flash Cards: Physiology
Preston_Unit05.indd 212
Copyright © 2015 Wolters Kluwer
5/2/14 8:02 PM
5.9 Question
Partial Pressures
What are the partial pressures of O2 and CO2 in the following regions
(as shown): [1] air, [2] conducting airways during inspiration,
[3] alveoli, [4] aorta, and [5] pulmonary artery?
What is more likely to increase ventilation, a rise in PaCO2 or a fall in
PaO2?
Breathing air at depths of Ͼ40 m can cause
effects on the CNS similar to those resulting from excess
consumption.
1
2
CO2
O2
3
20
LUNGS
PULMONARY
CIRCULATION
, with
120
5
RIGHT
LEFT
4
HEART
CO2
O2
SYSTEMIC CIRCULATION
Lippincott Illustrated Reviews Flash Cards: Physiology
Preston_Unit05.indd 213
Copyright © 2015 Wolters Kluwer
5/2/14 8:02 PM
5.9 Answer
Partial Pressures
Partial pressures:
1. 160 mm Hg O2, 0 mm Hg CO2
2. 150 mm Hg O2, 0 mm Hg CO2
3. 100 mm Hg O2, 40 mm Hg CO2
4. ϳ98 mm Hg O2, 40 mm Hg CO2
5. 40 mm Hg O2, 45 mm Hg CO2
1
O2
3
20
LUNGS
PULMONARY
CIRCULATION
A rise in PaCO2 is more likely to increase ventilation. PaCO2 impacts blood pH,
which is tightly controlled in part through ventilatory changes. Ventilation is
much less sensitive to PaO2, which can fall to ϳ60 mm Hg without producing
major ventilation changes (see 5.18).
Breathing air at depths of Ͼ40 m can cause nitrogen narcosis, with effects
on the CNS similar to those resulting from excess alcohol consumption. [Note:
The partial pressure of all gases increases with depth below water. At depths of
Ͼ40 m, the partial pressure of N2 rises to the point where significant amounts
of N2 are taken up by the body. N2 has narcotic-like actions when it dissolves in
neuronal membranes.]
2
CO2
120
5
RIGHT
LEFT
4
HEART
CO2
O2
SYSTEMIC CIRCULATION
Lippincott Illustrated Reviews Flash Cards: Physiology
Preston_Unit05.indd 214
Copyright © 2015 Wolters Kluwer
5/2/14 8:02 PM
5.10 Question
Pulmonary Vascular Resistance
Explain the differences between the three plots indicated
by boxed numerals.
Normal quiet breathing range.
What is pulmonary hypertension (PH), and how
might it be induced by chronic exposure to high altitude?
Pulmonary vascular resistance
What is the primary physiologic regulator of pulmonary
vascular resistance (PVR) and pulmonary blood flow?
1
3
RV
Lippincott Illustrated Reviews Flash Cards: Physiology
Preston_Unit05.indd 215
2
Lung volume
TLC
Copyright © 2015 Wolters Kluwer
5/2/14 8:02 PM
Pulmonary Vascular Resistance
Three plots represent:
1. PVR dependence on lung volume
2. Capillary contribution to PVR (alveolar inflation
stretches and compresses capillaries, increasing flow
resistance)
3. Supply vessel effects on PVR (vessels dilate by radial
traction when lungs inflate, reducing flow resistance)
O2 is a primary physiologic regulator of pulmonary resistance vessels and PVR. A decrease in alveolar O2 causes
hypoxic vasoconstriction and shunting of blood to
well-ventilated regions. [Note: Pulmonary resistance vessels
are relatively insensitive to sympathetic activity or humoral
factors.]
PH is indicated by a mean pulmonary artery pressure of
Ն25 mm Hg at rest (normal is Յ20 mm Hg). Living at high
altitude causes a chronic increase in PVR through hypoxic
vasoconstriction. Right ventricular pressure rises as a
result, causing PH. In time, vascular remodeling may cause
a persistent decrease in pulmonary vessel lumen diameter
and precipitate right heart failure.
Lippincott Illustrated Reviews Flash Cards: Physiology
Preston_Unit05.indd 216
Normal quiet breathing range.
Pulmonary vascular resistance
5.10 Answer
1
2
3
RV
Lung volume
TLC
Copyright © 2015 Wolters Kluwer
5/2/14 8:02 PM
Gravitational Effects on Lung Function
Explain how gravity affects alveolar perfusion, referencing
the three zones shown.
Mycobacterium tuberculosis typically establishes itself in
the lung apices. How is this related to regional differences
in ventilation and perfusion?
Lippincott Illustrated Reviews Flash Cards: Physiology
Preston_Unit05.indd 217
Lung
GRAVITY
How do the regional differences in perfusion and alveolar
size affect local V˙A/Q˙ ratios?
5.11 Question
Zone 1
Net perfusion
pressure
= 0 cm H2O
Zone 2
Zone 3
Mean pressure
= 20 cm H2O
Right
ventricle
Heart
Copyright © 2015 Wolters Kluwer
5/2/14 8:02 PM
5.11 Answer
Gravitational Effects on Lung Function
Lung
GRAVITY
The right ventricle generates a pressure of ϳ20 cm H2O.
Gravity reduces pulmonary arterial pressure at the lung apex
to zero and creates negative pulmonary venous pressures,
which impacts capillary perfusion.
Zone 1: Mean pulmonary capillary hydrostatic pressure
(Ppc) is negative, so capillaries are collapsed and
nonperfused.
Zone 2: Ppc is high enough to maintain patency and
perfusion begins.
Zone 3: Ppc and flow is maximal.
Net perfusion
pressure
= 0 cm H2O
Zone 1
Zone 2
Mean pressure
= 20 cm H2O
Right
ventricle
Zone 3
Lung mass is forced downward by gravity. In an upright
Heart
lung, apical alveoli are expanded by the downward force,
whereas alveoli in the base are compressed by the mass of
tissue above. This affects the extent to which alveoli ventilate
during inspiration.
Zone 1: Alveoli are expanded at rest and ventilate poorly upon inspiration. They are also poorly perfused. V˙A/Q˙ approaches infinity.
Zone 2: Ventilation and perfusion both increase rapidly with decreasing height in the lung.
Zone 3: Compressed alveoli ventilate very well and are maximally perfused. V˙A/Q˙ is optimal.
The lung apex is poorly perfused, so alveolar gas composition here resembles inspired air. M. tuberculosis favors regions where O2
levels are high, so often establishes itself in this region.
Lippincott Illustrated Reviews Flash Cards: Physiology
Preston_Unit05.indd 218
Copyright © 2015 Wolters Kluwer
5/2/14 8:02 PM
5.12 Question
Gas Exchange
What do the three graphs at right demonstrate?
1
Blood PO2
(mm Hg)
Referring to the graphs, how would increasing ventilation and perfusion
affect gas exchange?
100
0
100
Distance along capillary (%)
0
100
Distance along capillary (%)
0
100
Distance along capillary (%)
3
Lippincott Illustrated Reviews Flash Cards: Physiology
Preston_Unit05.indd 219
Blood PCO
(% of alveolar PCO)
2
100
Blood PN2O
(% of alveolar PN2O)
How do obstructive and restrictive pulmonary diseases affect gas
exchange?
100
Copyright © 2015 Wolters Kluwer
5/2/14 8:02 PM
Gas Exchange
Effects of increasing ventilation and perfusion:
Graph 1: ↑ Ventilation: no practical effect
↑ Perfusion: O2 uptake increase
Graph 2: No practical effect for either (exchange is limited by exchange
barrier properties)
Graph 3: ↑ Ventilation: no practical effect
↑ Perfusion: N2O uptake increase
1
2
Both obstructive and restrictive pulmonary diseases reduce gas
exchange by reducing lung diffusing capacity (DL). However, obstructive
diseases reduce surface area available for exchange, whereas restrictive
diseases increase exchange barrier thickness.
3
Lippincott Illustrated Reviews Flash Cards: Physiology
Preston_Unit05.indd 220
Blood PO2
(mm Hg)
100
Blood PCO
(% of alveolar PCO)
All three graphs describe characteristics of gas exchange between the
alveolus and pulmonary blood:
1. Normal O2 uptake
2. Diffusion-limited exchange (CO binds to Hb with high affinity, so
alveolar Pco and blood Pco never equilibrate)
3. Perfusion-limited exchange (Hb does not bind N2O, so equilibration
occurs rapidly)
100
Blood PN2O
(% of alveolar PN2O)
5.12 Answer
100
0
100
Distance along capillary (%)
0
100
Distance along capillary (%)
0
100
Distance along capillary (%)
Copyright © 2015 Wolters Kluwer
5/2/14 8:02 PM
5.13 Question
Oxygen Transport I
What do the colored bands and the dotted line indicated by
boxed numerals represent?
A trauma patient has sustained a class IV hemorrhage involving loss of ϳ50% of blood volume. The patient’s family is
refusing transfusion on religious grounds. What is of greater
concern, the fluid volume loss or the Hb loss?
2
100
% Saturation with O2
How would a ϳ10% decrease in Hb concentration affect
blood O2 saturation and O2-carrying capacity?
1
50
0
0
3
40
80
120
PO2 (mm Hg)
Lippincott Illustrated Reviews Flash Cards: Physiology
Preston_Unit05.indd 221
Copyright © 2015 Wolters Kluwer
5/2/14 8:02 PM