IELTS writing task 1
Bạn đang xem bản rút gọn của tài liệu. Xem và tải ngay bản đầy đủ của tài liệu tại đây (1 MB, 34 trang )
TRUNG TÂM NGOẠI NGỮ ĐẠI HỌC BÁCH KHOA – ĐẠI HỌC QUỐC GIA TP.HỒ CHÍ MINH
www.bkenglish.edu.vn
TRUNG TÂM NGOẠI NGỮ ĐẠI HỌC BÁCH KHOA – ĐẠI HỌC QUỐC GIA TP.HỒ CHÍ MINH
1. The pie charts below show the percentage of housing owned and rented in the UK in 1991
and 2007. Summarize the information by describing the main features of the charts and
making comparisons where appropriate.
Write at least 150 words
The pie charts compare home ownership and renting for 1991 and 2007 in percentage terms. In
1991, home owner were the most popular type of housing, accounting for 60%, or more than over
half of all homes. The next largest sector was social rented homes, amounting to 23% or nearly
one-third of homes. The remaining homes were mostly privately rented (11%) with a tiny fraction
being social housing (6%).
Sixteen years later, in 2007, the number of home owners had risen to 70%, or almost three quarters
of all homes. This was an increase of 10% compared with 1991. Much of the increase in home
ownership can be explained by the decrease in social rented homes, which had dropped from 23%
to 17%.
www.bkenglish.edu.vn
TRUNG TÂM NGOẠI NGỮ ĐẠI HỌC BÁCH KHOA – ĐẠI HỌC QUỐC GIA TP.HỒ CHÍ MINH
The percentage of privately rented homes had remained unchanged at 11%. However, there were
5 million more homes in 2007 compared with 1991 so the number of rented homes had increased
despite the same percentage. Social housing has decreased three-fold from 6% in 1991 to 2% in
2007, and it remains the least popular type of housing.
(180 words)
2. The graph gives information about drinking habits of the US population by age.
Summarise the information by selecting and reporting the main features, and make
comparisons where relevant.
Write at least 150 words
The bar chart shows information about people’s drinking behavior by age group in the US. Several
trends are evident.
The highest proportion of those who never drink (nearly two-thirds) was in the 16 to 24 years
group. The proportion tended to decrease with age. Only 40 per cent of people age d 65 to 74 had
never drink.
www.bkenglish.edu.vn
TRUNG TÂM NGOẠI NGỮ ĐẠI HỌC BÁCH KHOA – ĐẠI HỌC QUỐC GIA TP.HỒ CHÍ MINH
On the other hand, the percentage of those who had quit drinking tended to increase with age.
Only 5 per cent of those in the youngest age group (16 to 24) were ex-drinkers, as opposed to
roughly 40 per cent of those aged 65 to 75.
The percentage of those classed as heavy drinkers also showed a distinct pattern. People in middle
age (35 to 54) tended to be the heaviest drinkers – approximately 13 per cent of the total. A
relatively small proportion of those in the youngest age group, and an even smaller percentage of
those in the oldest group (roughly 3 per cent) drink heavily.
Overall, age appears to be a significant factor in patterns of drinking behavior.
(177 words)
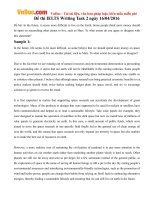
3. The table shows the average length of YouTube video adverti sements and average length
of time viewers spend watching them. Summarise the information by selecting and reporting
the main features.
Average YouTube Video ad length and time viewed
Write at least 150 words
The table shows the average length of YouTube video advertisements by sector and average length
of time viewers spent watching these advertisements.
The average length of the advertisements varied from a low of 21.8 seconds for pharmaceuticals
to a high of 66.7 for public service advertisements. With the exception of government- and
www.bkenglish.edu.vn
TRUNG TÂM NGOẠI NGỮ ĐẠI HỌC BÁCH KHOA – ĐẠI HỌC QUỐC GIA TP.HỒ CHÍ MINH
technology- related advertisements, in general, products and services which required a large
financial commitment tended to have longer advertisements. Entertainments, financial services
and travel advertisements, for example, were all twenty eight seconds on average or longer. Less
expensive products, on the other hand, such as consumer electronics, clothing and medicines,
tended to have shorter advertisements.
Adverts for more expensive products or services also tended to be watched for longer than adverts
for less expensive items. Viewers on average watched more than 50 per cent of advertisements
for entertainment, travel, business and finance. In contrast, viewers tended to watch less of
government advertisements and advertisements for cheaper goods such as consumer electronics,
clothing and medicines.
Overall, length of YouTube video advertisements and length of time spent viewing such
advertisements appears to be associated with the perceived cost of the product or servi ce being
advertised.
(195 words)
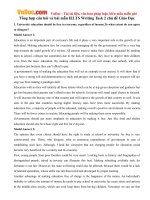
4. The bar graph below shows the numbers of male and female research students studying
six computer science subjects at a US university in 2011. Summarise the information by
selecting and report in the main features, and make comparisons where relevant.
Write at least 150 words
www.bkenglish.edu.vn
TRUNG TÂM NGOẠI NGỮ ĐẠI HỌC BÁCH KHOA – ĐẠI HỌC QUỐC GIA TP.HỒ CHÍ MINH
The bar chart shows the gender distribution of students doing computer scientific research across
a range of disciplines at a US university in 2011.
In five of the six disciplines, males outnumbered females. Male students made up a particularly
large proportion of the student group in subjects related to the study of programming objects:
mathematics, programming, and engineering. The gender gap was particularly large in the field
of mathematics, where there were five times as many male students as female students.
Men and women were more equally represented in subjects related to the study of computer
science: natural sciences, psychology, and linguistics. In natural science, there were nearly as
many women [approximately 200] as men [approximately 240]. This was also true of psychology.
Linguistics was the only discipline in which women outnumbered men [roughly 110 women vs.
90 men]. Overall, the chart shows that at this university, computer science subjects continue to be
male-dominated; however, women have a significant presence in fields related to psychology and
the computer sciences. (169 words)
5. The pie charts show the average consumption of food in the world in 2008 compared to
two countries; China and India. Write a report to a university lecturer describing the data.
Write at least 150 words
www.bkenglish.edu.vn
TRUNG TÂM NGOẠI NGỮ ĐẠI HỌC BÁCH KHOA – ĐẠI HỌC QUỐC GIA TP.HỒ CHÍ MINH
The graphs illustrate the consumption of 4 types of food used in the word in 2008. The figures are
compared to the amounts of food used in china and India in the same year.
As an overall trend, the two countries showed different food consumption from the world average,
while processed food consumption still had the largest percentages in all the three charts.
In particular, processed food consumption was the highest in the in the world, accounting for 41%,
which was followed by vegetables and fruits at 29% and animal food at a quarter. Only 4%
consisted of nut and seeds consumption.
Likewise, China used processed food in the largest proportion of 39%. Animal fo od showed the
same figure as the world’s average, 25%. Vegetable and fruits was used at 23% while nuts and
seeds showed less than a half figure.
In India, both vegetable and processed food were used the most in the year 2008 with percentages
of 34% and 32% respectively, nuts and seeds used in this country showed the largest proportion
among the three charts given, making up 19% at this time. (185 words)
6. The diagram shows the procedure for university entry for high school graduates. Write a
report for a university or college lecturer describing the information.
Write at least 150 words
www.bkenglish.edu.vn
TRUNG TÂM NGOẠI NGỮ ĐẠI HỌC BÁCH KHOA – ĐẠI HỌC QUỐC GIA TP.HỒ CHÍ MINH
The flowchart illustrates the various steps that a high school student must follow to enter
university.
Once the high school has been obtained, students need to complete an application for university
entrance. This can be downloaded from the university website. The completed application should
then be sent to the administration.
Applicants receive a reply two weeks later which is provisional acceptance, a rejection or an
acceptance. If a rejection is received, students can either cancel their application altogether or
complete an application for an alternative course and send to the administration office.
A provisional acceptance means that more documentation is required. Applicants in this situation
should complete the additional documentation and submit them to the office. When an acceptance
is received, the applicant should complete the enrolment form and select which subjects he or she
wishes to undertake and register with the dean. When all this is complete, the applicant may enter
university.
(194 words)
7. The graphs show changes in spending habits of people in UK between 1971 and 2001.
Write a report to a university lecturer describing the data.
Write at least 150 words
www.bkenglish.edu.vn
TRUNG TÂM NGOẠI NGỮ ĐẠI HỌC BÁCH KHOA – ĐẠI HỌC QUỐC GIA TP.HỒ CHÍ MINH
The pie charts show changes in UK spending patterns between 1971 and 30 years later, 2001.
As an overall trend, increased amounts of money spent on cars, computers and eating out were
made up for by drops in expenditure on food and books.
In detail, food and car made up the two biggest item of expenditure in both years. Together they
comprised over half of household spending in the UK. Food accounted for 44% of spending in
1971, but this dropped by two thirds to 14% in 2001. However, the outlay on cars doubled, rising
from 22% in 1971 to 43% in 2001.
Other areas changed significantly. Spending on eating out doubled, climbing from 7% to 14%.
The proportion of salary spent on computers increased dramatically, up from 2% in 1971 to 12%
in 2001. However, as computer expenditure rose, the percentage of outlay on books plunged from
6% to 1%.
(151 words)
8. The pie chart below shows the proportion of different categories of families living in
poverty in UK in 2002. Proportion of people from each household type living in poverty.
Summarise the information by selecting and reporting the main features, and make
comparisons where relevant.
Write at least 150 words.
Proportion of people from each household type living in poverty
www.bkenglish.edu.vn
TRUNG TÂM NGOẠI NGỮ ĐẠI HỌC BÁCH KHOA – ĐẠI HỌC QUỐC GIA TP.HỒ CHÍ MINH
The pie chart examines the different type of families who were living in poor conditions in UK
in the year 2002.
As an overall trend, 14% of the entire households in UK at that time were in conditions of poverty.
In general, single people struggled more than couples.
In particular, as far as people with children are concerned, sole parents showed the highest
percentage of 26% among all the given categories while couples with children accounted for a
relatively smaller percentage of 15%.
When it comes to people with no children, single people made up a large percentage of 24%,
which is almost the same figure for single people with children. On the other hand, only 9% of
the couples without any children suffered from poverty in 2002. In terms of aged people, singles
had a slightly higher percentage than couples. Only 7% and 5% of the aged population had
hardships in their living circumstances.
(155 words)
9. The bar charts below give information about the railway system in six cities in Europe.
Summarise the information by selecting and reporting the main features, and make
comparisons where relevant.
www.bkenglish.edu.vn
TRUNG TÂM NGOẠI NGỮ ĐẠI HỌC BÁCH KHOA – ĐẠI HỌC QUỐC GIA TP.HỒ CHÍ MINH
Write at least 150 words.
The bar charts illustrate comparable information related to railway systems in six capital cities in
Europe; Paris, Stockholm, Lisbon, Rome, Madrid and Berlin.
In general, railway systems in different cities vary in terms of the start dates of each system, the
sizes, and the numbers of passengers using the systems in a year.
As far as the ages are concerned, Paris has the oldest railway system among the six cities. It was
opened in the year 1863, which is incomparable to the other cities. On the other hand, Berlin has
the newest railway system which was opened in Europe 2001.
In terms of the sizes, Paris, for certain, has the longest route, 394km, which is nearly twice the
figure for Stockholm. Madrid, in contrast, has the shortest route in its railway system, only 28km.
When it comes to the numbers of people using the railway system in each, Lisbon shows the
largest number of 1927 million passengers in a year while Madrid serves the smallest number of
railway users, 45 millions.
(170 words)
www.bkenglish.edu.vn
TRUNG TÂM NGOẠI NGỮ ĐẠI HỌC BÁCH KHOA – ĐẠI HỌC QUỐC GIA TP.HỒ CHÍ MINH
10. The bar graph indicates sales figures for reading materials from 2002 to 2012. Write a
report to a university lecturer describing the information shown below.
Write at least 150 words
The graph shows the changes in the sales of four different types of publications for a decade since
2002.
In general, all the given categorise except hobbies book showed a rising trend in the sales over the
period. The sales of history books were the highest while those of art books were the lowest.
In particular, the sales of the biggest sellers, history books, experienced an overall growth during
the period. The sales were around 4500 copies in 2002, and then reached a peak of 10000 in 2008.
Although the figure dropped slightly after then, history books remained the greatest sellers with
around 9000 copies sold in 2012.
The sales of art books and entertainment books showed a similar pattern of a steady growth. The
figure for art books increased slowly from around 1500 copies in 2002 to just under 4000 in 2012
while that for entertainment books went through a moderate rise from approximately 1300 copies
in 2002 to 3000 in 2012.
On the other hand, the last category, hobbies book, did not show an upward trend. The sales of
hobbies book showed the lowest sales figures, and the figure generally remained constant at
between 500 and 700 copies.
(199 words)
www.bkenglish.edu.vn
TRUNG TÂM NGOẠI NGỮ ĐẠI HỌC BÁCH KHOA – ĐẠI HỌC QUỐC GIA TP.HỒ CHÍ MINH
11. The graphs show figures relating to hours worked and stress levels amongst professionals
in eight groups. Describe the information shown to a university or collage lecturer.
Write at least 150 words
Two graphs give different information related to eight professional groups. The bar chart indicates
the number of weekly work hours done by the groups while the pie graph illustrates the
percentages of people suffering from stress related illness in the different professions given.
In general, business men work the longest among the eight groups while the smallest amount of
time is normally worked by lecturers. According to the pie chart, lecturers struggle the most with
www.bkenglish.edu.vn
TRUNG TÂM NGOẠI NGỮ ĐẠI HỌC BÁCH KHOA – ĐẠI HỌC QUỐC GIA TP.HỒ CHÍ MINH
work-related stress. Although their average working hours is smaller than any other group in the
chart, lecturers suffer from the highest level of stress caused by their job.
The bar graph shows that business men and movie producers work the most at about 70 hours and
62 hours per week respectively. At the opposite end of the scale, lecturers wo rk only around 25
hours. Working hours of other professionals varied with doctors, writers, programmers, lawyers
and chefs working approximately 52, 46, 35 and 32 hours per week in the name ordered.
The pie graph shows that the professional who has the highest incidence of stress related illnesses
is lecturers at 25%. Movie producers and doctors also have high rates with 18% and 15% each.
The figures for business men, lawyers, chefs and writers can be grouped into percentages between
11 and 8%. The lowest rate of stress illness is attributed to programmers at only 5%, which is only
a fifth the figure for lecturers.
(239 words)
12. Describe the information in the table and make comparisons where appropriate.
Write at least 150 words.
The chart illustrates average distance travelled by various modes of transport in Netherland in
2001 and 2006. The figures are given in miles and to show how people’s preference changed over
time.
www.bkenglish.edu.vn
TRUNG TÂM NGOẠI NGỮ ĐẠI HỌC BÁCH KHOA – ĐẠI HỌC QUỐC GIA TP.HỒ CHÍ MINH
In general, people in Netherland travelled more in the year 2006 than in 2001. Cars showed
unparalleled figures among the given categories. Except walking, using bicycles and taking local
buses, most of the categories showed overall increases in the distance travelled.
In detail, a person driving his own car travelled 3,199 miles on average in 2001, and the average
distance showed a moderate rise to 4,806 miles in 2006. Apart from cars, taking trains, using long
distance buses and taxis also experienced an overall growth in their figures from 289 miles to 366,
from 54 miles to 124, and from 13 miles to 42 respectively in the order named.
On the other hand, walking and rising bicycles were not more favored by Dutch people. Both
categories showed a moderate decline in their figures. Meanwhile, the number of people who used
local buses must have dropped significantly as the average distance experienced a dramatic fall
from 429 miles in 2001 to 274 miles in 2006.
(195 words)
13. The graphs indicate the source of complaints about the bank of America and the amount
of time it takes to have the complaints resolved.
Summarise the information by selecting and report in the main features, and make
comparisons where relevant.
www.bkenglish.edu.vn
TRUNG TÂM NGOẠI NGỮ ĐẠI HỌC BÁCH KHOA – ĐẠI HỌC QUỐC GIA TP.HỒ CHÍ MINH
Write at least 150 words
The two graphs depict different information related to complaints within the bank of America.
The pie graph shows the sources of complaints, while the bar graph illustrates the average time
taken between investigation into complaints and final action taken.
In general, by far the highest number of complaints against the bank of America originated from
the public. The bar graph shows the average time period between investigation and action is
around 5 months.
63% of all complaints against the bank of America are lodged by the public. Of the remaining
37% of complaints, the figures can be grouped into percentages between 11 and 8%, which are
made up of government agencies, out-of-state agencies, and insurance companies. Then
interestingly, media and bank employee made up and equal figure, 3% in the chart.
www.bkenglish.edu.vn
TRUNG TÂM NGOẠI NGỮ ĐẠI HỌC BÁCH KHOA – ĐẠI HỌC QUỐC GIA TP.HỒ CHÍ MINH
The bar graph shows that 2001 had the highest waiting time for complaints of medical misconduct
at 6 months. Although there is a significant drop from 6 months in 2001 to 5 months in 2002, all
previous and proceeding years display an average waiting period of 5 months. Despite this, over
time the average waiting period is decreasing.
(189 words)
14. Summarise the information by selecting and reporting the main features and make
comparisons where relevant.
Write at least 150 words
Autumatic Photo Booth
www.bkenglish.edu.vn
TRUNG TÂM NGOẠI NGỮ ĐẠI HỌC BÁCH KHOA – ĐẠI HỌC QUỐC GIA TP.HỒ CHÍ MINH
The flow chart shows the main feature of a coin-operated photo booth, which allows the user to
take large or passport-size self-portraits.
Two buttons on the outside of the booth allow you to select the size of photo (large format or
passport size). If the large format setting is chosen, you will only receive one photo. Passport sized photos are issued in sets of four. Two buttons below these let you choose colour or black
and white, although you must choose colour for passport photos. There is also a slot on the outside
of the booth for the insertion of coins, and a larger slot where the photos are delivered.
www.bkenglish.edu.vn
TRUNG TÂM NGOẠI NGỮ ĐẠI HỌC BÁCH KHOA – ĐẠI HỌC QUỐC GIA TP.HỒ CHÍ MINH
Inside the booth, there is an adjustable seat to sit on. The seat should be adjusted so that your eyes
are level with the arrow on the screen. A mirror allows you to check your appearance before the
photos are taken.
The curtain in the doorway should be closed when the photos are taken. A light to the right of the
screen comes on, telling you to prepare. After this, the flash goes off after three seconds. The
photographs are delivered outside within sixty seconds.
(193 words)
15. The pie graphs show the nutritional consistency of two dinners. Write a report to a
university lecturer describing the data.
Write at least 150 words
www.bkenglish.edu.vn
TRUNG TÂM NGOẠI NGỮ ĐẠI HỌC BÁCH KHOA – ĐẠI HỌC QUỐC GIA TP.HỒ CHÍ MINH
The graphs compare the proportion of various nutritional compounds contained in two different
foods; macaroni and medium baked potato.
In general, there are a larger percentage of carbohydrates and saturated fats in macaroni than in
medium baked potato. In contrast, medium baked potato has a much higher amount of protein and
glucose.
In particular, macaroni mainly consists of large amounts of carbohydrate and saturated fats.
Carbohydrates take up slightly more than a half, 52%, while a little less than a quarter is made up
of saturated fats. The other nutrients show relatively lower proportions.
On the other hand, medium baked potato is mostly comprised of carbohydrates and protein. The
amount of carbohydrates in the food is less than in macaroni, but they still take up the greatest
percentage of 35% in medium baked potato. Interestingly, this dinner cereal has a large amount
of protein with 25%, which is very different from macaroni. The other types of nutrients do not
show significant figures in the pie chart.
(166 words)
16. Summarise the information by selecting and reporting the main features, and make
comparisons where relevant.
www.bkenglish.edu.vn
TRUNG TÂM NGOẠI NGỮ ĐẠI HỌC BÁCH KHOA – ĐẠI HỌC QUỐC GIA TP.HỒ CHÍ MINH
Write at least 150 words
The diagram shows the two processes for manufacturing black tea. The traditional way is used for
making loose tea and modern process is ideal for teabags.
When collecting tea, the tea picker picks only the two top leaves and the bud of ensure a high
quality tea. Then, the tea leaves go through withering, where leaves are spread out and air is passed
www.bkenglish.edu.vn
TRUNG TÂM NGOẠI NGỮ ĐẠI HỌC BÁCH KHOA – ĐẠI HỌC QUỐC GIA TP.HỒ CHÍ MINH
through withering, where leaves are spread out and air is passed through them to remove up to 60
per cent of their moisture.
After that, the leaves are ready for rolling or cutting. Factories use traditional methods of rolling
and crushing or faster modern methods of cutting, tearing and curling to make teabags. In both
processes, natural enzymes are produced from the leaves. The next step is oxidation, where the
enzymes from the leaves mix with the air. This changes the colour of the leaves from green to
copper and creates a nice flavour and aroma. Finally, the leaves are fired and dried. By this stage,
little moisture remains in the tea-just three per cent.
(178 words)
17. The diagram shows the relationship between a numbers of different languages.
Summarise the information by selecting and reporting the main features, and make
comparisons where relevant.
Write at least 150 words
The diagram shows the varieties of English spoken throughout the world and how they are related.
www.bkenglish.edu.vn
TRUNG TÂM NGOẠI NGỮ ĐẠI HỌC BÁCH KHOA – ĐẠI HỌC QUỐC GIA TP.HỒ CHÍ MINH
There are two main branches of English: British English and American English. The British
English Branch is geographically wide-spread. It extends across several continents from the West
Indies, through the British Isles themselves, Africa, the Indian subcontinent, the Far East and
Australasia. In addition to the four varieties of English spoken in the British Isles (i.e. in Ireland,
Wales, Scotland and England), it includes a large number of other varieties, for instance Jamaican
English, South Africa English, and Australian English.
The American branch is largely restricted to the American continent. It comprises the varieties of
English spoken in the different region of the United States itself, as well as in Canada. Beyond
the continent, the extent of its influence is limited to the Philippines in the Far East and American
Samoa in the Pacific.
In brief, the diagram shows that, like the economic and political influence of the Anglo Saxon
countries, the reach of English has extended to virtually every region of the world.
(180 words)
18. The barchart below shows the total number of minutes (in billions) of telephone calls in
Australia, divided into three categories, from 2001- 2008. Summarise the information by
selecting and reporting the main features and make comparisons where relevant.
Write at least 150 words
www.bkenglish.edu.vn
TRUNG TÂM NGOẠI NGỮ ĐẠI HỌC BÁCH KHOA – ĐẠI HỌC QUỐC GIA TP.HỒ CHÍ MINH
The chart shows the time spent by Australian resident on different types of telephone calls between
2001 and 2008.
Local fixed line calls were the highest throughout the period, rising from 72 billion minut es in
2001 to just under 90 billion in 2003. After peaking at 90 billion the following year, these calls
had fallen back to the 2001 figure by 2008.
National and international fixed line calls grew steadily from 38 billion to 61 billion at end of the
period in question, though the growth slowed over the last two years.
There was a dramatic increase in mobile calls from 2 billion to 46 billion minutes. This rise was
particularly noticeable between 2005 and 2008, during which time the use of mobile phones
tripled.
To sum up, although local fixed line calls were still most popular in 2008, the gap between the
three categories had narrowed considerably over the second half of the period in question.
(157 words)
19. The pie charts below give information on the ages of the populations of Oman and Spain
in 2005 anf projections for 2055. Summarise the information by selecting and reporting the
main features and make comparisons where relevant.
www.bkenglish.edu.vn
TRUNG TÂM NGOẠI NGỮ ĐẠI HỌC BÁCH KHOA – ĐẠI HỌC QUỐC GIA TP.HỒ CHÍ MINH
Write at least 150 words
The pie charts show significant comparison of age groups in Oman and Spain. Initial statistics are
concerning 2005 and some predictions about the ages of the populations are made referring to
2055.
It is apparent from the charts people who were under consisted half of the population of Oman in
2005. 48% and a negligible 4% of Oman population were 15-59 and 60 and over respectively.
However, following a half century is assessed to bring staggering alteration of dominant positions
in Oman population. Proliferation from 48% to 57% can be cited as example which will make 15
to 59 year old Oman people dominant in 2055.
However, in 2005, 62 percent of Spanish people were between 19 and 59. Predictions about that
status illustrate not significant alterations in the dominance of age groups.
www.bkenglish.edu.vn