Super t beam (l=38 3m)EN Cầu Nguyễn Tri Phương Đà Nẵng
Bạn đang xem bản rút gọn của tài liệu. Xem và tải ngay bản đầy đủ của tài liệu tại đây (354.23 KB, 32 trang )
D:\Congtrinh 2010\Ha tang uu tien TP Da Nang\Comp C\NTP bridge\Calculations\Super-T beam (L=38.3m)EN.xls
DANANG PRIORITY INFRASTRUCTURE INVESTMENT PROJECT
NGUYỄN TRI PHƯƠNG BRIDGE
STRUCTURAL CALCULATION OF SUPER-T BEAM, L=38.3m
I. STRUCTURAL PARAMETER:
Design standard
Type of beam
Number of beam
Width of deck
Width of sidewalk
Width of median
Length of span
Spacing from beam top to bearing centerline
Design length
Height of deck slab
Height of beam section
Spacing of beams
Deck overlay
Diameter of wastewater pipe
:
:
:
B :
BPL :
L :
:
Ls
hb
h
S
II. STRENGTH AND ULTIMATE STRESS OF MATERIAL
2.1. Steel:
2.1.1 Prestress reinforcement
Type of stress
Modulus of elasticity
Required tensile strength of prestressing steel
Liquid limit of prestreesing steel
Before the force transferred to concrete
After stress loss
:
:
:
:
:
:
Ep
fpu
fpy
22TCN272-05
Super T
11
26.30 m
2.00 m
1.3 m
38.30 m
0.35 m
37.60 m
200 mm
1,750 mm
2,370 mm
70 mm
630 mm
= 0.9 fpu
= 0.75 f pu
= 0.80 f py
Area of reinforcement, class of 15.2mm
Tension strength desinged for 1 tendon
Ppj
Stress of reinforcement during kicking
fpj
2.1.2 High-strength steel bar
Under standard 22TCN 272-05
Modulus of elasticity
Ep
Required tensile strength of steel bar
fpu
Liquid limit of steel bar
fpy
= 0.8 fpu
2.1.3 Plain reiforcement
Under standard TCVN 1651:2008
Modulus of elasticity
Es
Liquid limit strength of reinforcement CB400-V
fsy
Liquid limit strength of reinforcement CB300-T
fsyr
2.2. Concrete
Density of concrete
γc
#########
Thermal expansion coefficient of concrete
Mean humidity
H
2.2.1 Main beam
Theoretical compressive strength of concrete at 28 age days
f'c
Concrete compressive strength when tranfering force
f'ci
= 0.85 f' c
Ec = 0.043 yc1.5 f'c0.5
Modulus of elasticity
Shear bearing capacity of plain concrete
Ultimate stress of concrete
Ultimate compressive stress when force tranfer applied
fr
Ultimate tension stress when force tranfer applied
Ultimate compressive stress when losing stress
* Prestressing + long-term load
* Live load +1/2(prestressing+long-term load)
* Prestressing + Long-term load + Live load
Tension stress after losing stress
2.2.2 Bridge deck
Theoretical compressive strength of concrete at 28 age days
Modulus of elasticity
Ultimate compressive stress when losing stress
* Prestressing + long-term load
=
=
Dr. Songkiat
Dated
4/21/2010
### mm
Pretension stress
197,000 (MPa)
1,860 (MPa)
1,674 (MPa)
1,395 (MPa)
1,339 (MPa)
(A.5.4.2)
(T.5.4.4.1-1)
(T.5.4.4.1-1)
(T.5.9.3-1)
(T.5.9.3-1)
140 mm2
195 KN
1395 MPa
=
=
=
207,000 (MPa)
1,035 (MPa)
828 (MPa)
(A.5.4.4)
(T.5.4.4.1-1)
(T.5.4.4.1-1)
=
=
=
200,000 (MPa)
400 (Mpa)
300 (Mpa)
(A.5.4.3.2)
=
=
=
2,400 (Kg/m³)
10.8E-6 / 0 C
85 %
(Bảng 3.5.1)
(A.5.4.2.2)
=
=
50 (MPa)
42.5 (MPa)
(A.5.4.2.1)
=
35,750 (MPa)
(A.5.4.2.1)
=
4.45 (MPa)
(A.5.4.2.6)
= 0.6 f'ci
=
25.5 (MPa)
(A.5.9.4.1.1)
=0.58f'ci0.5
=
3.78 (MPa)
(T5.9.4.1.2)
= 0.45 f' c
= 0.4 f'c
= 0.6 f'c
=
=
=
22.5 (MPa)
20 (Mpa)
30 (Mpa)
(T5.9.4.2.1-1)
(T5.9.4.2.1-1)
(T5.9.4.2.1-1)
= 0.5 f'c0.5
=
3.54 (Mpa)
(T5.9.4.2.2-1)
f'cs
=
35 (MPa)
(A.5.4.2.1)
Ecs = 0.043 yc1.5 f'cs0
=
29,910 (MPa)
(A.5.4.2.1)
=
15.8 (MPa)
(T5.9.4.2.1-1)
=
2.96 (Mpa)
(T5.9.4.2.2-1)
=
Page: 1
:
=
=
=
=
=
Phucdh
Checked by
=0.63f'c0.5
= 0.45f'cs
Tension stress after losing stress
=> be =
Calculated by
0.5f'cs0.5
Initial Data
D:\Congtrinh 2010\Ha tang uu tien TP Da Nang\Comp C\NTP bridge\Calculations\Super-T beam (L=38.3m)EN.xls
2.3. Material conversion factor
Prestressing reinforcement/Concrete of main beam
Rpc
= Ep / Ec
Reinforcement/Concrete of main beam
Rsc
= Es / Ec
Concrete of bridge deck/Concrete of main beam
Rdc
= Ecs / Ec
3. Load and impact
During construction, the following loads shall be considered and calculated
- Self weight of beam.
- Tensile force of prestressing strand.
- Effect of creep shrinkage during construction
During the using, there are additional loads as follows
- Effect of creep shrinkage during the using
- Weigth of dead load , part 2 (bridge deck, hand rail, wheel guard).
- Live load of vehicle.
3.1. Design live load effects on one main beam
3.1.1. Dead load of seft beam
- Dead load of seft beam, DC1=
18.27
- Lead load of divided wall, DC2=
0.32
- Concrete of bridge deck, DC3=
11.16
- Remaining formwork, DC4=
1.00
Total:
30.75
3.1.2. Weigth of dead load, part 2
- Hand rail, sidewalk, DC5=
2.50
- Deck overlay, DW=
3.77
Total:
6.27
3.2. Live load
3.2.1. Live load of vehicle
Carriage-way width
Bx =
21.00
Number of lanes as designed
nx =
6
Coefficient of lane
m=
0.65
Designed live load of vehicle HL-93 consists one combination of
Design truck and load of lane
or two-axled truck and load of lane
3.2.2. Designed truck has total of weight
325 kN
=
=
=
5.51
5.59
0.84
kN/m
kN/m
kN/m
kN/m
kN/m
kN/m
kN/m
kN/m
(Calculation for exteior beam)
m
lane
4.3 m
4.3 to 9 m
P3
P2
35 kN
145 kN
145 kN
3.2.3. Designed two-axled truck
Two-axled truck consists a pair of axles 110 kN, apart 1.2m. Horizontal spacing of wheels
is 1.8m, total weigth of vehicle is :
220 KN
Impact coefficient follows to Clause 3.6.2 - Standard 22TCN272-05
1.20 m
P1
110 kN
110 kN
3.2.4. Designed load of lane
qL
Stressing force of designed load of lane does not include impact coefficient
3.2.5. Live load of pedestrian (PL)
Width of road for pedestrian
Bpl =
Number of lanes for pedestrian
npl =
Load for pedestrian
Uniform load of pedestrian according to longitudinal of bridge
PL =
qpl =
9.3
kN/m
2.00 m
2 làn
3.0 kN/m2
6.0 kN/m/1side
III. DISTRIBUTION COEFFICIENT
1. Calculate the horizontal distribution coefficient due to live load
Look up the table 4.6.2.2.1-1, we have the formula for computation of horizontal distribution coefficient as follows:
The values used for computation :
+ Nb
: Number of beam
= 11
beam
Page: 2
Initial Data
D:\Congtrinh 2010\Ha tang uu tien TP Da Nang\Comp C\NTP bridge\Calculations\Super-T beam (L=38.3m)EN.xls
+S
: Spacing of beams
+L
: Span of beam
+ ts
: Thickness of concrete slab of bridge deck
+n
: Ratio of elasticity modulus
+d
: Height of main beam
1.1. Distribution coefficient of moment
* Internal beam
• One design lane loaded
=
=
=
=
=
2370
38300
200
0.837
1750
=
0.32
=
0.55
=
0.39
=
=
0.00 mm
0.97
=
0.53
gV = (S/3050)0.6(d/L)0.1
• Two or more design lanes loaded
=
0.63
gV = (S/2250)0.8(d/L)0.1
=
0.77
gM = (S/910)0,35(Sd/L2)0,25
• Two or more design lanes loaded
gM = (S/1900)0,6(Sd/L2)0,125
mm
mm
mm
mm
* Exterior beam
• One design lane loaded
gMSE
• Two or more design lanes loaded
de =
e = 0,97 + d e/8700
gMSE
= 1,2gM
= egM
1.2. Distribution coefficient of shear force
* Internal beam
• One design lane loaded
* Exterior beam
• One design lane loaded, lever rule
P/2
P/2
R1
R1
= P/2*1070/2370
= 0.23 P
gVSE = 1.2R1 =1.2x0.23
= 0.27 P
• Two or more design lanes loaded
e = 0,8 + d e/3050
gVSE
2. Effect of skewed bridge (4.6.2.2.2d)
= egV
=
0.80
=
0.61
• Skewed bridge
θ =
0o
Reduction of distribution coefficient of load for moment of longitudinal beam on skewed support
min(1.05-0.25tgθ ; 1) =
1.00
Adjustment of distribution coefficient of load for shear force of the longitudinal beam on skewed support
1 + ((Ld)0.5/6S)tan(θ)
3. Computation result of distribution coefficient of load
Position of beam
Internal
Internal
Exterior
Exterior
=
Number of lane
1
≥2
MAX
1
≥2
MAX
1.00
gM
0.32
0.55
0.55
0.39
0.53
0.53
gV
0.63
0.77
0.77
0.27
0.61
0.61
IV. PERIOD OF COMPUTATION
Structure to be analysed through 2 phases as follows:
1. Phase 1
- Computation with load:
+ Dead live of self section of beam (DC)
+ Dead load of divided wall (DC)
+ Acting of Prestressing (PS)
Page: 3
Initial Data
D:\Congtrinh 2010\Ha tang uu tien TP Da Nang\Comp C\NTP bridge\Calculations\Super-T beam (L=38.3m)EN.xls
2. Phase 2
- Computation with load:
+ Dead load of self beam (DC)
18.27
+ Dead load of divided wall (DC)
0.32
+ Dead load of self deck (DC)
11.16
+ Dead load of remaining formwork
1.00
+ Hand rail, sidewalk (DC)
2.50
+ Dead load of deck overlays (DW)
3.77
+ Wastewater treatment pipe (P)
3.33
+ Live load of vehicle (combined compact stress) LL+ IM; human
V. LOAD COMBINATION
1. Adjustment coefficient of load
Adjustment coefficient of load :
Relative coefficients
Strength limit state
Service limit state
η= ηDηRηΙ
Flexibility
ηD
1.00
1.00
2. Strength limit states and load combination coefficient:
Load combination at strength limit state I
η{1.25DC+1.5DW+1.2P+1.75PL + 1.75(LL+IM)}
Load combination at service limit state
η{DC+DW+P+PL+(LL+IM)}
Page: 4
kN/m/1beam
kN/m/1beam
kN/m/1beam
kN/m/1beam
kN/m/1beam
kN/m/1beam
kN/m/1beam
(1.3.2)
Redundancy
ηR
1.00
1.00
Importance
ηI
1.05
1.00
η
1.05
1.00
(3.4)
Initial Data
D:\Congtrinh 2010\Ha tang uu tien TP Da Nang\Comp C\NTP bridge\Calculations\Super-T beam (L=38.3m)EN.xls
DANANG PRIORITY INFRASTRUCTURE INVESTMENT PROJECT
NGUYỄN TRI PHƯƠNG BRIDGE
STRUCTURAL CALCULATION OF SUPER-T BEAM, L=38.3m
Calculated by
Phucdh
Checked by Dr. Songkiat
Dated
4/21/2010
MORPHOLOGIC FEATURE OF SECTION
I.INTRODUCTION:
Character of reinforcement concrete section shall be calculated in 41 positions of length of beam (0.025Ls for 1 section)
Character of section shall be calculated with two main states
First state
: Beam combinate strand before concreting bridge deck
Second state
: Beam combinate strand and bridge deck at the time of using
II. CHARACTER OF BEAM COMPUTATION SECTION
Height of beam
:
1,750 (mm)
Height of beginning section of beam
:
800 (mm)
Height of bridge deck
:
200 (mm)
Width conversion of deck slab
:
1,983 (mm)
Length of beginning section of beam
:
850 (mm)
:
1,425 (mm)
Length of plain section
:
Length of hollow section
33,750 (mm)
Section
Stage I (at the completion time of tensile)
f. sup.
Aconc
Iconc.
e conc.
Astrand
Istrand
estrand
A*e
(mm)
0
940
1,880
2,820
3,760
4,700
5,640
6,580
7,520
8,460
9,400
10,340
11,280
12,220
13,160
14,100
15,040
15,980
16,920
17,860
18,800
Section
f. sup.
(mm)
0
940
1,880
2,820
3,760
4,700
5,640
6,580
7,520
8,460
9,400
10,340
11,280
12,220
13,160
14,100
15,040
15,980
(m2)
0.943
1.671
1.671
0.692
0.692
0.692
0.692
0.692
0.692
0.692
0.692
0.692
0.692
0.692
0.692
0.692
0.692
0.692
0.692
0.692
0.692
(m4)
0.056
0.456
0.456
0.265
0.265
0.265
0.265
0.265
0.265
0.265
0.265
0.265
0.265
0.265
0.265
0.265
0.265
0.265
0.265
0.265
0.265
(m)
1.399
0.993
0.993
0.888
0.888
0.888
0.888
0.888
0.888
0.888
0.888
0.888
0.888
0.888
0.888
0.888
0.888
0.888
0.888
0.888
0.888
Aconc.
Iconc.
econc.
(m2)
0.943
1.671
1.671
0.692
0.692
0.692
0.692
0.692
0.692
0.692
0.692
0.692
0.692
0.692
0.692
0.692
0.692
0.692
(m4)
0.056
0.456
0.456
0.265
0.265
0.265
0.265
0.265
0.265
0.265
0.265
0.265
0.265
0.265
0.265
0.265
0.265
0.265
(m)
1.399
0.993
0.993
0.888
0.888
0.888
0.888
0.888
0.888
0.888
0.888
0.888
0.888
0.888
0.888
0.888
0.888
0.888
(m2)
0.002
0.015
0.015
0.018
0.025
0.028
0.028
0.033
0.033
0.035
0.035
0.035
0.035
0.035
0.035
0.035
0.035
0.035
0.035
0.035
0.035
(m4)
0.000
0.004
0.004
0.004
0.004
0.004
0.004
0.004
0.004
0.004
0.004
0.004
0.004
0.004
0.004
0.004
0.004
0.004
0.004
0.004
0.004
(m)
1.675
0.306
0.306
0.277
0.237
0.226
0.226
0.211
0.211
0.210
0.210
0.210
0.210
0.210
0.210
0.210
0.210
0.210
0.210
0.210
0.210
(m3)
1.322
1.663
1.663
0.619
0.620
0.621
0.621
0.621
0.621
0.622
0.622
0.622
0.622
0.622
0.622
0.622
0.622
0.622
0.622
0.622
0.622
AcombI
(m2)
0.945
1.686
1.686
0.710
0.717
0.720
0.720
0.725
0.725
0.727
0.727
0.727
0.727
0.727
0.727
0.727
0.727
0.727
0.727
0.727
0.727
Stage I (at the time of concreting the bridge deck)
Astrand
Istrand
estrand
A*e
AcombI
(m2)
0.002
0.014
0.014
0.017
0.023
0.026
0.026
0.031
0.031
0.032
0.032
0.032
0.032
0.032
0.032
0.032
0.032
0.032
Page: 5
(m4)
0.000
0.003
0.003
0.003
0.003
0.004
0.004
0.004
0.004
0.004
0.004
0.004
0.004
0.004
0.004
0.004
0.004
0.004
(m)
1.675
0.306
0.306
0.277
0.237
0.226
0.226
0.211
0.211
0.210
0.210
0.210
0.210
0.210
0.210
0.210
0.210
0.210
(m3)
1.322
1.663
1.663
0.619
0.620
0.620
0.620
0.621
0.621
0.621
0.621
0.621
0.621
0.621
0.621
0.621
0.621
0.621
(m2)
0.945
1.685
1.685
0.709
0.715
0.718
0.718
0.723
0.723
0.724
0.724
0.724
0.724
0.724
0.724
0.724
0.724
0.724
IcombI
(m4)
0.057
0.466
0.466
0.276
0.279
0.281
0.281
0.284
0.284
0.285
0.285
0.285
0.285
0.285
0.285
0.285
0.285
0.285
0.285
0.285
0.285
IcombI
(m4)
0.056
0.466
0.466
0.275
0.278
0.280
0.280
0.283
0.283
0.283
0.283
0.283
0.283
0.283
0.283
0.283
0.283
0.283
ecombI
(m)
1.400
0.987
0.987
0.872
0.865
0.862
0.862
0.857
0.857
0.855
0.855
0.855
0.855
0.855
0.855
0.855
0.855
0.855
0.855
0.855
0.855
ecombI
(m)
1.400
0.987
0.987
0.873
0.867
0.864
0.864
0.859
0.859
0.857
0.857
0.857
0.857
0.857
0.857
0.857
0.857
0.857
Section
D:\Congtrinh 2010\Ha tang uu tien TP Da Nang\Comp C\NTP bridge\Calculations\Super-T beam (L=38.3m)EN.xls
16,920
17,860
18,800
Section
f. sup.
(mm)
0
940
1,880
2,820
3,760
4,700
5,640
6,580
7,520
8,460
9,400
10,340
11,280
12,220
13,160
14,100
15,040
15,980
16,920
17,860
18,800
0.692
0.692
0.692
AcombI
(m2)
0.945
1.685
1.685
0.709
0.715
0.718
0.718
0.723
0.723
0.724
0.724
0.724
0.724
0.724
0.724
0.724
0.724
0.724
0.724
0.724
0.724
0.265
0.265
0.265
IcombI
(m4)
0.056
0.466
0.466
0.275
0.278
0.280
0.280
0.283
0.283
0.283
0.283
0.283
0.283
0.283
0.283
0.283
0.283
0.283
0.283
0.283
0.283
0.888
0.888
0.888
ecombI
(m)
1.400
0.987
0.987
0.873
0.867
0.864
0.864
0.859
0.859
0.857
0.857
0.857
0.857
0.857
0.857
0.857
0.857
0.857
0.857
0.857
0.857
0.032
0.032
0.032
0.004
0.004
0.004
0.210
0.210
0.210
0.621
0.621
0.621
Aslab
Stage II (At service)
Islab
eslab
A*e
(m2)
0.397
0.397
0.397
0.397
0.397
0.397
0.397
0.397
0.397
0.397
0.397
0.397
0.397
0.397
0.397
0.397
0.397
0.397
0.397
0.397
0.397
(m4)
0.001
0.001
0.001
0.001
0.001
0.001
0.001
0.001
0.001
0.001
0.001
0.001
0.001
0.001
0.001
0.001
0.001
0.001
0.001
0.001
0.001
(m3)
2.056
2.397
2.397
1.353
1.353
1.354
1.354
1.355
1.355
1.355
1.355
1.355
1.355
1.355
1.355
1.355
1.355
1.355
1.355
1.355
1.355
Page: 6
(m)
1.850
1.850
1.850
1.850
1.850
1.850
1.850
1.850
1.850
1.850
1.850
1.850
1.850
1.850
1.850
1.850
1.850
1.850
1.850
1.850
1.850
0.724
0.724
0.724
AcombI
(m2)
1.341
2.081
2.081
1.106
1.112
1.115
1.115
1.119
1.119
1.121
1.121
1.121
1.121
1.121
1.121
1.121
1.121
1.121
1.121
1.121
1.121
0.283
0.283
0.283
IcombI
(m4)
0.114
0.706
0.706
0.519
0.526
0.530
0.530
0.535
0.535
0.537
0.537
0.537
0.537
0.537
0.537
0.537
0.537
0.537
0.537
0.537
0.537
0.857
0.857
0.857
ecombI
(m)
1.533
1.151
1.151
1.224
1.217
1.215
1.215
1.210
1.210
1.209
1.209
1.209
1.209
1.209
1.209
1.209
1.209
1.209
1.209
1.209
1.209
Section
D:\Congtrinh 2010\Ha tang uu tien TP Da Nang\Comp C\NTP bridge\Calculations\Super-T beam (L=38.3m)EN.xls
DANANG PRIORITY INFRASTRUCTURE INVESTMENT PROJECT
NGUYỄN TRI PHƯƠNG BRIDGE
Calculated by
Phucdh
Checked by
Dr. Songkiat
STRUCTURAL CALCULATION OF SUPER-T BEAM, L=38.3m
Dated
4/21/2010
POSITION OF TENDONS
I. DIMENSION OF MAIN BEAM
Calculated length
:
37.60 (mm)
Height of beam
:
1,750 (mm)
Height of section of beam edge
800 (mm)
Length of section at the beam edge
850 (mm)
At the time of completion of tensile
Elasticity modulus of concrete when
32,959 Mpa
Force transfer applied
197,000 Mpa
Elasticity modulus of tendon
Diameter of wire
:
15.2 (mm)
Conversion factor
:
6.0
At the time of concreting the bridge deck
Elasticity modulus of concrete when
35,750 Mpa
concreting the bridge deck
Elasticity modulus of tendon
197,000 Mpa
Diameter of wire
:
15.2 (mm)
Conversion factor
:
Period of service
Elasticity modulus of concrete when
force transfer applied
Elasticity modulus of tendon
Diameter of wire
:
Conversion factor
5.5
140 (mm2)
837 (mm2)
1,589 (mm4)
56,757 (mm4)
140 (mm2)
771 (mm2)
1,589 (mm4)
48,243 (mm4)
140 (mm2)
771 (mm2)
1,589 (mm4)
48,243 (mm4)
35,750 Mpa
197,000 Mpa
15.2 (mm)
:
5.5
II. POSITION OF STRAND
From CL
-510
-300
-250
-200
-150
-100
-50
0
50
100
150
200
250
300
510
Total of tendons
Position of tendon
1
2
3
4
5
6
7
8
9
10
11
12
13
14
15
Row A
75
Debonded length (mm)
Row B Row C Row D
125
175
225
Row E
1675
0
0
0
2000
3000
6000
0
6000
3000
2000
0
0
0
0
3000
4000
6000
3000
0
3000
6000
4000
3000
0
0
0
3000
4000
0
6000
8000
0
2000
8000
6000
0
4000
3000
0
2000
0
11
13
12
4
0
2
42 strand
III. CHARACTER OF TENDON SECTION:
AT THE COMPLETION TIME OF FORCE TRANFER
Section
0
0.025Ls
0.050Ls
0.075Ls
0.100Ls
0.125Ls
0.150Ls
0.175Ls
Position
0
940
1,880
2,820
3,760
4,700
5,640
6,580
Row A
0
5
5
7
9
9
9
11
Row B
0
5
5
5
9
11
11
13
Row C
0
4
4
4
6
8
8
10
Page: 7
Row D
Row E
0
2
2
4
4
4
4
4
Total
2
2
2
2
2
2
2
2
2
18
18
22
30
34
34
40
Aconversion
1,674
15,062
15,062
18,409
25,104
28,451
28,451
33,471
Distance to
bottom of
beam
1,675
306
306
277
237
226
226
211
Iconversion
113,514
3,566,311,687
3,566,311,687
3,651,633,104
3,774,283,293
3,798,785,323
3,798,785,323
3,851,434,228
Cable
D:\Congtrinh 2010\Ha tang uu tien TP Da Nang\Comp C\NTP bridge\Calculations\Super-T beam (L=38.3m)EN.xls
0.200Ls
0.225Ls
0.250Ls
0.275Ls
0.300Ls
0.325Ls
0.350Ls
0.375Ls
0.400Ls
0.425Ls
0.450Ls
0.475Ls
0.500Ls
7,520
8,460
9,400
10,340
11,280
12,220
13,160
14,100
15,040
15,980
16,920
17,860
18,800
11
11
11
11
11
11
11
11
11
11
11
11
11
13
13
13
13
13
13
13
13
13
13
13
13
13
10
12
12
12
12
12
12
12
12
12
12
12
12
4
4
4
4
4
4
4
4
4
4
4
4
4
2
2
2
2
2
2
2
2
2
2
2
2
2
40
42
42
42
42
42
42
42
42
42
42
42
42
33,471
35,145
35,145
35,145
35,145
35,145
35,145
35,145
35,145
35,145
35,145
35,145
35,145
211
210
210
210
210
210
210
210
210
210
210
210
210
3,851,434,228
3,853,642,198
3,853,642,198
3,853,642,198
3,853,642,198
3,853,642,198
3,853,642,198
3,853,642,198
3,853,642,198
3,853,642,198
3,853,642,198
3,853,642,198
3,853,642,198
AT THE TIME OF CONCRETING THE BRIDGE DECK
Section
0
0.025Ls
0.050Ls
0.075Ls
0.100Ls
0.125Ls
0.150Ls
0.175Ls
0.200Ls
0.225Ls
0.250Ls
0.275Ls
0.300Ls
0.325Ls
0.350Ls
0.375Ls
0.400Ls
0.425Ls
0.450Ls
0.475Ls
0.500Ls
Position
0
940
1,880
2,820
3,760
4,700
5,640
6,580
7,520
8,460
9,400
10,340
11,280
12,220
13,160
14,100
15,040
15,980
16,920
17,860
18,800
Row A
0
5
5
7
9
9
9
11
11
11
11
11
11
11
11
11
11
11
11
11
11
Row B
0
5
5
5
9
11
11
13
13
13
13
13
13
13
13
13
13
13
13
13
13
Row C
Row D
0
4
4
4
6
8
8
10
10
12
12
12
12
12
12
12
12
12
12
12
12
Row E
0
2
2
4
4
4
4
4
4
4
4
4
4
4
4
4
4
4
4
4
4
Total
2
2
2
2
2
2
2
2
2
2
2
2
2
2
2
2
2
2
2
2
2
2
18
18
22
30
34
34
40
40
42
42
42
42
42
42
42
42
42
42
42
42
Aconversion
1,543
13,887
13,887
16,973
23,144
26,230
26,230
30,859
30,859
32,402
32,402
32,402
32,402
32,402
32,402
32,402
32,402
32,402
32,402
32,402
32,402
Distance to
bottom of
beam
1,675
306
306
277
237
226
226
211
211
210
210
210
210
210
210
210
210
210
210
210
210
Iconversion
96,487
3,287,903,404
3,287,903,404
3,366,549,528
3,479,594,744
3,502,168,164
3,502,168,164
3,550,683,552
3,550,683,552
3,552,711,032
3,552,711,032
3,552,711,032
3,552,711,032
3,552,711,032
3,552,711,032
3,552,711,032
3,552,711,032
3,552,711,032
3,552,711,032
3,552,711,032
3,552,711,032
PERIOD OF USING
Section
0
0.025Ls
0.050Ls
0.075Ls
0.100Ls
0.125Ls
0.150Ls
0.175Ls
0.200Ls
0.225Ls
0.250Ls
0.275Ls
0.300Ls
0.325Ls
0.350Ls
0.375Ls
0.400Ls
0.425Ls
0.450Ls
0.475Ls
0.500Ls
Position
0
940
1,880
2,820
3,760
4,700
5,640
6,580
7,520
8,460
9,400
10,340
11,280
12,220
13,160
14,100
15,040
15,980
16,920
17,860
18,800
Row A
0
5
5
7
9
9
9
11
11
11
11
11
11
11
11
11
11
11
11
11
11
Row B
0
5
5
5
9
11
11
13
13
13
13
13
13
13
13
13
13
13
13
13
13
Row C
0
4
4
4
6
8
8
10
10
12
12
12
12
12
12
12
12
12
12
12
12
Page: 8
Row D
Row E
0
2
2
4
4
4
4
4
4
4
4
4
4
4
4
4
4
4
4
4
4
Total
2
2
2
2
2
2
2
2
2
2
2
2
2
2
2
2
2
2
2
2
2
2
18
18
22
30
34
34
40
40
42
42
42
42
42
42
42
42
42
42
42
42
Aconversion
1,543
13,887
13,887
16,973
23,144
26,230
26,230
30,859
30,859
32,402
32,402
32,402
32,402
32,402
32,402
32,402
32,402
32,402
32,402
32,402
32,402
Distance to
bottom of
beam
1,675
306
306
277
237
226
226
211
211
210
210
210
210
210
210
210
210
210
210
210
210
Iconversion
96,487
3,287,903,404
3,287,903,404
3,366,549,528
3,479,594,744
3,502,168,164
3,502,168,164
3,550,683,552
3,550,683,552
3,552,711,032
3,552,711,032
3,552,711,032
3,552,711,032
3,552,711,032
3,552,711,032
3,552,711,032
3,552,711,032
3,552,711,032
3,552,711,032
3,552,711,032
3,552,711,032
Cable
D:\Congtrinh 2010\Ha tang uu tien TP Da Nang\Comp C\NTP bridge\Calculations\Super-T beam (L=38.3m)EN.xls
DANANG PRIORITY INFRASTRUCTURE INVESTMENT PROJECT
NGUYỄN TRI PHƯƠNG BRIDGE
STRUCTURAL CALCULATION OF SUPER-T BEAM, L=38.3m
Calculated by
Checked by
Dated
Phucdh
Dr. Songkiat
4/21/2010
COMPUTATION OF INTERNAL FORCE
I. DESIGNED INTERNAL FORCE DUE TO DEAD LOAD
ĐAH Moment
ĐAH Shear
Table value of influence line for moment
Section
x
y
Area
(m)
(m)
(m)
(m2)
0.00
0.000
0.000
0.00
0.94
0.940
0.917
17.23
1.88
1.880
1.786
33.58
2.82
2.820
2.609
49.04
3.76
3.760
3.384
63.62
4.70
4.700
4.113
77.32
5.64
5.640
4.794
90.13
6.58
6.580
5.429
102.06
7.52
7.520
6.016
113.10
8.46
8.460
6.557
123.26
9.40
9.400
7.050
132.54
10.34
10.340
7.497
140.93
11.28
11.280
7.896
148.44
12.22
12.220
8.249
155.07
13.16
13.160
8.554
160.82
14.10
14.100
8.813
165.68
15.04
15.040
9.024
169.65
15.98
15.980
9.189
172.74
16.92
16.920
9.306
174.95
17.86
17.860
9.377
176.28
18.80
18.800
9.400
176.72
Section
(m)
0.00
0.94
1.88
2.82
3.76
4.70
5.64
6.58
7.52
8.46
9.40
10.34
11.28
12.22
13.16
14.10
15.04
15.98
16.92
17.86
18.80
Table value of influence line for shear
x
y1
y2
Area (+)
Area (+)
(m)
(m)
(m)
(m2)
(m2)
0.000
1.000
0.000
18.800
0.000
0.940
0.975
0.025
17.872
0.012
1.880
0.950
0.050
16.967
0.047
2.820
0.925
0.075
16.086
0.106
3.760
0.900
0.100
15.228
0.188
4.700
0.875
0.125
14.394
0.294
5.640
0.850
0.150
13.583
0.423
6.580
0.825
0.175
12.796
0.576
7.520
0.800
0.200
12.032
0.752
8.460
0.775
0.225
11.292
0.952
9.400
0.750
0.250
10.575
1.175
10.340
0.725
0.275
9.882
1.422
11.280
0.700
0.300
9.212
1.692
12.220
0.675
0.325
8.566
1.986
13.160
0.650
0.350
7.943
2.303
14.100
0.625
0.375
7.344
2.644
15.040
0.600
0.400
6.768
3.008
15.980
0.575
0.425
6.216
3.396
16.920
0.550
0.450
5.687
3.807
17.860
0.525
0.475
5.182
4.242
18.800
0.500
0.500
4.700
4.700
Page: 9
Area
(m2)
18.800
17.860
16.920
15.980
15.040
14.100
13.160
12.220
11.280
10.340
9.400
8.460
7.520
6.580
5.640
4.700
3.760
2.820
1.880
0.940
0.000
Loading
D:\Congtrinh 2010\Ha tang uu tien TP Da Nang\Comp C\NTP bridge\Calculations\Super-T beam (L=38.3m)EN.xls
MOMENT DUE TO DEAD LOAD
Phase I
Section
Load of
main beam
(m)
0.00
0.94
1.88
2.82
3.76
4.70
5.64
6.58
7.52
8.46
9.40
10.34
11.28
12.22
13.16
14.10
15.04
15.98
16.92
17.86
18.80
(KNm)
0.00
314.79
613.45
895.95
1,162.32
1,412.54
1,646.62
1,864.55
2,066.34
2,251.99
2,421.50
2,574.86
2,712.08
2,833.15
2,938.08
3,026.87
3,099.52
3,156.02
3,196.38
3,220.59
3,228.66
Phase II
Divided Remainin
wall
g forwork
Deck
overlay
(KNm)
0.00
5.52
10.75
15.70
20.37
24.75
28.85
32.67
36.21
39.46
42.43
45.12
47.52
49.65
51.48
53.04
54.31
55.30
56.01
56.44
56.58
(KNm)
0.00
64.88
126.44
184.67
239.57
291.14
339.39
384.31
425.90
464.17
499.10
530.71
559.00
583.95
605.58
623.88
638.85
650.50
658.82
663.81
665.47
(KNm)
0.00
17.24
33.60
49.07
63.66
77.36
90.18
102.12
113.17
123.34
132.62
141.02
148.54
155.17
160.91
165.78
169.76
172.85
175.06
176.39
176.83
Deck slab
Hand rail,
sidewalk
(KNm)
0.00
192.29
374.71
547.28
709.98
862.82
1,005.81
1,138.93
1,262.19
1,375.59
1,479.13
1,572.81
1,656.62
1,730.58
1,794.67
1,848.91
1,893.28
1,927.80
1,952.45
1,967.24
1,972.17
(KNm)
0.00
43.08
83.94
122.60
159.05
193.29
225.32
255.14
282.75
308.16
331.35
352.34
371.11
387.68
402.04
414.19
424.13
431.86
437.38
440.70
441.80
Wastewater
treatment
pipe
(KNm)
0.00
57.39
111.84
163.34
211.90
257.52
300.19
339.92
376.71
410.55
441.46
469.41
494.43
516.50
535.63
551.82
565.06
575.36
582.72
587.14
588.61
SHEAR FORCE DUE TO DEAD LOAD
Phase I
Section
Load of
main beam
(mm)
0.00
0.94
1.88
2.82
3.76
4.70
5.64
6.58
7.52
8.46
9.40
10.34
11.28
12.22
13.16
14.10
15.04
15.98
16.92
17.86
18.80
(KN)
343.47
326.30
309.13
291.95
274.78
257.61
240.43
223.26
206.08
188.91
171.74
154.56
137.39
120.22
103.04
85.87
68.69
51.52
34.35
17.17
0.00
Phase II
Divided Remainin
wall
g forwork
(KN)
6.02
5.72
5.42
5.12
4.82
4.51
4.21
3.91
3.61
3.31
3.01
2.71
2.41
2.11
1.81
1.50
1.20
0.90
0.60
0.30
0.00
(KN)
18.81
17.87
16.93
15.99
15.05
14.11
13.17
12.23
11.29
10.35
9.41
8.47
7.52
6.58
5.64
4.70
3.76
2.82
1.88
0.94
0.00
Deck
overlay
(KN)
70.79
67.26
63.72
60.18
56.64
53.10
49.56
46.02
42.48
38.94
35.40
31.86
28.32
24.78
21.24
17.70
14.16
10.62
7.08
3.54
0.00
Page: 10
Deck slab
Hand rail,
sidewalk
(KN)
209.81
199.32
188.82
178.33
167.84
157.35
146.86
136.37
125.88
115.39
104.90
94.41
83.92
73.43
62.94
52.45
41.96
31.47
20.98
10.49
0.00
(KN)
47.00
44.65
42.30
39.95
37.60
35.25
32.90
30.55
28.20
25.85
23.50
21.15
18.80
16.45
14.10
11.75
9.40
7.05
4.70
2.35
0.00
Wastewater
treatment
pipe
(KNm)
62.62
59.49
56.36
53.23
50.09
46.96
43.83
40.70
37.57
34.44
31.31
28.18
25.05
21.92
18.79
15.65
12.52
9.39
6.26
3.13
0.00
Loading
D:\Congtrinh 2010\Ha tang uu tien TP Da Nang\Comp C\NTP bridge\Calculations\Super-T beam (L=38.3m)EN.xls
II. DESIGNED INTERNAL FORCE DUE TO LIVE LOAD
MOMENT DUE TO LIVE LOAD
Standard truck
Section
(m)
0.00
0.94
1.88
2.82
3.76
4.70
5.64
6.58
7.52
8.46
9.40
10.34
11.28
12.22
13.16
14.10
15.04
15.98
16.92
17.86
18.80
Section
(m)
0.00
0.94
1.88
2.82
3.76
4.70
5.64
6.58
7.52
8.46
9.40
10.34
11.28
12.22
13.16
14.10
15.04
15.98
16.92
17.86
18.80
145 KN
145 KN
yi (m)
yi (m)
0.00
0.00
0.92
0.81
1.79
1.57
2.61
2.29
3.38
2.95
4.11
3.58
4.79
4.15
5.43
4.68
6.02
5.16
6.56
5.59
7.05
5.98
7.50
6.31
7.90
6.61
8.25
6.85
8.55
7.05
8.81
7.20
9.02
7.30
9.19
7.36
9.31
7.37
9.38
7.33
9.40
7.25
35 KN
yi (m)
0.00
0.70
1.36
1.96
2.52
3.04
3.50
3.92
4.30
4.62
4.90
5.13
5.32
5.45
5.54
5.59
5.58
5.53
5.44
5.29
5.10
Load of
MLL+IM
Live load of
ΣPiyi
(KNm)
0.00
198.33
386.32
563.97
731.28
888.25
1,034.88
1,171.17
1,297.12
1,412.73
1,518.00
1,612.93
1,697.52
1,771.77
1,835.68
1,889.25
1,932.48
1,965.37
1,987.92
2,000.13
2,002.00
lane
(KNm)
0.00
160.24
312.26
456.07
591.66
719.03
838.18
949.12
1,051.84
1,146.34
1,232.62
1,310.69
1,380.54
1,442.17
1,495.58
1,540.78
1,577.76
1,606.52
1,627.06
1,639.39
1,643.50
(KNm)
0.00
503.68
980.05
1,429.10
1,850.85
2,245.28
2,612.40
2,952.21
3,264.71
3,549.90
3,807.78
4,038.34
4,241.60
4,417.54
4,566.18
4,687.50
4,781.51
4,848.20
4,887.59
4,899.67
4,884.43
pedestrian
(KNm)
0.00
103.38
201.46
294.24
381.72
463.89
540.76
612.33
678.60
739.57
795.24
845.61
890.67
930.43
964.89
994.05
1,017.91
1,036.46
1,049.72
1,057.67
1,060.32
Designed two-axle vehicle
110 KN 110 KN
ΣPiyi
yi
yi
(KN)
1.00
0.97
216.49
0.98
0.94
210.99
0.95
0.92
205.49
0.93
0.89
199.99
0.90
0.87
194.49
0.88
0.84
188.99
0.85
0.82
183.49
0.83
0.79
177.99
0.80
0.77
172.49
0.78
0.74
166.99
0.75
0.72
161.49
0.73
0.69
155.99
0.70
0.67
150.49
0.68
0.64
144.99
0.65
0.62
139.49
0.63
0.59
133.99
0.60
0.57
128.49
0.58
0.54
122.99
0.55
0.52
117.49
0.53
0.49
111.99
0.50
0.47
106.49
Load of
lane
(KN)
174.84
166.10
157.36
148.61
139.87
131.13
122.39
113.65
104.90
96.16
87.42
78.68
69.94
61.19
52.45
43.71
34.97
26.23
17.48
8.74
0.00
Designed two-axle vehicle
ΣPiyi
(KNm)
0.00
274.75
534.23
778.43
1,007.35
1,221.00
1,419.38
1,602.48
1,770.30
1,922.85
2,060.13
2,182.13
2,288.85
2,380.30
2,456.48
2,517.38
2,563.00
2,593.35
2,608.43
2,608.23
2,592.75
SHEAR FORCE DUE TO LIVE LOAD
Standard truck
145 KN
145 KN
35 KN
ΣPiyi
yi
yi
yi
(KN)
1.00
0.89
0.77
300.41
0.98
0.86
0.75
292.29
0.95
0.84
0.72
284.16
0.93
0.81
0.70
276.04
0.90
0.79
0.67
267.91
0.88
0.76
0.65
259.79
0.85
0.74
0.62
251.66
0.83
0.71
0.60
243.54
0.80
0.69
0.57
235.41
0.78
0.66
0.55
227.29
0.75
0.64
0.52
219.16
0.73
0.61
0.50
211.04
0.70
0.59
0.47
202.91
0.68
0.56
0.45
194.79
0.65
0.54
0.42
186.66
0.63
0.51
0.40
178.54
0.60
0.49
0.37
170.41
0.58
0.46
0.35
162.29
0.55
0.44
0.32
154.16
0.53
0.41
0.30
146.04
0.50
0.39
0.27
137.91
110 KN 110 KN
yi (m)
yi (m)
0.00
0.00
0.92
0.89
1.79
1.73
2.61
2.52
3.38
3.26
4.11
3.96
4.79
4.61
5.43
5.22
6.02
5.78
6.56
6.29
7.05
6.75
7.50
7.17
7.90
7.54
8.25
7.86
8.55
8.13
8.81
8.36
9.02
8.54
9.19
8.68
9.31
8.77
9.38
8.81
9.40
8.80
VLL+IM
(KN)
550.36
531.46
512.56
493.66
474.76
455.86
436.97
418.07
399.17
380.27
361.37
342.47
323.58
304.68
285.78
266.88
247.98
229.09
210.19
191.29
172.39
Live load of
pedestrian
(KN)
112.80
107.16
101.52
95.88
90.24
84.60
78.96
73.32
67.68
62.04
56.40
50.76
45.12
39.48
33.84
28.20
22.56
16.92
11.28
5.64
0.00
Notes:
Internal force due to live load is already multiplied with impact coefficient
(impact coefficient is only applied for truck, not be applied for load of lane and pedestrian)
III. INTERNAL FORCE IN THE MAIN BEAM
Load combination at the state of strength limit I (phase I)
η{ 1.25DC}
Load combination at the state of strength limit I (phase II)
η{ 1.25DC+1.5DW+1.2P+1.75PL + 1.75(LL+IM)}
Load combination at the state of using limit
η{ DC+DW+P+PL+(LL+IM)}
Page: 11
Loading
D:\Congtrinh 2010\Ha tang uu tien TP Da Nang\Comp C\NTP bridge\Calculations\Super-T beam (L=38.3m)EN.xls
Moment M(KN.m)
Section
(m)
0.00
0.94
1.88
2.82
3.76
4.70
5.64
6.58
7.52
8.46
9.40
10.34
11.28
12.22
13.16
14.10
15.04
15.98
16.92
17.86
18.80
Phase I
State of strength limit I
Exterior Intermediate
Mmax
beam
beam
(KNm)
(KNm)
(KNm)
0.00
0.00
0.00
420.41
420.41
420.41
819.26
819.26
819.26
1,196.55
1,196.55 1,196.55
1,552.28
1,552.28 1,552.28
1,886.45
1,886.45 1,886.45
2,199.06
2,199.06 2,199.06
2,490.11
2,490.11 2,490.11
2,759.60
2,759.60 2,759.60
3,007.53
3,007.53 3,007.53
3,233.91
3,233.91 3,233.91
3,438.72
3,438.72 3,438.72
3,621.98
3,621.98 3,621.98
3,783.67
3,783.67 3,783.67
3,923.81
3,923.81 3,923.81
4,042.38
4,042.38 4,042.38
4,139.40
4,139.40 4,139.40
4,214.86
4,214.86 4,214.86
4,268.76
4,268.76 4,268.76
4,301.10
4,301.10 4,301.10
4,311.88
4,311.88 4,311.88
Notes:
Phase II
State of strength limit I
State of using limit
Exterior Intermediate
Exterior Intermediate
MMax
MMax
beam
beam
beam
beam
(KNm)
(KNm)
(KNm)
(KNm)
(KNm)
(KNm)
0.00
0.00
0.00
0.00
0.00
0.00
1,536.34
1,377.37 1,536.34 1,009.06
928.28 1,009.06
2,992.44
2,682.62 2,992.44 1,965.59
1,808.14 1,965.59
4,368.31
3,915.74 4,368.31 2,869.58
2,639.59 2,869.58
5,663.95
5,076.73 5,663.95 3,721.04
3,422.62 3,721.04
6,879.35
6,165.60 6,879.35 4,519.96
4,157.23 4,519.96
8,014.52
7,182.33 8,014.52 5,266.35
4,843.43 5,266.35
9,069.45
8,126.94 9,069.45 5,960.20
5,481.21 5,960.20
10,044.15
8,999.43 10,044.15 6,601.52
6,070.57 6,601.52
10,938.61
9,799.78 10,938.61 7,190.30
6,611.52 7,190.30
11,752.84 10,528.01 11,752.84 7,726.55
7,104.05 7,726.55
12,486.83 11,184.11 12,486.83 8,210.27
7,548.17 8,210.27
13,140.59 11,768.09 13,140.59 8,641.45
7,943.87 8,641.45
13,714.11 12,279.93 13,714.11 9,020.09
8,291.15 9,020.09
14,207.40 12,719.65 14,207.40 9,346.20
8,590.01 9,346.20
14,620.46 13,087.24 14,620.46 9,619.78
8,840.46 9,619.78
14,953.28 13,382.71 14,953.28 9,840.82
9,042.50 9,840.82
15,205.87 13,606.05 15,205.87 10,009.32
9,196.11 10,009.32
15,378.22 13,757.26 15,378.22 10,125.29
9,301.31 10,125.29
15,470.34 13,836.34 15,470.34 10,188.73
9,358.10 10,188.73
15,482.22 13,843.30 15,482.22 10,199.63
9,366.47 10,199.63
Internal force due to live load is already multiplied with transversal distribution coefficient
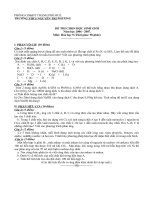
CHART BOUNDARY OF MOMENT
18,000
M(KNm)
15,000
12,000
9,000
6,000
3,000
0
0.00
2.50
5.00
7.50
10.00
12.50
15.00
17.50
20.00
DISTANCE FROM SUPPORT (m)
State of strength limit I(phase2)
State of service limit (phase2)
State of strength limit I(phase1)
Section
(m)
0.00
0.94
1.88
2.82
3.76
4.70
5.64
6.58
7.52
8.46
9.40
10.34
11.28
12.22
13.16
Shearing force V(KN)
Phase I
Phase II
State of strength limit I
State of strength limit I
State of using limit
Exterior Intermediate
Exterior Intermediate
Exterior Intermediate
VMax
VMax
VMax
beam
beam
beam
beam
beam
beam
(KN)
(KN)
(KN)
(KN)
(KN)
(KN)
(KN)
(KN)
(KN)
458.71
458.71
458.71 1,677.08
1,503.66 1,677.08 1,101.41
1,013.28 1,101.41
435.77
435.77
435.77 1,601.65
1,437.16 1,601.65 1,050.93
967.35 1,050.93
412.84
412.84
412.84 1,526.22
1,370.66 1,526.22 1,000.44
921.41 1,000.44
389.90
389.90
389.90 1,450.79
1,304.16 1,450.79
949.95
875.47
949.95
366.97
366.97
366.97 1,375.36
1,237.66 1,375.36
899.47
829.53
899.47
344.03
344.03
344.03 1,299.93
1,171.16 1,299.93
848.98
783.59
848.98
321.10
321.10
321.10 1,224.50
1,104.66 1,224.50
798.50
737.66
798.50
298.16
298.16
298.16 1,149.07
1,038.17 1,149.07
748.01
691.72
748.01
275.23
275.23
275.23 1,073.64
971.67 1,073.64
697.52
645.78
697.52
252.29
252.29
252.29
998.21
905.17
998.21
647.04
599.84
647.04
229.36
229.36
229.36
922.78
838.67
922.78
596.55
553.90
596.55
206.42
206.42
206.42
847.35
772.17
847.35
546.06
507.97
546.06
183.48
183.48
183.48
771.92
705.67
771.92
495.58
462.03
495.58
160.55
160.55
160.55
696.49
639.17
696.49
445.09
416.09
445.09
137.61
137.61
137.61
621.06
572.68
621.06
394.60
370.15
394.60
Page: 12
Loading
D:\Congtrinh 2010\Ha tang uu tien TP Da Nang\Comp C\NTP bridge\Calculations\Super-T beam (L=38.3m)EN.xls
14.10
15.04
15.98
16.92
17.86
18.80
114.68
91.74
68.81
45.87
22.94
0.00
114.68
91.74
68.81
45.87
22.94
0.00
114.68
91.74
68.81
45.87
22.94
0.00
545.63
470.20
394.76
319.33
243.90
168.47
506.18
439.68
373.18
306.68
240.18
173.68
545.63
470.20
394.76
319.33
243.90
173.68
344.12
293.63
243.15
192.66
142.17
91.69
324.21
278.27
232.34
186.40
140.46
94.52
344.12
293.63
243.15
192.66
142.17
94.52
CHART BOUNDARY OF SHEAR FORCE
1,800
V(KN)
1,500
1,200
900
600
300
0
0.00
2.50
5.00
7.50
10.00
12.50
15.00
17.50
20.00
DISTANCE FROM SUPPORT (m)
State of strength limit I(phase2)
State of strength limit I(phase1)
State of service limit (phase2)
IV. INTERNAL FORCE IN MAIN BEAM TAKE ACCOUNT OF EFFECT OF PRESTRESSING STRAND
Load combination at the state of strength limit I (phase I)
Mphase1= η{ 1.25DC+PS}
Load combination at the state of strength limit I (phase II)
Mphase2= η{ 1.25DC+1.5DW+1.2P+1.75PL + 1.75(LL+IM)+PS}
Load combination at the state of using limit
Mphase3= η{ DC+DW+P+PL+(LL+IM)+PS}
Mphase4= η{ 0.5(DC+DW+P+PS)+PL+(LL+IM)}
Moment M(KN.m)
Phase I
State of strength limit I
Mặt cắt
(m)
0.00
0.94
1.88
2.82
3.76
4.70
5.64
6.58
7.52
8.46
9.40
10.34
11.28
12.22
13.16
14.10
15.04
15.98
16.92
17.86
18.80
MMax
(KNm)
0.00
420.41
819.26
1,196.55
1,552.28
1,886.45
2,199.06
2,490.11
2,759.60
3,007.53
3,233.91
3,438.72
3,621.98
3,783.67
3,923.81
4,042.38
4,139.40
4,214.86
4,268.76
4,301.10
4,311.88
PS
(KNm)
110.61
-2,422.45
-2,426.94
-2,536.92
-3,589.60
-4,082.10
-4,091.74
-4,827.24
-4,837.25
-5,065.90
-5,074.70
-5,082.66
-5,089.79
-5,096.07
-5,101.52
-5,106.12
-5,109.89
-5,112.83
-5,114.92
-5,116.18
-5,116.59
Phase II
State of using limit
State of strength limit I
Mphase1
MMax
(KNm)
110.61
-2,002.04
-1,607.69
-1,340.37
-2,037.33
-2,195.66
-1,892.68
-2,337.14
-2,077.64
-2,058.37
-1,840.79
-1,643.94
-1,467.81
-1,312.40
-1,177.71
-1,063.74
-970.49
-897.97
-846.16
-815.08
-804.72
(KNm)
0.00
1,536.34
2,992.44
4,368.31
5,663.95
6,879.35
8,014.52
9,069.45
10,044.15
10,938.61
11,752.84
12,486.83
13,140.59
13,714.11
14,207.40
14,620.46
14,953.28
15,205.87
15,378.22
15,470.34
15,482.22
PS
Mphase2
Max 1
(KNm)
(KNm)
(KNm)
53.81
53.81
0.00
-2,741.23 -1,204.89 1,009.06
-2,764.66
227.78 1,965.59
-3,559.11
809.20 2,869.58
-4,753.23
910.72 3,721.04
-5,308.24 1,571.11 4,519.96
-5,369.18 2,645.33 5,266.35
-6,121.41 2,948.03 5,960.20
-6,183.92 3,860.22 6,601.52
-6,447.47 4,491.14 7,190.30
-6,502.45 5,250.38 7,726.55
-6,552.20 5,934.63 8,210.27
-6,596.71 6,543.88 8,641.45
-6,635.98 7,078.13 9,020.09
-6,670.02 7,537.38 9,346.20
-6,698.82 7,921.64 9,619.78
-6,722.38 8,230.90 9,840.82
-6,740.70 8,465.16 10,009.32
-6,753.79 8,624.43 10,125.29
-6,761.65 8,708.69 10,188.73
-6,764.27 8,717.95 10,199.63
Page: 13
Max 2
(KNm)
0.00
690.16
1,344.14
1,961.95
2,543.57
3,089.01
3,598.26
4,071.34
4,508.24
4,908.95
5,273.49
5,601.84
5,894.01
6,150.00
6,369.82
6,553.44
6,700.89
6,812.16
6,887.25
6,926.15
6,928.88
PS
Mphase3
(KNm)
51.25
-2,610.70
-2,633.01
-3,389.63
-4,526.88
-5,055.47
-5,113.51
-5,829.92
-5,889.45
-6,140.45
-6,192.81
-6,240.19
-6,282.58
-6,319.99
-6,352.40
-6,379.83
-6,402.27
-6,419.72
-6,432.18
-6,439.66
-6,442.16
(KNm)
51.25
-1,601.63
-667.42
-520.05
-805.85
-535.51
152.84
130.28
712.07
1,049.86
1,533.74
1,970.07
2,358.86
2,700.11
2,993.80
3,239.95
3,438.55
3,589.61
3,693.11
3,749.07
3,757.48
Mphase4
(KNm)
25.62
-615.18
27.64
267.13
280.12
561.27
1,041.51
1,156.38
1,563.51
1,838.73
2,177.08
2,481.74
2,752.72
2,990.01
3,193.62
3,363.53
3,499.76
3,602.30
3,671.16
3,706.32
3,707.80
Loading
D:\Congtrinh 2010\Ha tang uu tien TP Da Nang\Comp C\NTP bridge\Calculations\Super-T beam (L=38.3m)EN.xls
CHART BOUNDARY OF MOMENT
18,000
15,000
M(KNm)
12,000
9,000
6,000
3,000
0
0.00
-3,000
2.50
5.00
7.50
10.00
12.50
15.00
17.50
20.00
-6,000
DISTANCE FROM SUPPORT (m)
Mphase2 (PS)
Mphase1(PS)
State of strength limit I(phase1)
State of service limit (phase2)
Page: 14
Mphase3 (PS)
Mphase4 (PS)
State of strength limit I(phase2)
Loading
D:\Congtrinh 2010\Ha tang uu tien TP Da Nang\Comp C\NTP bridge\Calculations\Super-T beam (L=38.3m)EN.xls
DANANG PRIORITY INFRASTRUCTURE INVESTMENT PROJECT
NGUYỄN TRI PHƯƠNG BRIDGE
STRUCTURAL CALCULATION OF SUPER-T BEAM, L=38.3m
Calculated by
Phucdh
Checked by Dr. Songkiat
Dated
4/21/2010
STRESS LOSS
I. TOTAL OF STRESS LOSS
I.1 Total of stress loss created by:
ΔfpT = ΔfpES + ΔfpSR + ΔfpCR + ΔfpR
(A.5.9.5.1-2)
Where:
:
Total of stress loss (Mpa)
ΔfpT
ΔfpES
:
Stress loss due to elastic shortening (Mpa)
:
Stress loss due to shrinkage (Mpa)
ΔfpSR
:
Stress loss due to creep (Mpa)
ΔfpCR
ΔfpR
:
Stress loss due to relaxation of reinforcement (Mpa)
I.2 Stress loss due to elastic shortening
Stress loss due to elastic shortening in each tendon
(A.5.9.5.2.3)
ΔfpES = Epfcgp/Eci
Where:
Stress in concrete at the center of tendon when force tranfer applied
fcgp =
and sefl load of section with maximum moment (Mpa)
fcgp =
Ep =
Eci =
(P/Ag) + (Pi*e2/Ig) - (Mg*e/Ig)
197,000 (MPa)
Elasticity modulus of tendon
32,959 (MPa)
Elasticity modulus of concrete when force transfer applied
Section
Number of
tendon
Area of
tendon
2
(m)
(m )
ΔfpES
fcgp
P
(KN)
(Mpa)
(Mpa)
0.00
2.00
0.00028
391
0.94
5.60
0.94
18.00
0.00252
3,515
5.11
30.56
1.88
18.00
0.00252
3,515
4.67
27.91
2.82
3.76
22.00
30.00
0.00308
0.00420
4,297
5,859
9.59
13.79
57.33
82.41
4.70
34.00
0.00476
6,640
15.50
92.63
5.64
34.00
0.00476
6,640
14.96
89.41
6.58
7.52
40.00
40.00
0.00560
0.00560
7,812
7,812
17.91
17.45
107.07
104.28
8.46
42.00
0.00588
8,203
18.09
108.12
9.40
42.00
0.00588
8,203
17.70
105.78
10.34
42.00
0.00588
8,203
17.34
103.67
11.28
12.22
13.16
14.10
15.04
15.98
16.92
17.86
18.80
42.00
42.00
42.00
42.00
42.00
42.00
42.00
42.00
42.00
0.00588
0.00588
0.00588
0.00588
0.00588
0.00588
0.00588
0.00588
0.00588
8,203
8,203
8,203
8,203
8,203
8,203
8,203
8,203
8,203
17.03
16.75
16.51
16.30
16.13
16.00
15.91
15.85
15.84
101.78
100.11
98.66
97.43
96.43
95.65
95.10
94.76
94.65
I.3 Stress loss due to creep:
ΔfpCR = 12*fcgp - 7*Δfcdp
(A.5.9.5.4.3)
Where:
fcgp: Stress of concrete at the center of tendon when force tranfer applied (MPa)
Δfcdp: Change of concrete stress at the center of tendon due to permanent load of each section
deduct the applied load when carrying out the prestressing
Δfcdp = - M*e/Ig
Page: 15
Stress loss
D:\Congtrinh 2010\Ha tang uu tien TP Da Nang\Comp C\NTP bridge\Calculations\Super-T beam (L=38.3m)EN.xls
M=
(kN.m)
Moment due to formwork, bridge deck, hand rail and permanent
load at the designed sections
Ig =
e=
(m4)
inertia moment of cross-section
Distance from neutral axis to the center of tendon
(m)
Section
(m)
0.00
M
(KNm)
0.00
ΔfpCR
(Mpa)
0.00
(Mpa)
0.94
ΔfpCR
(Mpa)
11.24
0.94
323.00
0.53
5.11
57.67
1.88
2.82
3.76
629.44
919.32
1,192.63
1.03
2.17
2.76
4.67
9.59
13.79
48.84
99.93
146.14
4.70
1,449.37
3.32
15.50
162.71
5.64
1,689.55
3.87
14.96
152.40
6.58
1,913.17
4.32
17.91
184.70
7.52
2,120.22
4.79
17.45
175.82
8.46
9.40
10.34
11.28
2,310.71
2,484.64
2,642.00
2,782.79
5.20
5.59
5.95
6.26
18.09
17.70
17.34
17.03
180.67
173.24
166.51
160.50
12.22
2,907.02
6.54
16.75
155.19
13.16
3,014.69
6.78
16.51
150.59
14.10
3,105.79
6.99
16.30
146.69
15.04
15.98
17.86
3,180.33
3,238.31
3,304.57
7.16
7.29
7.44
16.13
16.00
15.85
143.51
141.03
138.20
18.80
3,312.85
7.46
15.84
137.84
I.4 Stress loss due to shrinkage of concrete:
ΔfpSR = (117-1.03*H)=
Where:
H: Surrounded relative humidity = 85 %
fcgp
29.45 (MPa)
(A.5.9.5.4.2)
I.5 Stress loss due to relaxation of reinforcement:
ΔfpR
= ΔfpR1 + ΔfpR2
Where:
+ ΔfpR1 : Loss due to self relaxation of reinforcement when force transfer applied (MPa)
+ ΔfpR2 : Loss due to self relaxation of reinforcement after force transfer (MPa)
I.5.1 Loss due to self relaxation of reinforcement at the time of force transfer Δ f pR1
For the strand with low relaxation :
ΔfpR1 = [log(24t)/40][fpj/fpy - 0,55]fpj
Where:
+ t : Time from apply of stress to transfer
+ fpj : Initial stress in tendon at the end of tension time
fpj = Pj/Aps - ΔfpES
+ fpy : Yield strength of tendon (MPa)
ΔfpR1
Section
fpj
fpy
t
(m)
(Mpa)
(Mpa)
(date)
0.00
0.94
1,389.40
1,364.44
1,674.00
1,674.00
7.00
7.00
21.64
20.12
1.88
1,367.09
1,674.00
7.00
20.28
2.82
1,337.67
1,674.00
7.00
18.54
3.76
1,312.59
1,674.00
7.00
17.10
4.70
1,302.37
1,674.00
7.00
16.52
5.64
1,305.59
1,674.00
7.00
16.70
Page: 16
(Mpa)
Stress loss
D:\Congtrinh 2010\Ha tang uu tien TP Da Nang\Comp C\NTP bridge\Calculations\Super-T beam (L=38.3m)EN.xls
6.58
7.52
8.46
9.40
10.34
11.28
12.22
13.16
14.10
15.04
15.98
16.92
17.86
18.80
1,287.93
1,290.72
1,286.88
1,289.22
1,291.33
1,293.22
1,294.89
1,296.34
1,297.57
1,298.57
1,299.35
1,299.90
1,300.24
1,300.35
1,674.00
1,674.00
1,674.00
1,674.00
1,674.00
1,674.00
1,674.00
1,674.00
1,674.00
1,674.00
1,674.00
1,674.00
1,674.00
1,674.00
7.00
7.00
7.00
7.00
7.00
7.00
7.00
7.00
7.00
7.00
7.00
7.00
7.00
7.00
15.72
15.87
15.66
15.79
15.91
16.01
16.10
16.18
16.25
16.31
16.35
16.38
16.40
16.41
I.5.2 Loss due to self relaxation of reinforcement after force transfer Δ f pR2
ΔfpR2 = 0.3{138 - 0.4ΔfpES - 0.2(ΔfpSR + ΔfpCR)}
(equation 1)
ΔfpES =
Loss due to elastic shortening after transfer
(MPa)
Loss due to shrinkage after transfer
(MPa)
ΔfpSR =
Loss due to creep after transfer
(MPa)
ΔfpCR =
Section
(m)
0.00
0.94
1.88
2.82
3.76
4.70
5.64
6.58
7.52
8.46
9.40
10.34
11.28
12.22
13.16
14.10
15.04
15.98
16.92
17.86
18.80
ΔfpES
(Mpa)
5.60
30.56
27.91
57.33
82.41
92.63
89.41
107.07
104.28
108.12
105.78
103.67
101.78
100.11
98.66
97.43
96.43
95.65
95.10
94.76
94.65
ΔfpSR
(Mpa)
29.45
29.45
29.45
29.45
29.45
29.45
29.45
29.45
29.45
29.45
29.45
29.45
29.45
29.45
29.45
29.45
29.45
29.45
29.45
29.45
29.45
ΔfpCR
(Mpa)
11.24
57.67
48.84
99.93
146.14
162.71
152.40
184.70
175.82
180.67
173.24
166.51
160.50
155.19
150.59
146.69
143.51
141.03
139.26
138.20
137.84
ΔfpR2
(Mpa)
38.29
32.51
33.35
26.76
20.98
18.75
19.76
15.70
16.57
15.82
16.54
17.20
17.79
18.31
18.76
19.14
19.45
19.69
19.87
19.97
20.00
I.7 Total of stress loss:
I.7.1 Total of stress loss at the time of force transfer
ΔfpT1 = ΔfpES + ΔfpR1
I.7.2 Total of stress loss after force transfer
ΔfpT2 = ΔfpES + ΔfpSR + ΔfpCR + ΔfpR1 + ΔfpR2
Section
(m)
0.00
0.94
1.88
2.82
3.76
Jacking
force
(KN)
391
3,515
3,515
4,297
5,859
ΔfpES
ΔfpCR
ΔfpSR
ΔfpR1
ΔfpR2
ΔfpT1
ΔfpT2
(Mpa)
5.60
30.56
27.91
57.33
82.41
(Mpa)
11.24
57.67
48.84
99.93
146.14
(Mpa)
29.45
29.45
29.45
29.45
29.45
(Mpa)
21.64
20.12
20.28
18.54
17.10
(Mpa)
38.29
32.51
33.35
26.76
20.98
(Mpa)
27.24
50.68
48.19
75.87
99.50
(Mpa)
106.22
170.30
159.83
232.00
296.07
Page: 17
PAll loss
Pafter all loss
(KN)
29.74
429.16
402.78
714.57
1,243.47
(KN)
360.86
3,086.24
3,112.62
3,582.03
4,615.53
Stress loss
D:\Congtrinh 2010\Ha tang uu tien TP Da Nang\Comp C\NTP bridge\Calculations\Super-T beam (L=38.3m)EN.xls
4.70
5.64
6.58
7.52
8.46
9.40
10.34
11.28
12.22
13.16
14.10
15.04
15.98
16.92
17.86
18.80
6,640
6,640
7,812
7,812
8,203
8,203
8,203
8,203
8,203
8,203
8,203
8,203
8,203
8,203
8,203
8,203
92.63
89.41
107.07
104.28
108.12
105.78
103.67
101.78
100.11
98.66
97.43
96.43
95.65
95.10
94.76
94.65
162.71
152.40
184.70
175.82
180.67
173.24
166.51
160.50
155.19
150.59
146.69
143.51
141.03
139.26
138.20
137.84
29.45
29.45
29.45
29.45
29.45
29.45
29.45
29.45
29.45
29.45
29.45
29.45
29.45
29.45
29.45
29.45
16.52
16.70
15.72
15.87
15.66
15.79
15.91
16.01
16.10
16.18
16.25
16.31
16.35
16.38
16.40
16.41
18.75
19.76
15.70
16.57
15.82
16.54
17.20
17.79
18.31
18.76
19.14
19.45
19.69
19.87
19.97
20.00
109.15
106.11
122.79
120.15
123.78
121.57
119.57
117.79
116.21
114.84
113.69
112.74
112.00
111.48
111.16
111.06
320.07
307.73
352.64
342.00
349.72
340.80
332.74
325.52
319.15
313.64
308.97
305.15
302.18
300.05
298.78
298.36
1,523.52
1,464.78
1,974.79
1,915.19
2,056.34
2,003.92
1,956.49
1,914.06
1,876.63
1,844.18
1,816.73
1,794.27
1,776.80
1,764.32
1,756.83
1,754.34
5,116.68
5,175.42
5,837.21
5,896.81
6,146.26
6,198.68
6,246.11
6,288.54
6,325.97
6,358.42
6,385.87
6,408.33
6,425.80
6,438.28
6,445.77
6,448.26
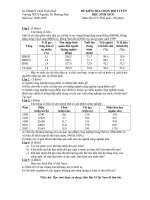
Prestress force before and after all losses
9,000.00
Prestress force (KN)
8,000.00
7,000.00
6,000.00
5,000.00
4,000.00
3,000.00
2,000.00
1,000.00
0.00
0.00
2.00
4.00
6.00
8.00
10.00
12.00
14.00
16.00
18.00
20.00
Distance from support (m)
P after all losses
Page: 18
P prestress
P all losses
Stress loss
D:\Congtrinh 2010\Ha tang uu tien TP Da Nang\Comp C\NTP bridge\Calculations\Super-T beam (L=38.3m)EN.xls
DANANG PRIORITY INFRASTRUCTURE INVESTMENT PROJECT
NGUYỄN TRI PHƯƠNG BRIDGE
STRUCTURAL CALCULATION OF SUPER-T BEAM, L=38.3m
CHECKING THE STRESS IN BEAM
I. STRESS AT THE TIME OF FORCE TRANSFER
We shall check the stress of top fiber and bottom fiber of beam
Stress at top fiber of beam when force transfer applied is to be calculated as follows:
ft1 = P working/Agirder - Pworking*estrand1*Yt1/Igirder + Mstg1*Yt1/Igirder
Stress at bottom fiber of beam when force transfer applied is to be calculated as follows:
fb1 = Pworking/Agirder + Pworking*estrand1*Yb1/Igirder - Mstg1*Yb1/Igirder
Ultimate tensile stress when force transfer applied = - 0.58f'ci0.5
Ultimate compressive stress when force transfer applied = 0.6f'ci
SECTION
(m)
0.00
0.94
1.88
2.82
3.76
4.70
5.64
6.58
7.52
8.46
9.40
10.34
11.28
12.22
13.16
14.10
15.04
15.98
16.92
17.86
18.80
Ptension
Pworking
(KN)
391
3,515
3,515
4,297
5,859
6,640
6,640
7,812
7,812
8,203
8,203
8,203
8,203
8,203
8,203
8,203
8,203
8,203
8,203
8,203
8,203
(KN)
383
3,388
3,394
4,063
5,441
6,121
6,135
7,124
7,139
7,475
7,488
7,500
7,510
7,519
7,527
7,534
7,540
7,544
7,547
7,549
7,550
Agirder
Igirder
(m2)
0.945
1.686
1.686
0.710
0.717
0.720
0.720
0.725
0.725
0.727
0.727
0.727
0.727
0.727
0.727
0.727
0.727
0.727
0.727
0.727
0.727
(m4)
0.057
0.466
0.466
0.276
0.279
0.281
0.281
0.284
0.284
0.285
0.285
0.285
0.285
0.285
0.285
0.285
0.285
0.285
0.285
0.285
0.285
(m)
-0.275
0.681
0.681
0.595
0.628
0.635
0.635
0.645
0.645
0.645
0.645
0.645
0.645
0.645
0.645
0.645
0.645
0.645
0.645
0.645
0.645
(-)
(+)
=
=
estrand 1
Mstg1
(KNm)
0.00
314.79
613.45
895.95
1,162.32
1,412.54
1,646.62
1,864.55
2,066.34
2,251.99
2,421.50
2,574.86
2,712.08
2,833.15
2,938.08
3,026.87
3,099.52
3,156.02
3,196.38
3,220.59
3,228.66
Calculated by
Phucdh
Checked by Dr. Songkiat
Dated
4/21/2010
Tensile stress
Compressive stress
-3.78 (MPa)
+25.50 (MPa)
Yt1
Yb1
(m)
0.350
0.763
0.763
0.878
0.885
0.888
0.888
0.893
0.893
0.895
0.895
0.895
0.895
0.895
0.895
0.895
0.895
0.895
0.895
0.895
0.895
(m)
0.450
0.987
0.987
0.872
0.865
0.862
0.862
0.857
0.857
0.855
0.855
0.855
0.855
0.855
0.855
0.855
0.855
0.855
0.855
0.855
0.855
ft1
fb1
(Mpa)
1.06
-1.25
-0.77
0.88
0.44
0.68
1.41
1.22
1.85
2.19
2.72
3.19
3.61
3.99
4.31
4.59
4.81
4.99
5.11
5.19
5.21
(Mpa)
-0.43
6.22
5.60
10.53
14.57
16.08
15.41
18.07
17.51
18.01
17.54
17.12
16.74
16.41
16.12
15.88
15.68
15.52
15.41
15.34
15.32
STRESS AT TRANSFER
30.00
27.00
24.00
STRESS (Mpa)
21.00
18.00
15.00
12.00
9.00
6.00
3.00
0.00
-3.000.00
2.00
4.00
6.00
8.00
10.00
12.00
14.00
16.00
18.00
20.00
-6.00
DISTANCE FROM SUPPORT (m)
Top fibre
Bottom fibre
Compresive stress limited
Tensile stress limited
II. STRESS WHEN CONCRETING BRIDGE DECK (deck without load applied)
Stress at top fiber of beam when concreting bridge deck is to be calculated as follows:
ft2 = ft1 + ΔPlosses1/Agirder - ΔPlosses1*estrand1*Yt1/Igirder + Mstg2*Yt1/Igirder
Stress at bottom fiber of beam when concreting bridge deck is to be calculated as follows:
fb2 = f b1 + ΔPlosses1/A girder + ΔPlosses1*estrand1*Yb1/Igirder - Mstg2*Yb1/Igirder
0.5
Ultimate tensile stress when force transfer applied = - 0.5f'ci
Page: 19
=
-3.54 (MPa)
Stress
D:\Congtrinh 2010\Ha tang uu tien TP Da Nang\Comp C\NTP bridge\Calculations\Super-T beam (L=38.3m)EN.xls
Ultimate compressive stress when force transfer applied = 0.45f'ci
SECTION ΔPlosses1
(m)
(KN)
0.00
-8
0.94
-128
1.88
-121
2.82
-234
3.76
-418
4.70
-520
5.64
-505
6.58
-688
7.52
-673
8.46
-728
9.40
-715
10.34
-703
11.28
-693
12.22
-683
13.16
-675
14.10
-668
15.04
-663
15.98
-659
16.92
-655
17.86
-654
18.80
-653
Agirder
(m2)
0.945
1.685
1.685
0.709
0.715
0.718
0.718
0.723
0.723
0.724
0.724
0.724
0.724
0.724
0.724
0.724
0.724
0.724
0.724
0.724
0.724
Igirder
(m4)
0.056
0.466
0.466
0.275
0.278
0.280
0.280
0.283
0.283
0.283
0.283
0.283
0.283
0.283
0.283
0.283
0.283
0.283
0.283
0.283
0.283
estrand1
(m)
-0.275
0.681
0.681
0.595
0.628
0.635
0.635
0.645
0.645
0.645
0.645
0.645
0.645
0.645
0.645
0.645
0.645
0.645
0.645
0.645
0.645
Mstg2
(KNm)
0.00
209.53
408.31
596.35
773.64
940.19
1,095.99
1,241.05
1,375.36
1,498.93
1,611.75
1,713.83
1,805.16
1,885.75
1,955.59
2,014.69
2,063.04
2,100.65
2,127.51
2,143.63
2,149.00
=
Yt1
(m)
0.350
0.763
0.763
0.878
0.885
0.888
0.888
0.893
0.893
0.895
0.895
0.895
0.895
0.895
0.895
0.895
0.895
0.895
0.895
0.895
0.895
+22.50 (MPa)
Yb1
(m)
0.450
0.987
0.987
0.872
0.865
0.862
0.862
0.857
0.857
0.855
0.855
0.855
0.855
0.855
0.855
0.855
0.855
0.855
0.855
0.855
0.855
ft2
(Mpa)
1.04
-0.84
-0.03
2.90
3.15
3.98
5.20
5.60
6.64
7.41
8.28
9.07
9.78
10.40
10.94
11.40
11.77
12.06
12.27
12.39
12.43
fb2
(Mpa)
-0.42
5.52
4.49
7.86
10.77
11.45
10.35
12.01
11.09
11.06
10.30
9.60
8.99
8.44
7.97
7.57
7.24
6.99
6.81
6.70
6.66
STRESS AT TOPPING
30.00
27.00
24.00
STRESS (Mpa)
21.00
18.00
15.00
12.00
9.00
6.00
3.00
0.00
-3.000.00
2.00
4.00
6.00
8.00
10.00
12.00
14.00
16.00
18.00
20.00
-6.00
DISTANCE FROM SUPPORT (m)
Top fibre
Bottom fibre
Compresive stress limited
Tensile stress limited
III. STRESS IN THE PERIOF OF SERVICE
III.1 Stress of beam due to live load +1/2 (Prestressing+Permanent load):
Stress at top fiber of beam in the period of operation is to be calculated by:
ft3 = P losses/Acomb - Plosses*estrand2*Yt2/Icomb + Mstg3*Yt2/Icomb
Stress at bottom fiber of beam in the period of operation is to be calculated by:
fb3 = P losses/Acomb + Plosses*estrand2*Yb2/Icomb - Mstg3*Yb2/I comb
0.5
Ultimate tensile stress when force transfer applied = - 0.5f'ci
Ultimate compressive stress when force transfer applied = 0.4f'c
SECTION
(m)
0.00
0.94
1.88
2.82
3.76
4.70
Plosses
(KN)
361
3,086
3,113
3,582
4,616
5,117
Acomb
2
(m )
1.341
2.081
2.081
1.106
1.112
1.115
Icomb
4
(m )
0.114
0.706
0.706
0.519
0.526
0.530
estrand2
Mstg3
(m)
(KNm)
-0.142
25.6
0.846
-615.2
0.846
27.6
0.946
267.1
0.981
280.1
0.988
561.3
Page: 20
=
=
Yt2
Yb2
(m)
0.417
0.799
0.799
0.726
0.733
0.735
(m)
0.583
1.151
1.151
1.224
1.217
1.215
-3.54 (MPa)
+20.00 (MPa)
ft3
(Mpa)
0.55
-2.17
-1.45
-1.13
-1.76
-1.65
fb3
(Mpa)
-0.12
6.74
5.74
10.60
13.97
14.89
Stress
D:\Congtrinh 2010\Ha tang uu tien TP Da Nang\Comp C\NTP bridge\Calculations\Super-T beam (L=38.3m)EN.xls
5.64
6.58
7.52
8.46
9.40
10.34
11.28
12.22
13.16
14.10
15.04
15.98
16.92
17.86
18.80
5,175
5,837
5,897
6,146
6,199
6,246
6,289
6,326
6,358
6,386
6,408
6,426
6,438
6,446
6,448
1.115
1.119
1.119
1.121
1.121
1.121
1.121
1.121
1.121
1.121
1.121
1.121
1.121
1.121
1.121
0.530
0.535
0.535
0.537
0.537
0.537
0.537
0.537
0.537
0.537
0.537
0.537
0.537
0.537
0.537
0.988
0.999
0.999
0.999
0.999
0.999
0.999
0.999
0.999
0.999
0.999
0.999
0.999
0.999
0.999
1,041.5
1,156.4
1,563.5
1,838.7
2,177.1
2,481.7
2,752.7
2,990.0
3,193.6
3,363.5
3,499.8
3,602.3
3,671.2
3,706.3
3,707.8
0.735
0.740
0.740
0.741
0.741
0.741
0.741
0.741
0.741
0.741
0.741
0.741
0.741
0.741
0.741
1.215
1.210
1.210
1.209
1.209
1.209
1.209
1.209
1.209
1.209
1.209
1.209
1.209
1.209
1.209
-1.01
-1.25
-0.71
-0.46
-0.01
0.38
0.74
1.05
1.31
1.53
1.71
1.84
1.93
1.98
1.98
13.97
15.78
15.04
15.16
14.57
14.03
13.55
13.14
12.78
12.48
12.25
12.07
11.96
11.90
11.91
STRESS AT SERVICE
30.00
27.00
24.00
21.00
STRESS (Mpa)
18.00
15.00
12.00
9.00
6.00
3.00
0.00
-3.000.00
2.00
4.00
6.00
8.00
10.00
12.00
14.00
16.00
18.00
20.00
-6.00
DISTANCE FROM SUPPORT (m)
Top fibre
Bottom fibre
Compresive stress limited
Tensile stress limited
III.2 Stress of beam due to live load + Prestressing + Permanent load :
Stress at top fiber of beam in the period of operation is to be calculated by:
ft4 = P losses/Acomb - Plosses*estrand2*Yt2/Icomb + Mstg4*Yt2/Icomb
Stress at bottom fiber of beam in the period of operation is to be calculated by:
fb4 = P losses/Acomb + Plosses*estrand2*Yb2/Icomb - Mstg4*Yb2/I comb
Ultimate tensile stress when force transfer applied = - 0.5f'ci0.5
Ultimate compressive stress when force transfer applied = 0.6f'c
SECTION
(m)
0.00
0.94
1.88
2.82
3.76
4.70
5.64
6.58
7.52
8.46
9.40
10.34
11.28
12.22
13.16
14.10
15.04
15.98
Plosses
(KN)
361
3,086
3,113
3,582
4,616
5,117
5,175
5,837
5,897
6,146
6,199
6,246
6,289
6,326
6,358
6,386
6,408
6,426
Acomb
2
(m )
1.341
2.081
2.081
1.106
1.112
1.115
1.115
1.119
1.119
1.121
1.121
1.121
1.121
1.121
1.121
1.121
1.121
1.121
Icomb
4
(m )
0.114
0.706
0.706
0.519
0.526
0.530
0.530
0.535
0.535
0.537
0.537
0.537
0.537
0.537
0.537
0.537
0.537
0.537
estrand2
Mstg3
(m)
(KNm)
-0.142
51.2
0.846 -1,601.6
0.846
-667.4
0.946
-520.0
0.981
-805.8
0.988
-535.5
0.988
152.8
0.999
130.3
0.999
712.1
0.999 1,049.9
0.999 1,533.7
0.999 1,970.1
0.999 2,358.9
0.999 2,700.1
0.999 2,993.8
0.999 3,240.0
0.999 3,438.6
0.999 3,589.6
Page: 21
=
=
Yt2
Yb2
(m)
0.417
0.799
0.799
0.726
0.733
0.735
0.735
0.740
0.740
0.741
0.741
0.741
0.741
0.741
0.741
0.741
0.741
0.741
(m)
0.583
1.151
1.151
1.224
1.217
1.215
1.215
1.210
1.210
1.209
1.209
1.209
1.209
1.209
1.209
1.209
1.209
1.209
-3.54 (MPa)
+30.00 (MPa)
ft3
(Mpa)
0.64
-3.28
-2.24
-2.23
-3.27
-3.17
-2.24
-2.66
-1.89
-1.54
-0.90
-0.32
0.19
0.65
1.04
1.36
1.63
1.83
fb3
(Mpa)
-0.25
8.35
6.88
12.46
16.49
17.40
16.01
18.10
16.97
16.94
16.01
15.18
14.44
13.79
13.23
12.76
12.39
12.10
Stress
D:\Congtrinh 2010\Ha tang uu tien TP Da Nang\Comp C\NTP bridge\Calculations\Super-T beam (L=38.3m)EN.xls
16.92
17.86
18.80
6,438
6,446
6,448
1.121
1.121
1.121
0.537
0.537
0.537
0.999
0.999
0.999
3,693.1
3,749.1
3,757.5
0.741
0.741
0.741
1.209
1.209
1.209
1.96
2.04
2.05
11.91
11.81
11.79
STRESS AT SERVICE
35.00
30.00
STRESS (Mpa)
25.00
20.00
15.00
10.00
5.00
0.00
0.00
-5.00
2.00
4.00
6.00
8.00
10.00
12.00
14.00
16.00
18.00
20.00
DISTANCE FROM SUPPORT (m)
Top fibre
Bottom fibre
Page: 22
Compresive stress limited
Tensile stress limited
Stress
D:\Congtrinh 2010\Ha tang uu tien TP Da Nang\Comp C\NTP bridge\Calculations\Super-T beam (L=38.3m)EN.xls
DANANG PRIORITY INFRASTRUCTURE INVESTMENT PROJECT
NGUYỄN TRI PHƯƠNG BRIDGE
STRUCTURAL CALCULATION OF SUPER-T BEAM, L=38.3m
Calculated by
Phucdh
Checked by
Dr. Songkiat
Dated
4/21/2010
CHECKING THE STATE OF STRENGTH LIMIT IN BEAM
I. CHECKING THE REINFORCEMENT LIMITS
I.1 Maximum reiforcement limit
Percentage of reinforcement shall be limited so that:
Where:
(A.5.7.3.3.1-1)
c
≤ 0,42
de
+ c : Height of compression region
A ps f pu − 0,85 β 1 f' c (b − b w )h f
f pu
0,85 β 1 f' c b w + kA ps .
dp
c=
(A.5.7.3.1-1)
+ de : Distance from extreme compression fiber to the center of tension reinforcement
de =
A ps .f ps .d p + A s .f y .d s
A ps .f ps + A s .f y
+ β 1 : Stressing cubic coefficient
f ' −28
β1 = 0,85 − c
.0,05 ≥ 0,65
7
+ b : Width of compressive flange
+ bw : Width of web
+ hf : Height of compressive flange
+ fps : average stress in prestressing tendon
f ps = f p u .(1 − k
c
)
dp
+ dp (ds): Distance from extreme compression fiber to the center of tendon (plain tensile iron)
+ k : Coefficient depend on nature of reinforcement
k = 2.(1,04
SECTION
(m)
0.00
0.94
1.88
2.82
3.76
4.70
5.64
6.58
7.52
8.46
9.40
10.34
11.28
12.22
13.16
14.10
15.04
15.98
16.92
17.86
18.80
−
f py
f pu
bw
(mm)
890
700
700
240
240
240
240
240
240
240
240
240
240
240
240
240
240
240
240
240
240
β1
0.69
0.69
0.69
0.69
0.69
0.69
0.69
0.69
0.69
0.69
0.69
0.69
0.69
0.69
0.69
0.69
0.69
0.69
0.69
0.69
0.69
)
k
0.280
0.280
0.280
0.280
0.280
0.280
0.280
0.280
0.280
0.280
0.280
0.280
0.280
0.280
0.280
0.280
0.280
0.280
0.280
0.280
0.280
Position
neutral axis
Cantilever
Cantilever
Cantilever
Cantilever
Cantilever
Cantilever
Cantilever
Cantilever
Cantilever
Cantilever
Cantilever
Cantilever
Cantilever
Cantilever
Cantilever
Cantilever
Cantilever
Cantilever
Cantilever
Cantilever
Cantilever
c
(mm)
9
80
80
98
134
152
152
178
178
187
187
187
187
187
187
187
187
187
187
187
187
de
(mm)
275
1,644
1,644
1,673
1,713
1,724
1,724
1,739
1,739
1,740
1,740
1,740
1,740
1,740
1,740
1,740
1,740
1,740
1,740
1,740
1,740
c/de
Conclusion
0.03
0.05
0.05
0.06
0.08
0.09
0.09
0.10
0.10
0.11
0.11
0.11
0.11
0.11
0.11
0.11
0.11
0.11
0.11
0.11
0.11
OK
OK
OK
OK
OK
OK
OK
OK
OK
OK
OK
OK
OK
OK
OK
OK
OK
OK
OK
OK
OK
1.2. Minimum reinforcement limit
(5.7.3.3.2)
Volume of prestressing tendon and plain reiforcement shall be sufficient to develop bending resistance Mr, take less-than value of :
M r ≥ min(1,2M cr ;1,33M tt )
* 1,2 crack resistance M cr to be defined on the basis of elastic stress distribution and tensile strength when bending of concrete
f
r
M
= 0,63
cr
= f
r
f' c
I comb
Zt
(5.4.2.6)
(5.7.3.6.2)
Page: 23
Strength
D:\Congtrinh 2010\Ha tang uu tien TP Da Nang\Comp C\NTP bridge\Calculations\Super-T beam (L=38.3m)EN.xls
* 1,33 time of required design moment under combination of appropriate intensity of load, in the table 3.4.1-1
SECTION
(m)
0.00
0.94
1.88
2.82
3.76
4.70
5.64
6.58
7.52
8.46
9.40
10.34
11.28
12.22
13.16
14.10
15.04
15.98
16.92
17.86
18.80
fr
Icomb
(Mpa)
4.45
4.45
4.45
4.45
4.45
4.45
4.45
4.45
4.45
4.45
4.45
4.45
4.45
4.45
4.45
4.45
4.45
4.45
4.45
4.45
4.45
(m4)
0.114
0.706
0.706
0.519
0.526
0.530
0.530
0.535
0.535
0.537
0.537
0.537
0.537
0.537
0.537
0.537
0.537
0.537
0.537
0.537
0.537
1.2Mcr
(KNm)
1,467
4,726
4,726
3,819
3,841
3,852
3,852
3,868
3,868
3,872
3,872
3,872
3,872
3,872
3,872
3,872
3,872
3,872
3,872
3,872
3,872
1.33Mtt
(KNm)
0.0
2,043.3
3,979.9
5,809.9
7,533.1
9,149.5
10,659.3
12,062.4
13,358.7
14,548.3
15,631.3
16,607.5
17,477.0
18,239.8
18,895.8
19,445.2
19,887.9
20,223.8
20,453.0
20,575.5
20,591.4
Mr
Conclusion
(KNm)
140
OK
7,474
OK
7,474
OK
9,234
OK
12,738
OK
14,430
OK
14,430
OK
16,965
OK
16,965
OK
17,773
OK
17,773
OK
17,773
OK
17,773
OK
17,773
OK
17,773
OK
17,773
OK
17,773
OK
17,773
OK
17,773
OK
17,773
OK
17,773
OK
II. CHECK MOMENT RESISTANCE
The factored moment resistance Mr , shall be taken as:
Mr = ϕ Mn ≥ Mu (KN)
Where:
ϕ=
1.00 : Resistance factored as specified in Article 5.5.4.2
M n = A ps .f ps .(dp −
+ Mu
+ Mr
+ Mn
+ dp
+ fps
+ a = c.β 1
SECTION
(m)
0.00
0.94
1.88
2.82
3.76
4.70
5.64
6.58
7.52
8.46
9.40
10.34
11.28
12.22
13.16
14.10
15.04
15.98
16.92
17.86
18.80
a
a h
) + 0,85.fc' .(b − b w ).β 1 .h f .( − f )
2
2
2
(A.5.7.3.2.1-1)
(A.5.7.3.2.2-1)
: Flexural moment in beam due to applied load
: Factored flexural moment of beam
: Nominal flexural resistance moment of beam
: Distance from extreme compression fiber to the center of tendon
: Avarage stress in tendon ≤ fpy
: Thickness of equivalent stress block
a
(mm)
6.18
55.62
55.62
67.98
92.70
105.06
105.06
123.60
123.60
129.78
129.78
129.78
129.78
129.78
129.78
129.78
129.78
129.78
129.78
129.78
129.78
fps
(Mpa)
1843
1835
1835
1829
1819
1814
1814
1807
1807
1804
1804
1804
1804
1804
1804
1804
1804
1804
1804
1804
1804
Mn
(KNm)
140
7,474
7,474
9,234
12,738
14,430
14,430
16,965
16,965
17,773
17,773
17,773
17,773
17,773
17,773
17,773
17,773
17,773
17,773
17,773
17,773
Mu
(KNm)
0.0
1,536.3
2,992.4
4,368.3
5,663.9
6,879.3
8,014.5
9,069.4
10,044.1
10,938.6
11,752.8
12,486.8
13,140.6
13,714.1
14,207.4
14,620.5
14,953.3
15,205.9
15,378.2
15,470.3
15,482.2
Mr
Conclusion
(KNm)
140
OK
7,474
OK
7,474
OK
9,234
OK
12,738
OK
14,430
OK
14,430
OK
16,965
OK
16,965
OK
17,773
OK
17,773
OK
17,773
OK
17,773
OK
17,773
OK
17,773
OK
17,773
OK
17,773
OK
17,773
OK
17,773
OK
17,773
OK
17,773
OK
III. CHECK SHEAR RESISTANCE
III.1 Nominal shear resistance
Nominal shear resistance V n shall take less-than value of :
(A.5.8.3.3)
Vn = Vc + Vs + Vp
Vn = 0,25f'cbvdv + Vp
Page: 24
Strength
D:\Congtrinh 2010\Ha tang uu tien TP Da Nang\Comp C\NTP bridge\Calculations\Super-T beam (L=38.3m)EN.xls
Where:
Vc = 0,083β f c' b vd v
Vs =
Av f y d v (cot gθ + cot gα)sin α
s
+ bv : Width of minimum web of beam (mm)
dv = max(0,9d e ; 0,72h)
+ dv : Effective shear height (mm),
+ s : Distance of hoop reinforcement (mm)
+ β : Capability coefficient of crossed crack concrete
+ θ : Inclination angle of crossed compressive stress (Độ)
+ α : Inclination angle of cross reinforcement on longitudinal center line (degree)
+ Av : Area of shear reinforcement in distance of s (include area of plain reiforcement + prestressing reiforcement) (mm 2)
A vmin = 0,083 f' c
b vs
fy
+ Vp : Component of effective prestress towards active shearing force,
is positive (+) if in opposing direction of shearing force
0.0 KN
+ Vp = Σfps.Aps.sinαi =
+ αi : Inclination angle of strand compared with horizontal direction
Proposed arrangement of hoop reinforcement ia as follows:
fy
Av
SECTION
S
d
(Mpa)
(m)
(mm)
(mm)
(mm2)
Avmin
0.00
0.94
1.88
2.82
20.00
20.00
20.00
20.00
100
100
100
100
400
400
400
400
628
628
628
628
(mm2)
131
103
103
35
3.76
4.70
5.64
6.58
7.52
8.46
9.40
10.34
11.28
12.22
13.16
14.10
15.04
15.98
16.92
17.86
18.80
20.00
16.00
16.00
16.00
16.00
16.00
16.00
16.00
16.00
16.00
16.00
16.00
16.00
16.00
16.00
16.00
16.00
100
150
150
150
150
150
150
150
150
150
150
150
150
150
150
150
150
400
400
400
400
400
400
400
400
400
400
400
400
400
400
400
400
400
628
402
402
402
402
402
402
402
402
402
402
402
402
402
402
402
402
35
53
53
53
53
53
53
53
53
53
53
53
53
53
53
53
53
Conclusion
OK
OK
OK
OK
OK
OK
OK
OK
OK
OK
OK
OK
OK
OK
OK
OK
OK
OK
OK
OK
OK
` III.2 Determination of β and θ
β and θ taken from the table 5.8.3.4.2-1 depend on the ratio v/f' c and improvise in reinforcement of flexure side
Shear stress in concrete v :
Vu − ϕV p
v=
Improvise in tension reiforcement εx:
εx
ϕbv d v
Mu
+ 0 . 5 N u + 0 . 5V u cot g θ − A ps f po
dv
≤ 0 . 002
=
E s A s + E p A ps
If value of εx is minus so we take absolute value and reduce by multiply with coefficient F ε
Fε =
Where:
E ps A ps
E c A c + E ps A ps
+ f'c : Compressive strength of concrete
f'c =
50
MPa
+ Ec : Elasticity of concrete
Ec =
35750 MPa
Ep =
197000 MPa
+ Es : Elasticity modulus of tendon
+ ϕ : Shear resistance coefficient
ϕ=
0.9
+ fpo : Stress in tendon when stress in concrete around it is zero
fpo = fpe + fpc.Ep/Ec
+ fpe : Effective stress in tendon after deduct the loss
+ fpc : Compressive stress at section's center
fpc = F/A
Page: 25
Strength