- Trang chủ >>
- THPT Quốc Gia >>
- Hóa
Glencoe chemistry CBL lab manual 0078245303
Bạn đang xem bản rút gọn của tài liệu. Xem và tải ngay bản đầy đủ của tài liệu tại đây (1.46 MB, 49 trang )
CBL Laboratory Manual
Student Edition
A Glencoe Program
Hands-On Learning:
Laboratory Manual, SE/TE
Forensics Laboratory Manual, SE/TE
CBL Laboratory Manual, SE/TE
Small-Scale Laboratory Manual, SE/TE
ChemLab and MiniLab Worksheets
Review/Reinforcement:
Study Guide for Content Mastery, SE/TE
Solving Problems: A Chemistry Handbook
Reviewing Chemistry
Guided Reading Audio Program
Applications and Enrichment:
Challenge Problems
Supplemental Problems
Teacher Resources:
Lesson Plans
Block Scheduling Lesson Plans
Spanish Resources
Section Focus Transparencies and Masters
Math Skills Transparencies and Masters
Teaching Transparencies and Masters
Solutions Manual
Technology:
Chemistry Interactive CD-ROM
Vocabulary PuzzleMaker Software,
Windows/MacIntosh
Glencoe Science Web site:
science.glencoe.com
Assessment:
Chapter Assessment
MindJogger Videoquizzes (VHS/DVD)
Computer Test Bank, Windows/MacIntosh
Copyright © by The McGraw-Hill Companies, Inc.
All rights reserved. Permission is granted to reproduce the material contained herein
on the condition that such material be reproduced only for classroom use; be provided
to students, teachers, and families without charge; and be used solely in conjunction
with the Chemistry: Matter and Change program. Any other reproduction, for use or
sale, is prohibited without prior written permission of the publisher.
Send all inquiries to:
Glencoe/McGraw-Hill
8787 Orion Place
Columbus, OH 43240-4027
ISBN 0-07-824530-3
Printed in the United States of America.
1 2 3 4 5 6 7 8 9 10 045 09 08 07 06 05 04 03 02 01
CBL LABORATORY MANUAL
Contents
To the Student . . . . . . . . . . . . . . . . . . . . . . . . . . . . . . . . . . . . . . . . . iv
Organization of Activities . . . . . . . . . . . . . . . . . . . . . . . . . . . . . . . . iv
Sending Data to Graphical Analysis . . . . . . . . . . . . . . . . . . . . . . . . . v
CBL Equipment . . . . . . . . . . . . . . . . . . . . . . . . . . . . . . . . . . . . . . . . v
Safety in the Laboratory . . . . . . . . . . . . . . . . . . . . . . . . . . . . . . . . . vi
Safety Symbols . . . . . . . . . . . . . . . . . . . . . . . . . . . . . . . . . . . . . . . vii
Copyright © Glencoe/McGraw-Hill, a division of the McGraw-Hill Companies, Inc.
Laboratory Activities
1
Quantitative and Qualitative Observations . . . . . . . . . . . . . . . . . 1
2
Conductivity . . . . . . . . . . . . . . . . . . . . . . . . . . . . . . . . . . . . . . . 5
3
Melting and Freezing Points . . . . . . . . . . . . . . . . . . . . . . . . . . . 9
4
Boyle’s Law . . . . . . . . . . . . . . . . . . . . . . . . . . . . . . . . . . . . . . 13
5
Gay-Lussac’s Law . . . . . . . . . . . . . . . . . . . . . . . . . . . . . . . . . . 17
6
Determining Molar Mass Using Freezing Point Depression . . . 21
7
Calorimetry . . . . . . . . . . . . . . . . . . . . . . . . . . . . . . . . . . . . . . . 25
8
Hess’s Law . . . . . . . . . . . . . . . . . . . . . . . . . . . . . . . . . . . . . . . 29
9
Determine the Molar Mass of an Unknown Acid . . . . . . . . . . . 33
10 Reaction Potentials of Metals . . . . . . . . . . . . . . . . . . . . . . . . . 37
CBL Laboratory Manual
Chemistry: Matter and Change
iii
To the Student
Chemistry is the science of matter, its properties, and changes. In your classroom
work in chemistry, you will learn a great deal about the information that has been
gathered by scientists about matter. But, chemistry is not just information. It is
also a process for finding out more about matter and its changes. Laboratory
activities are the primary means that chemists use to learn more about matter.
The activities in the CBL Laboratory Manual require that you form and test
hypotheses, measure and record data and observations, analyze those data, and
draw conclusions based on those data and your knowledge of chemistry. These
processes are the same as those used by professional chemists and all other
scientists.
CBL (computer-based laboratory) activities use graphing calculators to collect
and analyze real-world data using different probes or sensors. The CBL system is
an interface that collects data from the probes and sends the information to the
calculator. The calculator, in turn, runs stored data collection and processing
programs, which interpret and plot data obtained from the CBL system.
• Introduction Following the title and number of each activity, an introduction
provides a background discussion about the problem you will study in the activity.
• Problem The problem to be studied in this activity is clearly stated.
• Objectives The objectives are statements of what you should accomplish by doing
the investigation. Recheck this list when you have finished the activity.
• Materials The materials list shows the apparatus you need to have on hand for the
activity.
• Safety Precautions Safety symbols and statements warn you of potential hazards
in the laboratory. Before beginning any activity, refer to page vii to see what these
symbols mean.
• Pre-Lab The questions in this section check your knowledge of important
concepts needed to complete the activity successfully.
• Procedure The numbered steps of the procedure tell you how to carry out the
activity and sometimes offer hints to help you be successful in the laboratory.
Some activities have CAUTION statements in the procedure to alert you to
hazardous substances or techniques.
• Hypothesis This section provides an opportunity for you to write down a hypothesis for this activity.
• Data and Observations This section presents a suggested table or form for
collecting your laboratory data. Always record data and observations in an organized way as you do the activity.
• Analyze and Conclude The Analyze and Conclude section shows you how to
perform the calculations necessary for you to analyze your data and reach conclusions. It provides questions to aid you in interpreting data and observations in
order to reach an experimental result. You are also asked to form a scientific
conclusion based on what you actually observed, not what “should have
happened.” An opportunity to analyze possible errors in the activity is also given.
• Real-World Chemistry The questions in this section ask you to apply what you
have learned in the activity to other real-life situations. You may be asked to make
additional conclusions or research a question related to the activity.
iv
Chemistry: Matter and Change
CBL Laboratory Manual
Copyright © Glencoe/McGraw-Hill, a division of the McGraw-Hill Companies, Inc.
Organization of Activities
CBL LABORATORY MANUAL
Sending Data to Graphical Analysis
If using the TI-83 graphing calculator:
1. On the TI calculator, press 2nd Link, then select 4:List… from the SEND menu.
2. Use the down arrow to locate the lists on the SELECT menu. Position the arrow in front
of a list you want to send to GRAPHICAL ANALYSIS and press ENTER to select that
particular list. More than one list may be selected in this manner. A filled box will appear
beside each list that will be sent. To deselect, press ENTER. The filled-in box will
disappear.
3. Press the right arrow on the calculator, then select 1:TRANSMIT. The lists will appear in
columns in the data table window of GRAPHICAL ANALYSIS. They will be labeled with
simple list names from the calculator. If you want to rename the lists or add units, doubleclick on the column heading and enter a new name or label in the dialog box.
If using another type of TI graphing calculator with a PC computer:
1. Connect the TI-graph link cable to a free serial port of the Windows computer and to the
port on the bottom edge of the TI calculator.
2. With GRAPHICAL ANALYSIS running, choose Import from the TI Calculator under the
FILE MENU. If the TI-graph link cable is not connected to the serial port designated in
the status box, click on SELECT PORT and choose the correct port for the TI-graph link
cable.
Copyright © Glencoe/McGraw-Hill, a division of the McGraw-Hill Companies, Inc.
CBL Equipment
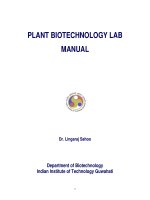
This diagram shows the basic equipment used in most of these CBL activities. Such
equipment includes the CBL unit, a graphing calculator, link cable, AC adapter for the
CBL unit, DIN adapter (needed for some probes), and a probe or sensor.
DIN adapter
TI-83 calculator
CBL
unit
Gas pressure
sensor
Syringe
AC adapter
Link cable
CBL Laboratory Manual
Chemistry: Matter and Change
v
CBL LABORATORY MANUAL
Safety in the Laboratory
The chemistry laboratory is a place to experiment and learn. You must assume responsibility
for your own personal safety and that of people working near you. Accidents are usually
caused by carelessness, but you can help prevent them by closely following the instructions
printed in this manual and those given to you by your teacher. The following are some safety
rules to help guide you in protecting yourself and others from injury in a laboratory.
2. Study your lab activity before you come to the lab.
If you are in doubt about any procedures, ask your
teacher for help.
3. Safety goggles and a laboratory apron must be
worn whenever you work in the lab. Gloves should
be worn whenever you use chemicals that cause
irritations or can be absorbed through the skin.
4. Contact lenses should not be worn in the lab, even
if goggles are worn. Lenses can absorb vapors and
are difficult to remove in an emergency.
5. Long hair should be tied back to reduce the
possibility of it catching fire.
6. Avoid wearing dangling jewelry or loose, draping
clothing. The loose clothing may catch fire and
either the clothing or jewelry could catch on
chemical apparatus.
7. Wear shoes that cover the feet at all times. Bare
feet or sandals are not permitted in the lab.
8. Know the location of the fire extinguisher, safety
shower, eyewash, fire blanket, and first-aid kit.
Know how to use the safety equipment provided
for you.
9. Report any accident, injury, incorrect procedure, or
damaged equipment immediately to your teacher.
10. Handle chemicals carefully. Check the labels of
all bottles before removing the contents. Read
the labels three times: before you pick up the
container, when the container is in your hand,
and when you put the bottle back.
11. Do not return unused chemicals to reagent bottles.
12. Do not take reagent bottles to your work area
unless specifically instructed to do so. Use test
tubes, paper, or beakers to obtain your chemicals.
vi
Chemistry: Matter and Change
Take only small amounts. It is easier to get more
than to dispose of excess.
13. Do not insert droppers into reagent bottles. Pour a
small amount of the chemical into a beaker.
14. Never taste any chemical substance. Never draw
any chemicals into a pipette with your mouth.
Eating, drinking, chewing gum, and smoking are
prohibited in the laboratory.
15. If chemicals come into contact with your eyes or
skin, flush the area immediately with large quantities of water. Immediately inform your teacher of
the nature of the spill.
16. Keep combustible materials away from open
flames. (Alcohol and acetone are combustible.)
17. Handle toxic and combustible gases only under the
direction of your teacher. Use the fume hood when
such materials are present.
18. When heating a substance in a test tube, be careful
not to point the mouth of the tube at another
person or yourself. Never look down the mouth
of a test tube.
19. Use caution and the proper equipment when
handling hot apparatus or glassware. Hot glass
looks the same as cool glass.
20. Dispose of broken glass, unused chemicals, and
products of reactions only as directed by your
teacher.
21. Know the correct procedure for preparing acid
solutions. Always add the acid slowly to the water.
22. Keep the balance area clean. Never weigh
chemicals directly on the pan of the balance.
23. Do not heat graduated cylinders, burettes, or
pipettes with a laboratory burner.
24. After completing an activity, clean and put away
your equipment. Clean your work area. Make sure
the gas and water are turned off. Wash your hands
with soap and water before you leave the lab.
CBL Laboratory Manual
Copyright © Glencoe/McGraw-Hill, a division of the McGraw-Hill Companies, Inc.
1. The chemistry laboratory is a place for serious
work. Do not perform activities without your
teacher’s permission. Never work alone in the laboratory. Work only when your teacher is present.
CBL LABORATORY MANUAL
The Chemistry: Matter and Change program uses safety symbols to alert you and your students to possible
laboratory dangers. These symbols are provided in the student text in Appendix B and are explained below.
Be sure your students understand each symbol before they begin an activity that displays a symbol.
SAFETY SYMBOLS
EXAMPLES
PRECAUTION
REMEDY
Special disposal procedures need to be
followed.
certain chemicals,
living organisms
Do not dispose of
Dispose of wastes as
these materials in
directed by your
the sink or trash can. teacher.
Organisms or other
biological materials
that might be
harmful to humans
bacteria, fungi,
blood, unpreserved
tissues, plant
materials
Avoid skin contact
Notify your teacher if
with these materials. you suspect contact
Wear mask or gloves. with material. Wash
hands thoroughly.
EXTREME
TEMPERATURE
Objects that can
burn skin by being
too cold or too hot
boiling liquids, hot
Use proper
plates, dry ice, liquid protection when
nitrogen
handling.
SHARP
OBJECT
Use of tools or
glassware that can
easily puncture or
slice skin
razor blades, pins,
scalpels, pointed
tools, dissecting
probes, broken glass
Practice commonGo to your teacher
sense behavior and
for first aid.
follow guidelines for
use of the tool.
Possible danger to
respiratory tract
from fumes
ammonia, acetone,
nail polish remover,
heated sulfur, moth
balls
Make sure there is
Leave foul area and
good ventilation.
notify your teacher
Never smell fumes
immediately.
directly. Wear a mask.
DISPOSAL
BIOLOGICAL
FUME
ELECTRICAL
IRRITANT
Copyright © Glencoe/McGraw-Hill, a division of the McGraw-Hill Companies, Inc.
HAZARD
CHEMICAL
TOXIC
OPEN
FLAME
Eye Safety
Proper eye
protection should be
worn at all times by
anyone performing
or observing science
activities.
CBL Laboratory Manual
Go to your teacher
for first aid.
Possible danger from improper grounding,
electrical shock or
liquid spills, short
burn
circuits, exposed
wires
Double-check setup
with teacher. Check
condition of wires
and apparatus.
Substances that can
irritate the skin or
mucus membranes of
the respiratory tract
pollen, moth balls,
steel wool, fiber
glass, potassium
permanganate
Wear dust mask and Go to your teacher
gloves. Practice extra for first aid.
care when handling
these materials.
Chemicals that can
react with and
destroy tissue and
other materials
bleaches such as
hydrogen peroxide;
acids such as sulfuric
acid, hydrochloric
acid; bases such as
ammonia, sodium
hydroxide
Wear goggles,
gloves, and an
apron.
Substance may be
poisonous if
touched, inhaled, or
swallowed
mercury, many metal Follow your teacher’s
compounds, iodine, instructions.
poinsettia plant
parts
Always wash hands
thoroughly after use.
Go to your teacher
for first aid.
Open flame may
ignite flammable
chemicals, loose
clothing, or hair
alcohol, kerosene,
potassium
permanganate, hair,
clothing
Tie back hair. Avoid
wearing loose clothing.
Avoid open flames
when using flammable
chemicals. Be aware of
locations of fire safety
equipment.
Notify your teacher
immediately. Use fire
safety equipment if
applicable.
Clothing
Protection
This symbol
appears when
substances could
stain or burn
clothing.
Animal Safety
This symbol
appears when
safety of animals
and students must
be ensured.
Do not attempt to fix
electrical problems.
Notify your teacher
immediately.
Immediately flush
the affected area
with water and
notify your teacher.
Radioactivity
This symbol
appears when
radioactive
materials are used.
Chemistry: Matter and Change
vii
Name
LAB
Date
1
Class
CBL LABORATORY MANUAL
Use with
Section 1.3
Quantitative and
Qualitative Observations
R
Copyright © Glencoe/McGraw-Hill, a division of the McGraw-Hill Companies, Inc.
eactions are taking place around you all the time. It is important
to be aware of your surroundings and understand how humans
interact with these surroundings. Your five senses allow you to
observe the world in which you live. In the lab, you only use four
senses to make observations. Nothing is ever tasted in the lab.
Sometimes tools can extend your senses. When you describe the
color, odor, or texture of an object, you are making a qualitative
observation. Quantitative observations involve measured quantities,
such as 15 g or 2.5 L. It is important not to confuse observations and
interpretations in the lab. Observations are made using your senses;
interpretations are proposed explanations that are based on
observations. In this lab, you will be making both qualitative and
quantitative observations.
Problem
Objectives
Materials
How many observations
can you make about a
reaction? Are your
observations qualitative
or quantitative?
• Measure the change in
temperature related to a
chemical reaction.
• Compare quantitative
observations and qualitative observations.
• Discuss the difference
between observations
and interpretations.
• Predict one product
produced during the
reaction.
CBL unit
TI graphing
calculator
link cable
temperature probe
copper(II) chloride
2 ϫ 2-in square of
aluminum foil
150-mL beaker
100-mL graduated
cylinder
microspatula
glass stirring rod
paper towel
magnifying glass
weighing paper
Safety Precautions
•
•
•
•
Always wear safety goggles and a lab apron.
Do not touch chemicals with bare skin.
Do not inhale vapors that are released.
Dispose of materials as your teacher instructs.
Pre-Lab
1. What is the difference between observations and
interpretations?
2. Give three examples of qualitative observations
and three examples of quantitative observations.
CBL Laboratory Manual
3. What are some tools that scientists use to enhance
their observational techniques?
Chemistry: Matter and Change • Chapter 1
1
Name
Date
1
CBL LABORATORY MANUAL
4. Using the 100-mL graduated cylinder, obtain
Procedure
Part A: Preparing the CBL System
1. Connect the CBL unit to the temperature probe,
5.
as shown in Figure A. Make sure the temperature probe is in channel 1. Then, using a link
cable, connect the CBL unit to the graphing
calculator.
6.
Figure A
TI graphing
calculator
CBL
unit
Temperature
probe
7.
8.
9.
AC adapter
Link cable
10.
2. Turn on the CBL unit and the graphing calcula-
tor. Press the PRGM button on the calculator
and choose ChemBio from the list of programs.
Press ENTER on the calculator twice.
3. Choose SET UP PROBES from the MAIN
MENU. Enter 1 as the number of probes.
On the SELECT PROBES menu, choose
TEMPERATURE. Enter 1 as the channel
number.
4. From the MAIN MENU, select COLLECT
DATA. On the DATA COLLECTION menu,
select TRIGGER/PROMPT.
Part B: Collecting Data
1. Obtain a 2 ϫ 2-in square of aluminum.
2. Place a small scoop of copper(II) chloride onto
a piece of weighing paper.
3. Make as many observations of the aluminum
and the copper(II) chloride as possible. Record
your observations in Data Table 1.
2
Chemistry: Matter and Change • Chapter 1
11.
12.
50 mL of distilled water. Pour the water into the
150-mL beaker.
Place the temperature probe in the water.
Record an initial temperature of the water by
pressing TRIGGER on the CBL unit. Follow
directions on the calculator to continue
collecting data.
With the temperature probe in the water, transfer the copper(II) chloride into the water
without touching the probe. Try not to agitate
the mixture. Note any temperature change.
Before stirring the mixture, record as many
observations as possible in Data Table 1.
Using the glass stirring rod, stir the mixture.
After stirring, make and record as many observations as possible.
Roll the aluminum foil loosely into a ball. Do
not tightly pack the aluminum. Place the foil
ball in the copper(II) chloride mixture. Let the
reaction proceed for about 15 min. Make and
record as many observations as possible of the
reaction mixture.
Record the maximum temperature change that
takes place during the reaction.
When the reaction appears to be complete,
remove the probe from the water. Pour off as
much of the liquid as possible.
Label a paper towel with your name and class
period. Pour the remaining contents onto the
paper towel. Set aside the paper towel for
observation on the second day of lab.
Cleanup and Disposal
1. Disconnect the temperature probe from the
CBL unit.
2. After emptying the beaker, clean and rinse the
beaker. Rinse the probe with distilled water and
carefully wipe it dry.
3. Return all equipment to its proper place.
4. Clean up the lab area and wash your hands with
soap or detergent before leaving the lab.
CBL Laboratory Manual
Copyright © Glencoe/McGraw-Hill, a division of the McGraw-Hill Companies, Inc.
LAB
Class
Name
Date
LAB
1
Class
CBL LABORATORY MANUAL
Data and Observations
Data Table 1
Steps
Observations
3. Dry copper(II) chloride
Aluminum
5. Initial temperature of water (°C)
7. Copper(II) chloride and water mixture
before stirring
8. Copper(II) chloride and water mixture
after stirring
9. Copper(II) chloride and water mixture
with aluminum
10. Final temperature of mixture (°C)
Analyze and Conclude
1. Observing and Inferring Describe the events that took place that provide evidence for a
Copyright © Glencoe/McGraw-Hill, a division of the McGraw-Hill Companies, Inc.
chemical reaction.
2. Observing and Inferring Name one product that is formed in this reaction.
3. Observing and Inferring What observations did you make during this lab? What
interpretations can you make from your observations?
4. Thinking Critically Which of the observations you made were quantitative?
CBL Laboratory Manual
Chemistry: Matter and Change • Chapter 1
3
Name
Date
LAB
1
Class
CBL LABORATORY MANUAL
5. Error Analysis What could be done to improve the accuracy of your measurements in
this activity?
Real-World Chemistry
1. Why is it important for scientists to have
3. How do observation and interpretation skills
help when working with the scientific method?
Copyright © Glencoe/McGraw-Hill, a division of the McGraw-Hill Companies, Inc.
as much data as possible before making
interpretations?
2. Why is important for high school students to
develop their observation skills?
4
Chemistry: Matter and Change • Chapter 1
CBL Laboratory Manual
Name
LAB
Date
2
Class
CBL LABORATORY MANUAL
Use with
Section 8.2
Conductivity
T
he solubility of a substance describes the ability of one substance
to dissolve in another substance. Water is used as a solvent to
determine the solubility of various solids. Some substances dissolve in
water; some substances do not.
When dissolved in water, the ions in an ionic compound separate,
or dissociate. As the ions dissociate, electrons are free to move about
in the solution. As these electrons move, it is possible for them to
carry an electric current.
Copyright © Glencoe/McGraw-Hill, a division of the McGraw-Hill Companies, Inc.
In this activity, the conductivity of substances is used to determine
to what extent substances dissociate in water. This lab compares an
ionic solid to a nonionic substance and relates the effect of
concentration on conductivity.
Problem
Objectives
Materials
How can an electric current
be used to determine the
extent to which solid substances dissolve in water?
• Predict what substances
will dissociate in water
based on their chemical
makeup.
• Write balanced equations
for the dissociation of
substances in water.
• Compare the conductivity
of various solutions.
• Classify substances as
nonionic or ionic.
• Determine what effect
concentration has on
conductivity.
CBL unit
TI graphing
calculator
computer
link cable
conductivity probe
adapter cable
dropper bottles (3)
with:
(a) 1M NaCl
(b) 1M MgCl2
(c) 1M AlCl3
50-mL beakers (2)
with:
(a) NaCl
(b) sugar
(C12H22O11)
400-mL beaker
150-mL beakers (3)
100-mL graduated
cylinder
glass stirring rod
ring stand with
test-tube clamp
wash bottle of
distilled water
microspatula
electronic balance
weighing dishes (2)
plastic beral
pipettes (3)
Safety Precautions
• Always wear safety goggles and a lab apron.
• Use caution when working with electricity.
• The conductivity probe is fragile. Use caution when setting this up in
the ring stand.
• Never taste any chemical substances.
CBL Laboratory Manual
Chemistry: Matter and Change • Chapter 8
5
Name
Date
2
CBL LABORATORY MANUAL
4. Turn on the CBL unit and the graphing calculator.
Pre-Lab
1. Read over the entire laboratory activity. Write
balanced chemical equations for the dissociation
of NaCl, MgCl2 and AlCl3 in water. Form a
hypothesis as to which of these compounds
would conduct the most electricity and the least
electricity. Record your hypothesis on the next
page.
2. Which of the following substances would be considered ionic? Which would be nonionic? Explain
your reason for each answer.
a. potassium chloride (KCl)
b. methanol (CH3OH)
c. glucose (C6H12O6)
d. hydrochloric acid (HCl)
e. zinc oxide (ZnO)
3. Sketch a diagram of NaCl dissolving in water.
Choose ChemBio from the list of programs. Press
ENTER on the calculator twice.
5. Choose SET UP PROBES from the MAIN
MENU. Enter 1 as the number of probes. On the
SELECT PROBES menu, choose CONDUCTIVITY. Enter 1 as the channel number. Then select
USE STORED from the CALIBRATION menu
and select H 0-2000 MICS from the CONDUCTIVITY menu. Make sure the switch on the box
is set to the same value.
6. From the MAIN MENU, select COLLECT
DATA. On the DATA COLLECTION menu,
select TRIGGER PROMPT. Allow the unit to
warm up and then press ENTER.
Part B: Comparing Ionic Compounds
1. Label three beral pipettes—NaCl, MgCl2, and
Procedure
Part A: Preparing the CBL System
If your teacher has the CBL system set up, you may
skip to Part B.
1. Set up a ring stand, clamp, and CBL probe as
illustrated in Figure A.
2. Plug the conductivity probe into the adapter cable
in channel 1 of the CBL unit.
3. Connect the CBL unit to the graphing calculator
with a link cable.
Figure A
2.
3.
4.
Ring stand
Conductivity
probe
Test-tube
clamp
5.
Graphing
calculator
CBL unit
Beaker
6.
7.
Link
cable
6
Chemistry: Matter and Change • Chapter 8
AlCl3. Fill one of the pipettes with the 1.0M solution of NaCl. Fill the other two pipettes with
1.0M MgCl2 and AlCl3, respectively.
Using the 100-mL graduated cylinder, measure
70 mL of distilled water into the 150-mL beaker.
Raise the beaker until the conductivity probe is in
the water. After the conductivity meter stabilizes,
press TRIGGER on the CBL unit.
Measure and record the conductivity of the distilled water in Data Table 1.
Lower the beaker and place 1 drop of NaCl solution into the distilled water. Stir with the glass
stirring rod and then raise the beaker until the
conductivity probe is in the solution. After the
conductivity meter stabilizes, press TRIGGER on
the CBL unit. Measure and record the conductivity of this solution in Data Table 1.
Adding 1 more drop of the NaCl solution, repeat
step 4. Continue adding 1 drop and recording its
conductivity until a total of 8 drops of NaCl solution has been added.
If a TI-83 graphing calculator is being used, or
another type of graphing calculator and a computer is available, refer to Appendix A for
instructions on how to convert this data into
graphical analysis.
After transferring the data to the graphing program, rinse out the beaker with distilled water
and repeat steps 4–6 two more times using MgCl2
CBL Laboratory Manual
Copyright © Glencoe/McGraw-Hill, a division of the McGraw-Hill Companies, Inc.
LAB
Class
Name
Date
LAB
2
Class
CBL LABORATORY MANUAL
and AlCl3, respectively. Be sure to transfer the
data to the graphing program and rinse out the
beaker after each substance. Rinse the conductivity probe with distilled water in between each
substance. (Do this by spraying the probe over
the 400-mL beaker or sink.)
Part C: Comparing Ionic and Molecular
Substances
4. Use the conductivity probe to monitor the con-
ductivity of the sodium chloride solution. Record
the conductivity in Data Table 2.
5. Rinse the probe with distilled water.
6. Use the conductivity probe to monitor the conductivity of the sucrose solution. Record the
conductivity in Data Table 2.
Cleanup and Disposal
1. In two separate weighing dishes, measure 10 g
of sodium chloride (NaCl) and 10 g of sucrose
(C12H22O11).
2. Using the 100-mL graduated cylinder, place
50 mL of distilled water in each of two 150-mL
beakers. Label one of the beakers sodium chloride (NaCl) and the other beaker sucrose
(C12H22O11).
3. Pour the solid sodium chloride and sucrose into
the appropriate beakers and stir with a glass
stirring rod.
1. Disconnect the conductivity probe from the CBL
unit.
2. Rinse the probes with distilled water.
3. Rinse out the beakers with distilled water.
4. Clean up your lab area and wash your hands.
Replace the lab equipment to the appropriate area.
Hypothesis
Data and Observations
Copyright © Glencoe/McGraw-Hill, a division of the McGraw-Hill Companies, Inc.
Data Table 1 (to be used if graphing program not available)
Drops
NaCl conductivity
(microsiemens)
MgCl2 conductivity
(microsiemens)
AlCl3 conductivity
(microsiemens)
0
1
2
3
4
5
6
7
8
Data Table 2
Substance
Conductivity
Sodium chloride (NaCl)
Sucrose (C12H22O11)
CBL Laboratory Manual
Chemistry: Matter and Change • Chapter 8
7
Name
Date
LAB
2
Class
CBL LABORATORY MANUAL
Analyze and Conclude
1. Observing and Inferring Which solution was the best conductor of electricity? Explain.
2. Making and Using Graphs Make a graph of conductivity versus concentration. Plot
conductivity on the y-axis and concentration (number of drops) on the x-axis. If you used a
graphing program, you may use those graphs. Draw a line of best fit for each of these sets
of data.
AlCl3, what is the ratio of number of electrons transferred in each reaction? How does this
explain the graphs drawn in question 2?
4. Drawing a Conclusion How does the conductivity of sodium chloride compare with
sucrose? Why is this the case?
Real-World Chemistry
What types of substances make good conductors of electricity? What element is used to
bring electricity to the places where we live? Why is this an effective substance?
8
Chemistry: Matter and Change • Chapter 8
CBL Laboratory Manual
Copyright © Glencoe/McGraw-Hill, a division of the McGraw-Hill Companies, Inc.
3. Observing and Inferring For each of the dissociation reactions of NaCl, MgCl2 and
Name
LAB
Date
3
Class
CBL LABORATORY MANUAL
Melting and Freezing Points
Use with
Section 13.4
W
hen you add heat to a substance, the average kinetic energy of
the particles in the substance increases. If enough energy is
added, the particles overcome the attractive forces holding the particles
together and the substance changes state—from a solid to a liquid, or
even to a gas. As this happens, the movement of the particles becomes
more random. By contrast, as substances lose heat, the interactions
between particles increases and the particles become more ordered.
Copyright © Glencoe/McGraw-Hill, a division of the McGraw-Hill Companies, Inc.
The temperature of a substance stays the same during any change of
state, or phase change. The energy absorbed by the system is used to
overcome intermolecular attractions, not to increase the kinetic energy
(temperature) of the substance. In this lab, you will determine the
melting/freezing point for water and a food preservative, BHT
(butylated hydroxytoluene, C15H24O).
Problem
Objectives
Materials
What are the melting/
freezing points of water
and BHT (C15H24O)?
• Describe the process of
melting and freezing.
• Determine the melting
and freezing points of
two substances.
• Predict which substance
will have a higher or
lower melting/freezing
point.
CBL unit
TI graphing
calculator
link cable
temperature probe
AC adapter
BHT
salt (NaCl)
ice
water
400-mL beaker
25-mL graduated
cylinder
20 ϫ 150-mm test
tube
hot plate
ring stand
clamp
glass stirring rod
Safety Precautions
•
•
•
•
•
Always wear safety goggles and a lab apron.
Use caution when working with the hot plate.
Never taste any of the chemicals used in the lab.
Do not touch the salt–ice solution. It will be extremely cold.
Dispose of materials as your teacher instructs.
Pre-Lab
1. Read the entire laboratory activity. Sketch a
representation of the solid, liquid, and gaseous
states of matter.
2. What terms are used to describe the following
phase changes: solid to liquid; liquid to gas; solid
to gas; gas to liquid; liquid to solid?
CBL Laboratory Manual
3. Using your textbook, look up the heating curve
for water. Describe each portion of the curve and
explain why it has that particular shape.
Chemistry: Matter and Change • Chapter 13
9
Name
Date
3
Procedure
CBL LABORATORY MANUAL
6. Now lower the test tube of water into the beaker
Part A: Preparing the CBL System
1. Connect the CBL unit to the temperature probe,
as shown in Figure A. Make sure the temperature probe is in channel 1. Then, using a link
cable, connect the CBL unit to the graphing calculator.
2. Turn on the CBL unit and the graphing calculator. Press the PRGM button on the calculator
and choose ChemBio from the list of programs.
Press ENTER on the calculator twice.
3. Choose SET UP PROBES from the MAIN
MENU. Enter 1 as the number of probes.
On the SELECT PROBES menu, choose
TEMPERATURE. Enter 1 as the channel
number. Select USE STORED from the
CALIBRATION MENU.
Part B: Collecting Freezing Point Data
1. Fill a 400-mL beaker half full with ice, and then
2.
3.
4.
5.
add 100 mL of water.
Put 5–7 mL of water into a test tube and set up
the apparatus as shown in Figure A. Do not
lower the test tube of water into the ice water
until you have set up the calculator for data
collection. (See step 3.)
From the MAIN MENU, select COLLECT
DATA. On the DATA COLLECTION menu,
select TIME GRAPH. Enter 15 as the time
(in s) between samples and then enter 80 as the
number of samples. The CBL unit will collect
data for 20 min.
Press ENTER; then select USE TIME SETUP
to continue. Note: If you want to change the
sample time or sample number you entered,
select MODIFY SETUP.
Enter Ϫ15 as the minimum temperature (Ymin)
and 100 as the maximum temperature (Ymax).
Enter 1 as the temperature increment (Yscl).
7.
8.
9.
10.
11.
of ice water and press ENTER on the calculator
to begin data collecting.
After lowering the test tube, add 5 spoonfuls of
salt to the beaker and stir with a stirring rod.
Continue to stir the ice water.
During data collection, slowly stir the water in
the test tube containing the temperature probe.
If all the ice in the beaker melts, add additional
pieces of ice to the beaker.
Once crystals begin to form in the water, stop
stirring and let the probe freeze in the water.
After 20 minutes, the CBL will stop collecting
data. If you think the lab is complete before
20 minutes, you may stop the run by pressing
the <ON> button of the calculator to stop the
program.
See page v for sending data for graphical
analysis.
On the displayed graph, analyze the flat part of
the curve to determine the freezing temperature
of water. Save your data.
Ring stand
with clamp
Temperature
probe
Graphing
calculator
Test tube
with water
or BHT
CBL unit
Beaker with
ice water
Link
cable
Figure A
10
Chemistry: Matter and Change • Chapter 13
CBL Laboratory Manual
Copyright © Glencoe/McGraw-Hill, a division of the McGraw-Hill Companies, Inc.
LAB
Class
Name
LAB
Date
3
Part C: Collecting Melting Point Data
1. Set up the CBL for taking data as in steps 3–5
of Part B.
2. Take the test tube of frozen water out of the ice
bath and place it in the hot-water bath. Heat the
test tube slowly. Allow the CBL to take data
until the water has completely melted. Follow
directions on page X to save your data.
Part D: Collecting BHT Data
Class
CBL LABORATORY MANUAL
Cleanup and Disposal
1. Dispose of the salt–ice solution following your
teacher’s directions.
2. Place the BHT test tube in the hot-water bath
your teacher has prepared.
3. Clean up the lab area and wash your hands with
soap or a detergent.
Data and Observations
Data Table 1
Obtain a BHT test tube that your teacher has prepared for you. Repeat parts B and C using the BHT.
Substance
Freezing
point (°C)
Melting
point (°C)
Water
BHT
Analyze and Conclude
1. Observing and Inferring What is the freezing point of water? Of BHT? What evidence
Copyright © Glencoe/McGraw-Hill, a division of the McGraw-Hill Companies, Inc.
do you have?
2. Collecting and Interpreting Data What is the relationship between melting point and
freezing point? Explain your answer.
3. Recognizing Cause and Effect Use the concept of molecular motion to describe why
the temperature does not change during a phase change.
CBL Laboratory Manual
Chemistry: Matter and Change • Chapter 13
11
Name
Date
LAB
3
Class
CBL LABORATORY MANUAL
4. Drawing a Conclusion Look at the structures of water and of BHT. Suggest an
explanation for the differences in their melting/freezing points.
5. Thinking Critically What role did the salt play in this investigation?
Real-World Chemistry
1. How could a scientist know if he or she had
2. Why does ice float in a glass of water?
Copyright © Glencoe/McGraw-Hill, a division of the McGraw-Hill Companies, Inc.
pure water or pure BHT based on the tests you
just completed?
12
Chemistry: Matter and Change • Chapter 13
CBL Laboratory Manual
Name
LAB
Date
4
Class
CBL LABORATORY MANUAL
Use with
Section 14.1
Boyle’s Law
S
Copyright © Glencoe/McGraw-Hill, a division of the McGraw-Hill Companies, Inc.
uppose you have a basketball containing a given volume of air. If
you were to sit on the ball, its volume would decrease. What
happens to the particles of air inside the ball? They would be forced
to occupy a smaller volume. Because the particles are more crowded,
collisions among particles and between the particles and the inside
surface of the ball increase. This increase in the number of collisions
causes an increase in pressure inside the ball. The relationship
between the volume of a gas and the pressure it exerts is known as
Boyle’s law, and it can be studied in a laboratory setting.
Problem
Objectives
Materials
What is the relationship
between the volume and
pressure in a closed system?
• Collect data that relate
pressure to volume.
• Analyze laboratory data
and develop a mathematical expression to show
the relationship between
pressure and volume.
• Calculate pressure of an
unknown gas.
CBL unit
TI graphing
calculator
link cable
AC adapter for CBL
unit
CBL-DIN adapter
gas pressure sensor
syringe
Safety Precautions
• Always wear safety goggles and a lab apron.
• Use caution when pushing on syringe.
• Use caution when making electrical connections.
Pre-Lab
1. Sketch three syringes at equal temperature and
containing an equal number of gas particles.
Show the plungers at three different volumes—
5 mL, 15 mL, and 20 mL. Use dots to represent
the gas particles. How do the contents of the three
syringes appear to be different? How does the
pressure differ in the three syringes?
CBL Laboratory Manual
2. What is the definition of pressure, volume, and
temperature?
3. Read over the entire laboratory activity. Form
a hypothesis as to how volume and pressure
are related in a closed system. Record your
hypothesis on page 14.
4. What variables are changed in this lab? What is
held constant?
Chemistry: Matter and Change • Chapter 14
13
Name
Date
LAB
4
Class
CBL LABORATORY MANUAL
Figure A
DIN adapter
TI calculator
CBL
unit
Gas pressure
sensor
Syringe
AC adapter
for CBL unit
Link cable
2. Press the plunger of the syringe down to the 5 mL
Part A: Preparing the CBL System
1. Connect the syringe to the gas pressure sensor.
Then connect the CBL unit to both the gas pressure sensor and the graphing calculator as shown
in Figure A. Make sure the gas pressure sensor
probe is in channel 1.
2. Turn on the CBL unit and the graphing calculator.
Press the PRGM button on the calculator and
choose ChemBio from the list of programs. Press
ENTER on the calculator twice.
3. Choose SET UP PROBES from the MAIN
MENU. Enter 1 as the number of probes. On the
SELECT PROBES menu, choose PRESSURE.
Enter 1 as the channel number. Then select USE
STORED from the CALIBRATION menu and
select ATM for your units. You will be returned to
the MAIN MENU.
4. From the MAIN MENU, select COLLECT
DATA. On the DATA COLLECTION menu,
select TRIGGER PROMPT. Follow the directions
on the calculator to collect data.
3.
4.
5.
6.
mark. When the pressure gauge stops changing,
press TRIGGER on the CBL unit. Enter 5 as the
mL on the graphic calculator.
From the DATA COLLECTION menu, select
MORE DATA.
Repeat steps 1 through 3, pressing the plunger
of the syringe down to the 7.5 mL, 10.0, mL,
12.5 mL, 15.0 mL, 17.5 mL, and 20.0 mL marks.
After the last set of data, select STOP AND
GRAPH.
Select GRAPH on your calculator to see a line
graph. Press STAT and then choose EDIT. The
data are now displayed. Volume will be in
Column 1 and pressure will be in Column 2.
Record these data in Data Table 1.
Cleanup and Disposal
Disconnect the sensor from the CBL unit. Following
your teacher’s directions, return all equipment to its
proper place.
Hypothesis
Part B: Collecting Data
1. Open the blue valve between the atmosphere and
the syringe. Set the inside ring of the syringe to
the 20 mL mark and close the blue valve to the
atmosphere.
14
Chemistry: Matter and Change • Chapter 14
CBL Laboratory Manual
Copyright © Glencoe/McGraw-Hill, a division of the McGraw-Hill Companies, Inc.
Procedure
Name
Date
LAB
4
Class
CBL LABORATORY MANUAL
Data and Observations
Data Table 1
Volume (mL)
Pressure (ATM)
Constant (pؒv or p/v)
5.0
7.5
10.0
Analyze and Conclude
1. Collecting and Interpreting Data As the volume changes from 10 to 20 mL, what
happens to the pressure?
2. Observing and Inferring Is the relationship between volume and pressure an inverse or
Copyright © Glencoe/McGraw-Hill, a division of the McGraw-Hill Companies, Inc.
a direct relationship?
3. Thinking Critically Why is the graph you see a curved line, not a straight line? What
mathematical function would you have to graph to achieve a straight line?
4. Predicting Predict what the pressure of the gas in the syringe would be if the volume
was increased to 40 mL.
CBL Laboratory Manual
Chemistry: Matter and Change • Chapter 14
15
Name
Date
LAB
4
Class
CBL LABORATORY MANUAL
5. Recognizing Cause and Effect Why was it necessary to keep temperature and number
of gas particles constant during this activity?
6. Error Analysis What could be done to improve the accuracy of this investigation?
Real-World Chemistry
1. Why would it be important for a scuba diver to
2. What are some common household products
that utilize Boyle’s law?
Copyright © Glencoe/McGraw-Hill, a division of the McGraw-Hill Companies, Inc.
be familiar with Boyle’s law?
16
Chemistry: Matter and Change • Chapter 14
CBL Laboratory Manual
Name
LAB
Date
5
Class
CBL LABORATORY MANUAL
Use with
Section 14.1
Gay-Lussac’s Law
H
Copyright © Glencoe/McGraw-Hill, a division of the McGraw-Hill Companies, Inc.
ave you ever tried to bounce a cold basketball or walked outside
in the cold with a helium balloon? Why is it never advisable to
heat a sealed container? As you might predict, these items act in an
odd manner under different temperature conditions. Why does this
happen? In this lab, you will investigate the relationship between
temperature and pressure, as proposed by Joseph Gay-Lussac.
Problem
Objectives
Materials
What is the relationship
between the temperature
and pressure of a sealed
container of gas at a
constant volume?
• Develop a mathematical
expression to show the
relationship between
temperature and volume.
• Determine a temperaturevolume constant.
• Make calculations on
unknown gases based
on a determined
temperature-volume
constant.
CBL unit
TI graphing calculator
Vernier CBL pressure sensor (attached to
rubber stopper assembly)
Vernier temperature probe
1000-mL beakers (3)
150-mL Erlenmeyer flask
ice
thermal mitt
hot plate
Safety Precautions
• Always wear safety goggles and a lab apron.
• Use caution when working around a hot plate and hot glassware.
• Use caution when making electrical connections.
Pre-Lab
Procedure
1. What are temperature and pressure?
Part A: Preparing the CBL System
2. Describe these three containers in relationship to
1. Connect the CBL unit to the pressure sensor and
each other in terms of particle speed and collisions with the walls of the container. All have
same amounts of the same gas in them.
a. 1-L container at 25°C
b. 1-L container at 150°C
c. 1-L container at 300°C
3. Read over the entire lab activity. What variables
will be held constant in this lab?
temperature probe, as shown in Figure A. Make
sure the pressure sensor is in channel 1 and the
temperature probe is in channel 2. Use the link
cable to connect the CBL to the graphing
calculator.
2. Turn on the CBL unit and the graphing calculator.
Press the PRGM button on the calculator and
choose ChemBio from the list of programs. Press
ENTER on the calculator twice.
CBL Laboratory Manual
Chemistry: Matter and Change • Chapter 14
17