Water distribution system handbook (part 2)
Bạn đang xem bản rút gọn của tài liệu. Xem và tải ngay bản đầy đủ của tài liệu tại đây (10.9 MB, 215 trang )
CHAPTER 6
HYDRAULIC TRANSIENT
DESIGN FOR
PIPELINE SYSTEMS
C. Samuel Martin
School of Civil and Environmental Engineering
Georgia Institute of Technology
Atlanta, GA
6.1 INTRODUCTIONTOWATERHAMMER
AND SURGING
By definition, waterhammer is a pressure (acoustic) wave phenomenon created by relatively sudden changes in the liquid velocity. In pipelines, sudden changes in the flow
(velocity) can occur as a result of (1) pump and valve operation in pipelines, (2) vapor
pocket collapse, or (3) even the impact of water following the rapid expulsion of air out
of a vent or a partially open valve. Although the name waterhammer may appear to be a
misnomer in that it implies only water and the connotation of a "hammering" noise, it has
become a generic term for pressure wave effects in liquids. Strictly speaking, waterhammer can be directly related to the compressibility of the liquid-primarily water in this
handbook. For slow changes in pipeline flow for which pressure waves have little to no
effect, the unsteady flow phenomenon is called surging.
Potentially, waterhammer can create serious consequences for pipeline designers if not
properly recognized and addressed by analysis and design modifications. There have been
numerous pipeline failures of varying degrees and resulting repercussions of loss of property and life. Three principal design tactics for mitigation of waterhammer are (1) alteration
of pipeline properties such as profile and diameter, (2) implementation of improved valve
and pump control procedures, and (3) design and installation of surge control devices.
In this chapter, waterhammer and surging are defined and discussed in detail with reference to the two dominant sources of waterhammer-pump and/or valve operation.
Detailed discussion of the hydraulic aspects of both valves and pumps and their effect on
hydraulic transients will be presented. The undesirable and unwanted, but often potentially possible, events of liquid column separation and rejoining are a common justification
for surge protection devices. Both the beneficial and detrimental effects of free (entrained
or entrapped) air in water pipelines will be discussed with reference to waterhammer and
surging. Finally, the efficacy of various surge protection devices for mitigation of waterhammer is included.
6.2 FUNDAMENTALSOFWATERHAMMER
AND SURGE
The fundamentals of waterhammer, an elastic process, and surging, an incompressible
phenomenon, are both developed on the basis of the basic conservational relationships of
physics or fluid mechanics. The acoustic velocity stems from mass balance (continuity),
while the fundamental waterhammer equation of Joukowsky originates from the application of linear momentum [see Eq. (6.2)].
6.2.1
Definitions
Some of the terms frequently used in waterhammer are defined as follows.
•
Waterhammer. A pressure wave phenomenon for which liquid compressibility plays
a role.
• Surging. An unsteady phenomenon governed solely by inertia. Often termed mass
oscillation or referred to as either rigid column or inelastic effect.
• Liquid column separation. The formation of vapor cavities and their subsequent
collapse and associated waterhammer on rejoining.
• Entrapped air. Free air located in a pipeline as a result of incomplete filling, inadequate venting, leaks under vacuum, air entrained from pump intake vortexing, and
other sources.
• Acoustic velocity. The speed of a waterhammer or pressure wave in a pipeline.
• Joukowsky equation. Fundamental relationship relating waterhammer pressure
change with velocity change and acoustic velocity. Strictly speaking, this equation is
only valid for sudden flow changes.
6.2.2 Acoustic Velocity
For wave propagation in liquid-filled pipes the acoustic (sonic) velocity is modified by the
pipe wall elasticity by varying degrees, depending upon the elastic properties of the wall
material and the relative wall thickness. The expression for the wave speed is
..-,^-*
V^H
«,„
y^?f
where E is the elastic modulus of the pipe wall, D is the inside diameter of the pipe, e is
the wall thickness, and a0 is the acoustic velocity in the liquid medium. In a very rigid pipe
or in a tank, or in large water bodies, the acoustic velocity a reduces to the well-known
relationship a = a0 = V(£/p). For water K = 2.19 GPa (318,000 psi) and p = 998 kg/m3
(1.936 slug/ft3), yielding a value of a0 = 1483 m/sec (4865 ft/sec), a value many times that
of any liquid velocity V.
6.2.3 Joukowsky (Waterhammer) Equation
There is always a pressure change Ap associated with the rapid velocity change AV across
a waterhammer (pressure) wave. The relationship between Ap and AV from the basic
physics of linear momentum yields the well-known Joukowsky equation
Ap = -paAV
(6.2)
where p is the liquid mass density, and a is the sonic velocity of the pressure wave in the
fluid medium in the conduit. Conveniently using the concept of head, the Joukowsky head
rise for instantaneous valve closure is
A/f=Ap =
PS
_paAV = ^
P8
8
The compliance of a conduit or pipe wall can have a significant effect on modification of (1) the acoustic velocity, and (2) any resultant waterhammer, as can be
shown from Eq. (6.1) and Eq. (6.2), respectively. For simple waterhammer waves for
which only radial pipe motion (hoop stress) effects are considered, the germane physical pipe properties are Young's elastic modulus (E) and Poisson ratio (\i). Table 6.1
summarizes appropriate values of these two physical properties for some common
pipe materials.
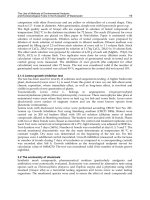
The effect of the elastic modulus (E) on the acoustic velocity in water-filled circular
pipes for a range of the ratio of internal pipe diameter to wall thickness (Die) is shown in
Fig. 6.1 for various pipe materials.
TABLE 6.1 Physical Properties of Common Pipe Materials
Material
Asbestos cement
Young's Modulus
E (GPa)
Poisson's Ratio
\i
23-24
Cast iron
80-170
0.25-0.27
Concrete
14-30
0.10-0.15
Concrete (reinforced)
30-60
Ductile iron
Polyethylene
PVC (polyvinyl chloride)
Steel
172
0.30
0.7-0.8
0.46
2.4-3.5
200-207
0.46
0.30
Speed of Sound in m/sec
Elastic Modulus (GPa)
Speed of Sound in ft/sec
Diameter to Wall Thickness Ratio (D/e)
FIGURE 6.1 Effect of wall thickness of various pipe materials on acoustic velocity
in water pipes.
6.3
HYDRAULIC CHARACTERISTICS OF VALVES
Valves are integral elements of any piping system used for the handling and transport of
liquids. Their primary purposes are flow control, energy dissipation, and isolation of portions of the piping system for maintenance. It is important for the purposes of design and
final operation to understand the hydraulic characteristics of valves under both steady and
unsteady flow conditions. Examples of dynamic conditions are direct opening or closing
of valves by a motor, the response of a swing check valve under unsteady conditions, and
the action of hydraulic servovalves. The hydraulic characteristics of valves under either
noncavitating or cavitating conditions vary considerably from one type
of valve design to
another. Moreover, valve characteristics also depend upon particular valve design for a
special function, upon absolute size, on manufacturer as well as the type of pipe fitting
employed. In this section the fundamentals of valve hydraulics are presented in terms of
pressure drop (headloss) characteristics. Typical flow characteristics of selected valve
types of control-gate, ball, and butterfly, are presented.
6.3.1
Descriptions of Various Types of Valves
Valves used for the control of liquid flow vary widely in size, shape, and overall design
due to vast differences in application. They can vary in size from a few millimeters in
small tubing to many meters in hydroelectric installations, for which spherical and butterfly valves of very special design are built. The hydraulic characteristics of all types of
valves, albeit different in design and size, can always be reduced to the same basic
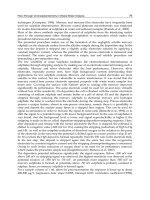
coefficients, notwithstanding fluid effects such as viscosity and cavitation. Figure 6.2
b) Globe valve
a) Gate valve
(circular gate)
c) Needle valve
e) Butterfly valve
d) Gate valve
(square gate)
f) Ball valve
FIGURE 6.2 Cross sections of selected control valves: (From Wood and Jones,
1973).
shows cross sections of some valve types to be discussed with relation to hydraulic
performance.
6.3.2
Definition of Geometric Characteristics of Valves
The valve geometry, expressed in terms of cross-sectional area at any opening, sharpness
of edges, type of passage, and valve shape, has a considerable influence on the eventual
hydraulic characteristics. To understand the hydraulic characteristics of valves it is useful,
however, to express the projected area of the valve in terms of geometric quantities. With
reference to Fig. 6.2 the ratio of the projected open area of the valve Av to the full open
valve Avo can be related to the valve opening, either a linear measure for a gate valve, or
an angular one for rotary valves such as ball, cone, plug, and butterfly types. It should be
noted that this geometric feature of the valve clearly has a bearing on the valve hydraulic
performance, but should not be used directly for prediction of hydraulic performance
-either steady state or transient. The actual hydraulic performance to be used in transient
calculations should originate from experiment.
6.3.3
Definition of Hydraulic Performance of Valves
The hydraulic performance of a valve depends upon the flow passage through the valve
opening and the subsequent recovery of pressure. The hydraulic characteristics of a valve
under partial to fully opened conditions typically relate the volumetric flow rate to a characteristic valve area and the headloss A/f across the valve. The principal fluid properties
that can affect the flow characteristics are fluid density p, fluid viscosity \i, and liquid
vapor pressure pv if cavitation occurs. Except for small valves and/or viscous liquids or
both, Reynolds number effects are usually not important, and will be neglected with reference to water. A valve in a pipeline acts as an obstruction, disturbs the flow, and in general causes a loss in energy as well as affecting the pressure distribution both upstream and
downstream. The characteristics are expressed either in terms of (1) flow capacity as a
function of a defined pressure drop or (2) energy dissipation (headloss) as a function of
pipe velocity. In both instances the pressure or head drop is usually the difference in total
head caused by the presence of the valve itself, minus any loss caused by regular pipe friction between measuring stations.
The proper manner in determining A// experimentally is to measure the hydraulic
grade line (HGL) far enough both upstream and downstream of the valve so that uniform
flow sections to the left of and to the right of the valve can be established, allowing for the
extrapolation of the energy grade lines (EGL) to the plane of the valve. Otherwise, the
valve headloss is not properly defined. It is common to express the hydraulic characteristics either in terms of a headloss coefficient K1 or as a discharge coefficient Cf where Av
is the area of the valve at any opening, and A# is the headloss defined for the valve.
Frequently a discharge coefficient is defined in terms of the fully open valve area. The
hydraulic coefficients embody not only the geometric features of the valve through Av but
also the flow characteristics.
Unless uniform flow is established far upstream and downstream of a valve in a
pipeline the value of any of the coefficients can be affected by effects of nonuniform flow.
It is not unusual for investigators to use only two pressure taps-one upstream and one
downstream, frequently 1 and 10 diameters, respectively. The flow characteristics of
valves in terms of pressure drop or headloss have been determined for numerous valves
by many investigators and countless manufacturers. Only a few sets
of data and typical
curves will be presented here for ball, butterfly, and gate, valves C0. For a valve located
in the interior of a long continuous pipe, as shown in Fig. 6.3, the presence of the valve
disturbs the flow both upstream and downstream of the obstruction as reflected by the
velocity distribution, and the pressure variation, which will be non- hydrostatic in the
regions of nonuniform flow. Accounting for the pipe friction between upstream and downstream uniform flow sections, the headloss across the valve is expressed in terms of the
pipe velocity and a headloss coefficient K1
W = K1^
(6.4)
Often manufacturers represent the hydraulic characteristics in terms of discharge
coefficients
Q = CfAvoV%&H = CFAVOV2^H
(6.5)
where
H = AH +^L
(6.6)
2
£
Both discharge coefficients are defined in terms of the nominal full-open valve area Avo
and a representative head, A/f for Cf and H for CG, the latter definition generally reserved
for large valves employed in the hydroelectric industry. The interrelationship between
Cf, CF, and K1 is
1
1 —C
<-/
F
2
KL = ^ = ^C
(6.7)
Frequently valve characteristics are expressed in terms of a dimensional flow coefficient Cv from the valve industry
Q = CvVty
(6.8)
where Q is in American flow units of gallons per minute (gpm) and Ap is the pressure loss
in pounds per square inch (psi). In transient analysis it is convenient to relate either the
loss coefficient or the discharge coefficient to the corresponding value at the fully open
valve position, for which Cf = Cfo. Hence,
Q. = ^L / A » = T /Mi
Q0 C^VAff.
VAff,
FIGURE 6.3 Definition of headloss characteristics of a valve.
)J
(69
l
°'
Traditionally the dimensionless valve discharge coefficient is termed i and defined by
C
C
C
Fir
T = -^
= -^
= -£=
/^
r
C
C
\ JT
^f0
C
vo
^f0
V
A
.10)
(6
VVJ.J.V7,
L
6.3.4 Typical Geometric and Hydraulic Valve Characteristics
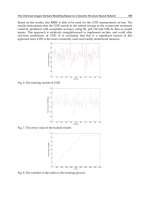
The geometric projected area of valves shown in Fig. 6.2 can be calculated for ball, butterfly, and gate valves using simple expressions. The dimensionless hydraulic flow coefficient T is plotted in Fig. 6.4 for various valve openings for the three selected valves along
with the area ratio for comparison. The lower diagram, which is based on hydraulic mea-
Area Ratio AyAy0
Area Characteristics of Valves
Relative Opening y/D (%)
Hydraulic (Tau) Characteristics of Valves
Relative Opening y/D (%)
FIGURE 6.4
Geometric and hydraulic characteristics of typical control valves.
TABLE 6.2
Classification of Valve Closure
Time of Closure tc
Type of Closure
O
< 2JJa
>2L/a
»2L/a
Instantaneous
Rapid
Gradual
Slow
Maximum Head
AH^
0^/g
aVJg
< aV0/g
«aV0/g
Phenomenon
Waterhammer
Waterhammer
Waterhammer
Surging
surements, should be used for transient calculations rather than the upper one, which is
strictly geometric.
6.3.5
Valve Operation
The instantaneous closure of a valve at the end of a pipe will yield a pressure rise satisfying Joukowsky's equation-Eq. (6.2) or Eq. (6.3). In this case the velocity difference
AV = O — V0 , where V0 is the initial velocity of liquid in the pipe. Although Eq. (6.2)
applies across every wavelet, the effect of complete valve closure over a period of time
greater than 2JJa, where L is the distance along the pipe from the point of wave creation
to the location of the first pipe area change, can be beneficial. Actually, for a simple
pipeline the maximum head rise remains that from Eq. (6.3) for times of valve closure
tc ^ 2JJa, where L is the length of pipe. If the value of tc > 2LJa, then there can be a considerable reduction of the peak pressure resulting from beneficial effects of negative wave
reflections from the open end or reservoir considered in the analysis. The phenomenon
can still be classified as Waterhammer until the time of closure tc > 2JJa, beyond which
time there are only inertial or incompressible deceleration effects, referred to as surging,
also known as rigid column analysis. Table 6.2 classifies four types of valve closure, independent of type of valve.
Using standard Waterhammer programs, parametric analyses can be conducted for the
preparation of charts to demonstrate the effect of time of closure, type of valve, and an
indication of the physical process-waterhammer or simply inertia effects of deceleration.
The charts are based on analysis of valve closure for a simple reservoir-pipe-valve
arrangement. For simplicity fluid friction is often neglected, a reasonable assumption for
pipes on the order of hundreds of feet in length.
6.4
HYDRAULIC CHARACTERISTICS OF PUMPS
Transient analyses of piping systems involving centrifugal, mixed-flow, and axial-flow
pumps require detailed information describing the characteristics of the respective turbomachine, which may pass through unusual, indeed abnormal, flow regimes. Since little if any
information is available regarding the dynamic behavior of the pump in question, invariably
the decision must be made to use the steady-flow characteristics of the machine gathered
from laboratory tests. Moreover, complete steady-flow characteristics of the machine may
not be available for all possible modes of operation that may be encountered in practice.
In this section steady-flow characteristics of pumps in all possible zones of operation
are defined. The importance of geometric and dynamic similitude is first discussed with
respect to both (1) homologous relationships for steady flow and (2) the importance of the
assumption of similarity for transient analysis. The significance of the eight zones of operation within each of the four quadrants is presented in detail with reference to three possible modes of data representation. The steady-flow characteristics of pumps are discussed
in detail with regard to the complete range of possible operation. The loss of driving power
to a pump is usually the most critical transient case to consider for pumps, because of the
possibility of low pipeline pressures which may lead to (1) pipe collapse due to buckling,
or (2) the formation of a vapor cavity and its subsequent collapse. Other waterhammer
problems may occur due to slam of a swing check valve, or from a discharge valve closing
either too quickly (column separation), or too slowly (surging from reverse flow). For radial-flow pumps for which the reverse flow reaches a maximum just subsequent to passing
through zero speed (locked rotor point), and then is decelerated as the shaft runs faster in
the turbine zone, the head will usually rise above the nominal operating value. As reported
by Donsky (1961) mixed-flow and axial-flow pumps may not even experience an upsurge
in the turbine zone because the maximum flow tends to occur closer to runaway conditions.
6.4.1 Definition of Pump Characteristics
The essential parameters for definition of hydraulic performance of pumps are defined as
• Impeller diameter. Exit diameter of pump rotor D1.
• Rotational speed. The angular velocity (rad/s) is co, while N = 2 jtco/60 is in rpm.
• Flow rate. Capacity Q at operating point in chosen units.
•
Total dynamic head (TDH). The total energy gain (or loss) H across pump, defined as
p
\
/P
v2
\
(Y H - ( T H
+
v2
S-S
«">
where subscripts 5 and d refer to suction and discharge sides of the pump, respectively,
6.4.2 Homologous (Affinity) Laws
Dynamic similitude, or dimensionless representation of test results, has been applied with
perhaps more success in the area of hydraulic machinery than in any other field involving
fluid mechanics. Due to the sheer magnitude of the problem of data handling it is imperative that dimensionless parameters be employed for transient analysis of hydraulic
machines that are continually experiencing changes in speed as well as passing through
several zones of normal and abnormal operation. For liquids for which thermal effects
may be neglected, the remaining fluid-related forces are pressure (head), fluid inertia,
resistance, phase change (cavitation), surface tension, compressibility, and gravity. If the
discussion is limited to single-phase liquid flow, three of the above fluid effects-cavitation, surface tension, and gravity (no interfaces within machine)-can be eliminated, leaving the forces of pressure, inertia, viscous resistance, and compressibility. For the steady
or even transient behavior of hydraulic machinery conducting liquids the effect of compressibility may be neglected.
In terms of dimensionless ratios the three forces yield an Euler number (ratio of inertia
force to pressure force), which is dependent upon geometry, and a Reynolds number.
For all flowing situations, the viscous force, as represented by the Reynolds number,
is definitely present. If water is the fluid medium, the effect of the Reynolds number
on the characteristics of hydraulic machinery can usually be neglected, the major
exception being the prediction of the performance of a large hydraulic turbine on the
basis of model data. For the transient behavior of a given machine the actual change in
the value of the Reynolds number is usually inconsequential anyway. The elimination
of the viscous force from the original list reduces the number of fluid-type forces from
seven to two-pressure (head) and inertia, as exemplified by the Euler number. The
appellation geometry in the functional relationship in the above equation embodies primarily, first, the shape of the rotating impeller, the entrance and exit flow passages,
including effects of vanes, diffusers, and so on; second, the effect of surface roughness;
and lastly the geometry of the streamline pattern, better known as kinematic similitude
in contrast to the first two, which are related to geometric similarity. Kinematic similarity is invoked on the assumption that similar flow patterns can be specified by
congruent velocity triangles composed of peripheral speed U and absolute fluid velocity V at inlet or exit to the vanes. This allows for the definition of a flow coefficient,
expressed in terms of impeller diameter D1 and angular velocity co:
C0 = ^
(6.12)
The reciprocal of the Euler number (ratio of pressure force to inertia force) is the head
coefficient, defined as
Q=^
(6.13)
CPF = —^5
PO)3Df
(6.14)
A power coefficient can be defined
For transient analysis, the desired parameter for the continuous prediction of pump
speed is the unbalanced torque T. Since T = P/co, the torque coefficient becomes
C
(6 15)
T = WDI
-
Traditionally in hydraulic transient analysis to refer pump characteristics to so-called
rated conditions-which preferably should be the optimum or best efficiency point (BEP),
but sometimes defined as the duty, nameplate, or design point. Nevertheless, in terms of
rated conditions, for which the subscript R is employed, the following ratios are defined;
Flow: v = -^QR
speed: a = -^- = -^<»R
KR
head: h = -^HR
torque:
P = ^4
H
TR
Next, for a given pump undergoing a transient, for which D1 is a constant, Eqs.
(6.12-6.15) can be written in terms of the above ratios
v. = _^_ = ^j£.
a
CQR
Q u>R
JL = ^L = JL^L
a*
CHR
HR co'
p _ cr _ r co/2
a'
CTR TR co
6.4.3 Abnormal Pump (Four-Quadrant) Characteristics
Head (h), Flow (v), and SpMd (a)
The performance characteristics discussed up to this point correspond to pumps operating
normally. During a transient, however, the machine may experience either a reversal in
flow, or rotational speed, or both, depending on the situation. It is also possible that the
torque and head may reverse in sign during passage of the machine through abnormal
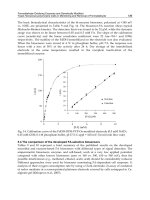
zones of performance. The need for characteristics of a pump in abnormal zones of operation can best be described with reference to Fig. 6.5, which is a simulated pump power
failure transient. A centrifugal pump is delivering water at a constant rate when there is a
sudden loss of power from the prime mover-in this case an electric motor. For the postulated case of no discharge valves, or other means of controlling the flow, the loss of driving torque leads to an immediate deceleration of the shaft speed, and in turn the flow.
The three curves are dimensionless head (h), flow (v), and speed (a). With no additional
means of controlling the flow, the higher head at the final delivery point (another reservoir) will eventually cause the flow to reverse (v < O) while the inertia of the rotating parts
has maintained positive rotation (a > O). Up until the time of flow reversal the pump has
been operating in the normal zone, albeit at a number of off-peak flows.
To predict system performance in regions of negative rotation and/or negative flow the
analyst requires characteristics in these regions for the machine in question. Indeed, any
peculiar characteristic of the pump in these regions could be expected to have an influence
on the hydraulic transients. It is important to stress that the results of such analyses are
critically governed by the following three factors: (1) availability of complete pump characteristics in zones the pump will operate, (2) complete reliance on dynamic similitude
(homologous) laws during transients, and (3) assumption that steady-flow derived pump
characteristics are valid for transient analysis.
Pumping
TurfaiM (III)
Dissipation (IV)
FIGURE 6.5
Simulated pump trip without valves in a single-pipeline
system.
Investigations by Kittredge (1956) and Knapp (1937) facilitated the understanding of
abnormal operation, as well as served to reinforce the need for test data. Following the
work by Knapp (1941) and Swanson (1953), and a summary of their results by Donsky
(1961), eight possible zones of operation, four normal and four abnormal, will be discussed here with reference to Fig. 6.6, developed by Martin (1983). In Fig. 6.6 the head
H is shown as the difference in the two reservoir elevations to simplify the illustration.
The effect of pipe friction may be ignored for this discussion by assuming that the pipe
is short and of relatively large diameter. The regions referred to on Fig. 6.6 are termed
zones and quadrants, the latter definition originating from plots of lines of constant head
Zone A. Normal Pumping (I)
Zone B. Energy Dissipation (I)
Zone C. Reverse Turbine (I)
Zone D. Energy Dissipation (II)
Zone E. Reverse Rotation Pumping
Radial-Flow Machine (II)
Zone E. Reverse Rotation Pumping
Mixed-or Axial-Flow Machine (III)
Zone F. Energy Dissipation (III)
Zone Q. Normal Turbine (III)
Zone H. Energy Dissipation (IV)
FIGURE 6.6 Four quadrants and eight zones of possible pump operation.
(From Martin, 1983).
and constant torque on a flow-speed plane (v — a axes). Quadrants I (v > O, a > O) and
III (v < O, a < O) are defined in general as regions of pump or turbine operation, respectively. It will be seen, however, that abnormal operation (neither pump nor turbine mode)
may occur in either of these two quadrants. A very detailed description of each of the
eight zones of operation is in order. It should be noted that all of the conditions shown
schematically in Fig. 6.6 can be contrived in a laboratory test loop using an additional
pump (or two) as the master and the test pump as a slave. Most, if not all, of the zones
shown can also be experienced by a pump during a transient under the appropriate set of
circumstances.
Quadrant I. Zone A (normal pumping) in Fig. 6.6 depicts a pump under normal operation for which all four quantities- Q, N, H1 and T are regarded as positive. In this case
Q > O, indicating useful application of energy. Zone B (energy dissipation) is a condition
of positive flow, positive rotation, and positive torque, but negative head—quite an abnormal condition. A machine could operate in Zone B by (1) being overpowered by another
pump or by a reservoir during steady operation, or (2) by a sudden drop in head during a
transient caused by power failure. It is possible, but not desirable, for a pump to generate
power with both the flow and rotation in the normal positive direction for a pump, Zone
C (reverse turbine), which is caused by a negative head, resulting in a positive efficiency
because of the negative torque. The maximum efficiency would be quite low due to the
bad entrance flow condition and unusual exit velocity triangle.
Quadrant IV Zone H, labeled energy dissipation, is often encountered shortly after a
tripout or power failure of a pump, as illustrated in Fig. 6.5. In this instance the combined
inertia of all the rotating elements-motor, pump and its entrained liquid, and shaft—has
maintained pump rotation positive but at a reduced value at the time of flow reversal
caused by the positive head on the machine. This purely dissipative mode results in a negative or zero efficiency. It is important to note that both the head and fluid torque are positive in Zone H, the only zone in Quadrant IV.
Quadrant III. A machine that passes through Zone H during a pump power failure will
then enter Zone G (normal turbining) provided that reverse shaft rotation is not precluded
by a mechanical ratchet. Although a runaway machine rotating freely is not generating
power, Zone G is the precise mode of operation for a hydraulic turbine. Note that the head
and torque are positive, as for a pump but that the flow and speed are negative, opposite
to that for a pump under normal operation (Zone A).
Subsequent to the tripout or load rejection of a hydraulic turbine or the continual operation of a machine that failed earlier as a pump, Zone F (energy dissipation) can be
encountered. The difference between Zones F and G is that the torque has changed sign
for Zone F, resulting in a braking effect, which tends to slow the free-wheeling machine
down. In fact the real runaway condition is attained at the boundary of the two zones, for
which torque T=O.
Quadrant II. The two remaining zones-D and E-are very unusual and infrequently
encountered in operation, with the exception of pump/turbines entering Zone E during
transient operation. Again it should be emphasized that both zones can be experienced by
a pump in a test loop, or in practice in the event a machine is inadvertently rotated in the
wrong direction by improper wiring of an electric motor. Zone D is a purely dissipative
mode that normally would not occur in practice unless a pump, which was designed to
increase the flow from a higher to lower reservoir, was rotated in reverse, but did not have
the capacity to reverse the flow (Zone E, mixed or axial flow), resulting in Q > O, Af < O,
T < O, for H < O. Zone E, for which the pump efficiency > O, could occur in practice
under steady flow if the preferred rotation as a pump was reversed. There
is always the
question regarding the eventual direction of the flow. A radial-flow machine will produce
positive flow at a much reduced capacity and efficiency compared to Af > O (normal
pumping), yielding of course H > O. On the other hand, mixed and axial-flow machines
create flow in the opposite direction (Quadrant III), and H < O, which corresponds still to
an increase in head across the machine in the direction of flow.
6.4.4 Representation of Pump Data for Numerical
Analysis
It is conventional in transient analyses to represent h/a2 and p/a2 as functions of v/a, as
shown in Fig. 6.7 and 6.8 for a radial-flow pump. The curves on Fig. 6.7 are only for positive rotation (a > O), and constitute pump Zones A, B, and C for v > O and the region of
energy dissipation subsequent to pump power failure (Zone H), for which v < O. The
remainder of the pump characteristics are plotted in Fig. 6.8 for a < O. The complete
characteristics of the pump plotted in Figs. 6.7 and 6.8 can also be correlated on what is
known as a Karman-Knapp circle diagram, a plot of lines of constant head (h) and torque
(P) on the coordinates of dimensionless flow (v) and speed (a). Fig. 6.9 is such a correlation for the same pump. The complete characteristics of the pump require six curves, three
each for head and torque. For example, the h/a2 curves from Figs. 6.7 and 6.8 can be represented by continuous lines for h = 1 and h = — 1, and two straight lines through the origin for h = O. A similar pattern exists for the torque (P) lines. In addition to the eight
zones A-H illustrated in Fig. 6.6, the four Karman-Knapp quadrants in terms of v and, are
well defined. Radial lines in Fig. 6.9 correspond to constant values for v/a in Figs. 6.7 and
6.8, allowing for relatively easy transformation from one form of presentation to the other.
In computer analysis of pump transients, Figs. 6.7 and 6.8, while meaningful from the
standpoint of physical understanding, are fraught with the difficulty of Iv/al becoming
Homologous HHd uid Torqua Charactaristka for Radial-Flow Pump
(ft, - 0.465 in Universal Units)forPostiva Rotation (a>o)
FIGURE 6.7 Complete head and torque characteristics of a radial-flow pump
for positive rotation. (From Martin, 1983).
Homologous Hud and Torqiw Characttrtaia for RadW-Flow Pump
(Sl9 - 0.465 in Untonal UnH*) for Nagriw Rotation (a
pump for negative rotation. (From Martin, 1983).
infinite as the unit passes through, or remains at, zero speed (a = O). Some have solved
that problem by switching from h/a2 versus v/a to h/v2 versus a/v, and likewise for p, for
Iv/al > 1. This technique doubles the number of curves on Figs. 6.7 and 6.8, and thereby
creates discontinuities in the slopes of the lines at Iv/al = 1, in addition to complicating
the storing and interpolation of data. Marchal et al. (1965) devised a useful transformation
which allowed the complete pump characteristics to be represented by two single curves,
as shown for the same pump in Fig. 6.10. The difficulty of v/a becoming infinite was eliminated by utilizing the function tair1 (v/a) as the abscissa. The eight zones, or four quadrants can then be connected by the continuous functions. Although some of the physical
interpretation of pump data has been lost in the transformation, Fig. 6.10 is now a preferred correlation for transient analysis using a digital computer because of function continuity and ease of numerical interpolation. The singularities in Figs. 6.7 and 6.8 and the
asymptotes in Fig. 6.9 have now been avoided.
6.4.5 Critical Data Required for Hydraulic Analysis
of Systems with Pumps
Regarding data from manufacturers such as pump curves (normal and abnormal), pump and
motor inertia, motor torque-speed curves, and valve curves, probably the
most critical for
Dimensionless Flow
KARMXMM-KNAPP
QUADRANT
I
Dimensionless Speed « - NTNx
Karman-Knapp Circto Diagram for Radial-Flow Pump <«, « 0.465 in Univmal Units)
FIGURE 6.9 Complete four-quadrant head and torque characteristics of
radial-flow pump. (From Martin, 1983).
Zone
Karman - Knapp
Quadrant
FIGURE 6.10 Complete head and torque characteristics of a radial-flow
pump in Suter diagram. (From Martin, 1983).
pumping stations are pump-motor inertia and valve closure time. Normal pump curves are
usually available and adequate. Motor torque-speed curves are only needed when evaluating
pump startup. For pump trip the inertia of the combined pump and motor is important.
6.5
SURGE PROTECTION AND SURGE CONTROL DEVICES
There are numerous techniques for controlling transients and waterhammer, some
involving design considerations and others the consideration of surge protection
devices. There must be a complete design and operational strategy devised to combat
potential waterhammer in a system. The transient event may either initiate a low-pressure event (downsurge) as in the case of a pump power failure, or a high pressure event
(upsurge) caused by the closure of a downstream valve. It is well known that a downsurge can lead to the undesirable occurrence of water-column separation, which itself
can result in severe pressure rises following the collapse of a vapor cavity. In some systems negative pressures are not even allowed because of (1) possible pipe collapse or
(2) ingress of outside water or air.
The means of controlling the transient will in general vary, depending upon whether
the initiating event results in an upsurge or downsurge. For pumping plants the major
cause of unwanted transients is typically the complete outage of pumps due to loss of electricity to the motor. For full pipelines, pump startup, usually against a closed pump discharge valve for centrifugal pumps, does not normally result in significant pressure transients. The majority of transient problems in pumping installations are associated with the
potential (or realized) occurrence of water-column separation and vapor-pocket collapse,
resulting from the tripout of one or more pumps, with or without valve action. The pumpdischarge valve, if actuated too suddenly, can even aggravate the downsurge problem. To
combat the downsurge problem there are a number of options, mostly involving the design
and installation of one or more surge protection devices. In this section various surge protection techniques will be discussed, followed by an assessment of the virtue of each with
respect to pumping systems in general. The lift systems shown in Fig. 6.11 depict various
surge protection schemes.
6.5.1 Critical Parameters for Transients
Before discussing surge protection devices, some comments will be made regarding the
various pipeline, pump and motor, control valve, flow rate, and other parameters that
affect the magnitude of the transient. For a pumping system the four main parameters are
(1) pump flow rate, (2) pump and motor WR2, (3) any valve motion, and (4) pipeline characteristics. The pipeline characteristics include piping layout-both plan and profile-pipe
size and material, and the acoustic velocity. So-called short systems respond differently
than long systems. Likewise, valve motion and its effect, whether controlled valves or
check valves, will have different effects on the two types of systems.
The pipeline characteristics-item number (4)-relate to the response of the system to a
transient such as pump power failure. Clearly, the response will be altered by the addition
of one or more surge protection device or the change of (1) the flow rate, or (2) the WR2,
or (3) the valve motion. Obviously, for a given pipe network and flow distribution there
are limited means of controlling transients by (2) WR2 and (3) valve actuation. If these two
parameters can not alleviate the problem than the pipeline response needs to be altered by
means of surge protection devices.
Steady-State HGL
Compressed Gas
Air Chamber
Steady-State HGL
Simple Surge Tank
Steady-State HGL
Surge Relief Valve or
Surge Anticipator
Dump
Steady-State HGL
One-Way Surge Tank
FIGURE 6.11
Schematic of various surge protection devices for pumping installations.
Check
valve
Orifice
Simple
Simple
One-Way
Check Valve
Check
valve
Orifice
Air Chamber
FIGURE 6.12
Accumulator
Vacuum Breaker
Cross-sectional view of surge tanks and gas related surge protection devices.
6.5.2 Critique of Surge Protection
For pumping systems, downsurge problems have been solved by various combinations of
the procedures and devices mentioned above. Details of typical surge protection devices
are illustrated in Figs. 6.12 and 6.13. In many instances local conditions and preferences
of engineers have dictated the choice of methods and/or devices. Online devices such as
accumulators and simple surge tanks are quite effective, albeit expensive, solutions. Oneway surge tanks can also be effective when judiciously sized and sited. Surge anticipation
valves should not be used when there is already a negative pressure problem. Indeed, there
are installations where surge anticipation functions of such valves have been deactivated,
leaving only the surge relief feature. Moreover, there have been occasions for which the
surge anticipation feature aggravated the low pressure situation by an additional downsurge caused by premature opening of the valve.
Regarding the consideration and ultimate choice of surge protection devices,
subsequent to calibration of analysis with test results, evaluation should be given to simple surge tanks or standpipes, one-way surge tanks, and hydropneumatic tanks or air
chambers. A combination of devices may prove to be the most desirable and most
economical.
The admittance of air into a piping system can be effective, but the design of air vacuum-valve location and size is critical. If air may be permitted into pipelines careful
analysis would have to be done to ensure effective results. The consideration of air-vacuum breakers is a moot point if specifications such as the Ten State Standards limit the pressures to positive values.
a Vacuum Breaker Valve
a Air Release Valve
c. Surge Relief or Surge Anticipator Valve
FIGURE 6.13
Cross sections of vacuum breaker, air release and surge relief valves.
6.5.3
Surge Protection Control and Devices
Pump discharge valve operation. In gravity systems the upsurge transient can be controlled by an optimum valve closure-perhaps two stage, as mentioned by Wylie and
Streeter (1993). As shown by Fleming (1990), an optimized closing can solve a waterhammer problem caused by pump power failure if coupled with the selection of a surge
protection device. For pump power failure a control valve on the pump discharge can often
be of only limited value in controlling the downsurge, as mentioned by Sanks (1989).
Indeed, the valve closure can be too sudden, aggravating the downsurge and potentially
causing column separation, or too slow, allowing a substantial reverse flow through the
pump. It should also be emphasized that an optimum controlled motion for single-pump
power failure is most likely not optimum for multiple-pump failure. The use of microprocessors and servomechanisms with feedback systems can be a general solution to optimum control of valves in conjunction with the pump and pipe system. For pump discharge
valves the closure should not be too quick to exacerbate downsurge, nor too slow to create a substantial flow back through the valve and pump before closure.
Check valves. Swing check valves or other designs are frequently employed in pump
discharge lines, often in conjunction with slow acting control valves. As indicated by
Tullis (1989), a check valve should open easily, have a low head loss for normal positive
flow, and create no undesirable transients by its own action. For short systems, a slowresponding check valve can lead to waterhammer because of the high reverse flow generated before closure. A spring-or counterweight-loaded valve with a dashpot can (1) give
the initial fast response followed by (2) slow closure to alleviate the unwanted transient.
The proper selection of the load and the degree of damping is important, however, for
proper performance.
Check valve slam is also a possibility from stoppage or failure of one pump of several in
a parallel system, or resulting from the action of an air chamber close to a pump undergoing
power failure. Check valve slam can be reduced by the proper selection of a dashpot.
Surge anticipator valves and surge relief valves. A surge anticipation valve, Fig. 6.13c
frequently installed at the manifold of the pump station, is designed to open initially
under (1) pump power failure, or (2) the sensing of underpressure, or (3) the sensing of
overpressure, as described by Lescovitch (1967). On the other hand, the usual type of
surge relief valve opens quickly on sensing an overpressure, then closes slowly, as controlled by pilot valves. The surge anticipation valve is more complicated than a surge
relief valve in that it not only embodies the relief function at the end of the cycle, but also
has the element of anticipation. For systems for which water-column separation will not
occur, the surge anticipation valve can solve the problem of upsurge at the pump due to
reverse flow or wave reflection, as reported in an example by White (1942). An example
of a surge relief valve only is provided by Weaver (1972). For systems for which watercolumn separation will not occur, Lundgren (1961) provides charts for simple pipeline
systems.
As reported by Parmakian (1968,1982a-b) surge anticipation valves can exacerbate the
downsurge problem inasmuch as the opening of the relief valve aggravates the negative
pressure problem. Incidents have occurred involving the malfunctioning of a surge anticipation valve, leading to extreme pressures because the relief valve did not open.
Pump bypass. In shorter low-head systems a pump bypass line (Fig. 6.11) can be
installed in order to allow water to be drawn into the pump discharge line
following power
failure and a downsurge. As explained by Wylie and Streeter (1993), there are two possi-
ble bypass configurations. The first involves a control valve on the discharge line and a
check valve on the bypass line between the pump suction or wet well and the main line.
The check valve is designed to open subsequent to the downsurge, possibly alleviating
column separation down the main line. The second geometry would reverse the valve
locations, having a control valve in the bypass and a check valve in the main line downstream of the pump. The control valve would open on power failure, again allowing water
to bypass the pump into the main line.
Open (simple) surge tank. A simple on-line surge tank or standpipe (Fig. 6.11) can
be an excellent solution to both upsurge and downsurge problems, These devices are
quite common in hydroelectric systems where suitable topography usually exists. They
are practically maintenance free, available for immediate response as they are on line.
For pumping installations open simple surge tanks are rare because of height considerations and the absence of high points near most pumping stations. As mentioned by
Parmakian (1968) simple surge tanks are the most dependable of all surge protection
devices. One disadvantage is the additional height to allow for pump shutoff head.
Overflowing and spilling must be considered, as well as the inclusion of some damping
to reduce oscillations. As stated by Kroon et al. (1984) the major drawback to simple
surge tanks is their capital expense.
One-way surge tank. The purpose of a one-way surge tank is to prevent initial low pressures and potential water-column separation by admitting water into the pipeline subsequent to a downsurge. The tank is normally isolated from the pipeline by one or more lateral pipes in which there are one or more check valves to allow flow into the pipe if the
HGL is lower in the pipe than the elevation of the water in the open tank. Under normal
operating conditions the higher pressure in the pipeline keeps the check valve closed. The
major advantage of a one-way surge tank over a simple surge tank is that it does not have
to be at the HGL elevation as required by the latter. It has the disadvantage, however, on
only combatting initial downsurges, and not initial upsurges. One-way surge tanks have
been employed extensively by the U.S. Bureau of Reclamation in pump discharge lines,
principally by the instigation of Parmakian (1968), the originator of the concept. Another
example of the effective application of one-way surge tanks in a pumping system was
reported by Martin (1992), to be discussed in Sec. 6.9.1.
Considerations for design are: (1) location of high points or knees of the piping, (2)
check valve and lateral piping redundancy, (3) float control refilling valves and water supply, and other appurtenances. Maintenance is critical to ensure the operation of the check
valve(s) and tank when needed.
Air chamber (hydropneumatic surge tank). If properly designed and maintained, an
air chamber can alleviate both negative and positive pressure problems in pumping systems. They are normally located within or near the pumping station where they would
have the greatest effect. As stated by Fox (1977) and others, an air chamber solution may
be extremely effective in solving the transient problem, but highly expensive. Air chambers have the advantage that the tank-sometimes multiple-can be mounted either vertically or horizontally. The principal criteria are available water volume and air volume for
the task at hand.
For design, consideration must be given to compressed air supply, water level sensing,
sight glass, drains, pressure regulators, and possible freezing. Frequently, a check valve is
installed between the pump and the air chamber. Since the line length between the pump
and air chamber is usually quite short, check valve slamming may occur, necessitating the
consideration of a dashpot on the check valve to cushion closure.
The assurance of the maintenance of air in the tank is essential-usually 50 percent of
tank volume, otherwise the air chamber can be ineffective. An incident occurred at a raw
water pumping plant where an air chamber became waterlogged due to the malfunctioning of the compressed air system. Unfortunately, pump power failure occurred at the same
time, causing water column separation and waterhammer, leading to pipe rupture.
Air vacuum and air release valves. Another method for preventing subatmospheric
pressures and vapor cavity formation is the admittance of air from air-vacuum valves
(vacuum breakers) at selected points along the piping system. Proper location and size
of air-vacuum valves can prevent water-column separation and reduce waterhammer
effects, as calculated and measured by Martin (1980). The sizing and location of the
valves are critical, as stated by Kroon et al. (1984). In fact, as reported by Parmakian
(1982a,-b) the inclusion of air-vacuum valves in a pipeline did not eliminate failures.
Unless the air-vacuum system is properly chosen, substantial pressures can still occur
due to the compression of the air during resurge, especially if the air is at extremely low
pressures within the pipeline when admitted. Moreover, the air must be admitted quickly enough to be effective. Typical designs are shown in Fig. 6.13
As shown by Fleming (1990) vacuum breakers can be a viable solution. The advantage
of an air-vacuum breaker system, which is typically less expensive than other measures
such as air chambers, must be weighed against the disadvantages of air accumulation
along the pipeline and its subsequent removal. Maintenance and operation of valves is
critical in order for assurance of valve opening when needed. Air removal is often accomplished with a combined air-release air-vacuum valve. For finished water systems the
admittance of air is not a normal solution and must be evaluated carefully. Moreover, air
must be carefully released so that no additional transient is created.
Flywheel Theoretically, a substantial increase in the rotating inertia (WR2) of a pumpmotor unit can greatly reduce the downsurge inasmuch as the machine will not decelerate
as rapidly. Typically, the motor may constitute from 75 to 90 percent of the total WR2.
Additional WR2 by the attachment of a flywheel will reduce the downsurge. As stated by
Parmakian (1968), a 100 percent increase in WR2 by the addition of a flywheel may add
up to 20 percent to the motor cost. He further states that a flywheel solution is only economical in some marginal cases. Flywheels are usually an expensive solution, mainly useful only for short systems. A flywheel has the advantage of practically no maintenance,
but the increased torque requirements for starting must be considered.
Uninterrupted power supply (UPS). The availability of large uninterrupted power supply systems are of potential value in preventing the primary source of waterhammer in
pumping; that is, the generation of low pressures due to pump power failure. For pumping stations with multiple parallel pumps, a UPS system could be devised to maintain one
or more motors while allowing the rest to fail, inasmuch as there is a possibility of maintaining sufficient pressure with the remaining operating pump(s). The solution usually
is expensive, however, with few systems installed.
6.6
DESIGN CONSIDERATIONS
Any surge or hydraulic transient analysis is subject to inaccuracies due to incomplete
information regarding the systems and its components. This is particularly true for a water
distribution system with its complexity, presence of pumps, valves, tanks, and so forth,
and some uncertainty with respect to initial flow distribution. The ultimate question is how
all of the uncertainties combine in the analysis to yield the final solution. There will be
offsetting effects and a variation in accuracy in terms of percentage error throughout the
system. Some of the uncertainties are as follows.
The simplification of a pipe system, in particular a complex network, by the exclusion
of pipes below a certain size and the generation of equivalent pipes surely introduces some
error, as well as the accuracy of the steady-state solution. However, if the major flow rates
are reasonably well known, then deviation for the smaller pipes is probably not too critical. As mentioned above incomplete pump characteristics, especially during reverse flow
and reverse rotation, introduce calculation errors. Valve characteristics that must be
assumed rather than actual are sources of errors, in particular the response of swing check
valves and pressure reducing valves. The analysis is enhanced if the response of valves
and pumps from recordings can be put in the computer model.
For complex pipe network systems it is difficult to assess uncertainties until much of
the available information is known. Under more ideal conditions that occur with simpler
systems and laboratory experiments, one can expect accuracies when compared to measurement on the order of 5 to 10 percent, sometimes even better. The element of judgment
does enter into accuracy. Indeed, two analyses could even differ by this range because of
different assumptions with respect to wave speeds, pump characteristics, valve motions,
system schematization, and so forth. It is possible to have good analysis and poorer analysis, depending upon experience and expertise of the user of the computer code. This element is quite critical in hydraulic transients. Indeed, there can be quite different results
using the same code.
Computer codes, which are normally based on the method of characteristics (MOC),
are invaluable tools for assessing the response based of systems to changes in surge protection devices and their characteristics. Obviously, the efficacy of such an approach is
enhanced if the input data and network schematization is improved via calibration.
Computer codes have the advantage of investigating a number of options as well as optimizing the sizing of surge protection devices. The ability to calibrate a numerical analysis code to a system certainly improves the determination of the proper surge protection.
Otherwise, if the code does not reasonably well represent a system, surge protection
devices can either be inappropriate or under- or oversized.
Computer codes that do not properly model the formation of vapor pockets and subsequent collapse can cause considerable errors. Moreover, there is also uncertainty regarding any free or evolved gas coming out of solution. The effect on wave speed is known,
but this influence can not be easily addressed in an analysis of the system. It is simply
another possible uncertainty.
Even for complicated systems such as water distribution networks, hydraulic transient calculations can yield reasonable results when compared to actual measurements
provided that the entire system can be properly characterized. In addition to the pump,
motor, and valve characteristics there has to be sufficient knowledge regarding the piping and flow demands. An especially critical factor for a network is the schematization
of the network; that is, how is a network of thousands of pipes simplified to one suitable for computer analysis, say hundreds of pipes, some actual and some equivalent.
According to Thorley (1991), a network with loops tends to be more forgiving regarding waterhammer because of the dispersive effect of many pipes and the associated
reflections. On the other hand, Karney and Mclnnis (1990) show by a simple example
that wave superposition can cause amplification of transients. Since water distribution
networks themselves have not been known to be prone to waterhammer as a rule, there
is meager information as to simplification and means of establishing equivalent pipes