An analysis of bioaerosol emissions from orthopaedic surgical clothing
Bạn đang xem bản rút gọn của tài liệu. Xem và tải ngay bản đầy đủ của tài liệu tại đây (1018.84 KB, 68 trang )
AN ANALYSIS OF BIOAEROSOL
EMISSIONS FROM ORTHOPAEDIC
SURGICAL CLOTHING
Dr Praveen Vijaysegaran
MBBS/B Med Sci (University of Melbourne)
Orthopaedic Registrar, Royal Australasian College of Surgeons
Submitted in fulfilment of the requirements for the degree of
Master of Applied Science
Institute of Health and Biomedical Innovation
Queensland University of Technology
2016
An Analysis of Bioaerosol Emissions From Orthopaedic Surgical Clothing
0
Keywords
Orthopaedics, space suit, clean air, arthroplasty, prosthetic joint infection
An Analysis of Bioaerosol Emissions From Orthopaedic Surgical Clothing
1
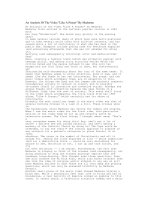
Abstract
Introduction: The role of space suits in the prevention of orthopaedic prosthetic joint
infection remains unclear. Recent evidence suggests space suits may in fact contribute to
increased infection rates, with bioaerosol emissions from space suits identified as a potential
cause. This study aimed to compare the particle and microbiological emission rates from
space suits and standard surgical clothing.
Methods: A comparison of emission rates between space suits and standard surgical clothing
was performed in a simulated surgical environment during five separate experiments. Particle
counts were analysed with two separate particle counters capable of detecting particles
between 0.1 and 20 µm. One microbiological sampler was used, with culture counts
performed at 24 and 48 hours.
Results: Four experiments consistently showed statistically significant increases in both
particle and microbiological emission rates when space suits are used compared with standard
surgical clothing. One experiment showed inconsistent results, with a trend towards increases
in both particle and microbiological emission rates when space suits are used compared with
standard surgical clothing.
Conclusion: Space suits cause increased particle and microbiological emission rates
compared with standard surgical clothing. This finding provides mechanistic evidence to
support the increased prosthetic joint infection rates observed in epidemiological studies.
An Analysis of Bioaerosol Emissions From Orthopaedic Surgical Clothing
2
Table of Contents
Keywords .............................................................................................................................. 1
Abstract ................................................................................................................................ 2
Table of Contents ................................................................ Error! Bookmark not defined.3
List of Figures ....................................................................................................................... 5
List of Tables ...................................................................... Error! Bookmark not defined.6
List of Abbreviations............................................................................................................. 7
Statement of Original Authorship .......................................................................................... 8
Acknowledgements ............................................................... Error! Bookmark not defined.
Chapter 1: Introduction and Literature Review .............................................................. 10
1.1
Total hip and knee joint arthroplasty .......................................................................... 10
1.2
Prosthetic joint infection ............................................................................................ 11
1.3
The clean air hypothesis ............................................................................................. 13
1.4
Causes of increased infection rates ............................................................................. 17
1.5
Hypothesis and aim .................................................................................................... 18
Chapter 2: Research Design .................................................... Error! Bookmark not defined.
2.1
The simulated surgical environment ........................................................................... 19
2.2
Measurement devices ................................................................................................. 22
2.3
Experiment protocol................................................................................................... 26
2.4
Emission rate analysis ................................................................................................ 30
An Analysis of Bioaerosol Emissions From Orthopaedic Surgical Clothing
3
Chapter 3: Results ............................................................................................................. 31
3.1
Particle emission rates ................................................................................................ 31
3.1.1 Experiment Results ........................................................................................... 32
3.1.1 Statistical comparison ........................................................................................ 35
3.1.2 Combined graphs .............................................................................................. 37
3.2
Microbiological emission rates ................................................................................... 40
3.1.1 Experiment Results ........................................................................................... 41
3.1.2 Statistical comparison ....................................................................................... 43
3.1.2 Combined graphs .............................................................................................. 45
Chapter 4: Discussion ........................................................................................................ 46
4.1
Increased emission rates ............................................................................................. 46
4.2
Limitations of study ................................................................................................... 49
4.3
The future of space suits ............................................................................................. 52
4.4
Conclusion ................................................................................................................. 54
Chapter 5: References ....................................................................................................... 55
Chapter 6: Appendix ......................................................................................................... 63
An Analysis of Bioaerosol Emissions From Orthopaedic Surgical Clothing
4
List of Figures
Figure 1: Sir John Charnley in a body exhaust suit .............................................................. 14
Figure 2: Spirometry chamber and inlet ............................................................................... 20
Figure 3: HEPA filtered clean air supply ............................................................................. 20
Figure 4: Spirometry chamber and outlet ............................................................................. 21
Figure 5: OPC particle counter ............................................................................................ 23
Figure 6: UVAPS particle counter ....................................................................................... 23
Figure 7: Andersen cascade impactor and pump .................................................................. 24
Figure 8: Space suit clothing equipped ................................................................................ 27
Figure 9: Space suit clothing unequipped ............................................................................ 27
Figure 10: Standard surgical clothing equipped ................................................................... 28
Figure 11: Standard surgical clothing unequipped ............................................................... 28
Figure 12: Mean of UVAPS particle emission rates equipped space suit vs standard .......... 37
Figure 13: Mean of UVAPS particle emission rates unequipped space suit vs standard ....... 37
Figure 14: Mean of OPC All particle emission rates equipped space suit vs standard........... 38
Figure 15: Mean of OPC All particle emission rates unequipped space suit vs standard ....... 38
Figure 16: Mean of OPC Large particle emission rates equipped space suit vs standard ...... 39
Figure 17: Mean of OPC Large particle emission rates unequipped space suit vs
standard
.................................................................................................................. 39
Figure 18: Mean of microbiological emission rates at 24 hours ........................................... 45
Figure 19: Mean of microbiological emission rates at 48 hours (Experiement 1 not read
at 48 hours)
.................................................................................................................. 45
An Analysis of Bioaerosol Emissions From Orthopaedic Surgical Clothing
5
List of Tables
Table 1: A summary of the space suit literature ................................................................... 16
Table 2: Particle emission rates for experiment 1................................................................. 32
Table 3: Particle emission rates for experiment 2................................................................. 32
Table 4: Particle emission rates for experiment 3................................................................. 33
Table 5: Particle emission rates for experiment 4................................................................. 33
Table 6: Particle emission rates for experiment 5................................................................. 34
Table 7: UVAPS particle emission rates equipped space suit vs standard ............................ 35
Table 8: UVAPS particle emission rates unequipped space suit vs standard......................... 35
Table 9: OPC All particle emission rates equipped space suit vs standard ............................ 35
Table 10: OPC All particle emission rates unequipped space suit vs standard ...................... 35
Table 11: OPC Large particle emission rates equipped space suit vs standard ...................... 36
Table 12: OPC Large particle emission rates unequipped space suit vs standard .................. 36
Table 13: Microbioloigcal emission rates for experiment 1.................................................. 41
Table 14: Microbioloigcal emission rates for experiment 2.................................................. 41
Table 15: Microbioloigcal emission rates for experiment 3.................................................. 42
Table 16: Microbioloigcal emission rates for experiment 4.................................................. 42
Table 17: Microbioloigcal emission rates for experiment 5.................................................. 43
Table 18: Microbioloigcal emission rates at 24 hours .......................................................... 44
Table 19: Microbioloigcal emission rates at 48 hours .......................................................... 44
An Analysis of Bioaerosol Emissions From Orthopaedic Surgical Clothing
6
List of Abbreviations
CFU
Colony forming units
ER
Emission rate
HEPA
High-efficiency particulate air
MER
Microbiological emission rate
OPC
Optical particle counter
PER
Particle emission rate
UVAPS
Ultraviolet aerodynamic particle sizer
An Analysis of Bioaerosol Emissions From Orthopaedic Surgical Clothing
7
Statement of Original Authorship
The work contained in this thesis has not been previously submitted to meet
requirements for an award at this or any other higher education institution. To the best of my
knowledge and belief, the thesis contains no material previously published or written by
another person except where due reference is made.
I undertake to retain the original collated data on which this thesis is based for a
minimum of five years, in accordance with University ethics guidelines.
QUT Verified Signature
Signature:
_________________________
August 2016
Date:
_________________________
An Analysis of Bioaerosol Emissions From Orthopaedic Surgical Clothing
8
Acknowledgements
First and foremost, I would like to thank my principal supervisor Professor Ross
Crawford, for all your support and guidance, and for constantly serving as an inspiration. I
would not be where I am today if it was not for you. To Dr Luke Knibbs, thank you for being
so accommodating and always having a solution to all my problems. You have been my go-to
guy over the last few years. Professor Lidia Morawska, thank you for this opportunity and
your encouragement.
To all my family and friends who have supported me throughout, particularly my
parents and in particular my father Vijaysegaran Shanmugam who spent many long hours
experimenting with me, thank you. Almost everything I do is for you, and to make you proud.
Kathleen Capehart and Navina Vijaysegaran, thank you for getting me over the finish line
and all your help with editing.
I would also like to express my gratitude to all my other colleagues at QUT and
elsewhere who have helped over the last few years. Dr Sarah Whitehouse, Dr Graham
Johnson, Dr Timothy Kidd, Chantal Labbe and Monica Warzywoda, this research would not
be possible without your help.
And to everyone else who played a role, however trivial or insignificant, your efforts
have been much appreciated.
An Analysis of Bioaerosol Emissions From Orthopaedic Surgical Clothing
9
Chapter 1: Introduction and Literature Review
1.1 Total hip and knee joint arthroplasty
Hip and knee osteoarthritis are causes of significant pain and disability1. Multiple
treatment modalities exist for these conditions with total joint arthroplasty often being the
final option2, 3. Total joint arthroplasty is one of the most successful commonly performed
orthopaedic procedures and an effective method of alleviating symptoms associated with hip
and knee osteoarthritis3. In 2013, 43,826 primary total knee replacements and 29,080 primary
total hip replacements were performed in Australia4. This demand is only expected to grow
with an ageing population, with projections estimating the demand for primary total hip
replacements and total knee replacements to grow by 174% and 673%, respectively, from
2005 to 20305.
Multiple studies have shown excellent short- and long-term satisfaction rates after
total hip and total knee replacement. Satisfaction rates in the early postoperative period
(between three months to two years) of more than 90% have been reported while longer term
follow-up of more than 15 years has reported satisfaction rates up to 96%6-9. Despite the
success of total joint replacement, multiple associated risks exist. These include bleeding,
thromboembolic events, prosthetic joint infection, aseptic loosening and periprosthetic
fracture which often necessitate further surgery and can sometimes result in death.
An Analysis of Bioaerosol Emissions From Orthopaedic Surgical Clothing
10
1.2 Prosthetic Joint Infection
Prosthetic joint infection is a particularly concerning complication of total hip and
knee replacement, with reports of mortality following prosthetic joint infection ranging from
2.5 to 8%10, 11. In 2014, The Australian National Joint Registry listed infection as the second
most common cause of revision for primary total knee replacements with 3,038 cases
reported in 2013, and the fourth most common cause of revision for primary hip replacements
with 1,534 reported cases in 20134.
Prosthetic joint infection is also associated with a substantial economic cost. The
literature estimates that the average cost of uncomplicated primary total hip replacements and
total knee replacements is roughly USD $30,000 and $25,000, respectively. The cost of total
hip prosthetic joint infection increased from USD $73,000 to USD $94,000 over the decade,
whereas the cost of total knee prosthetic joint infection rose from between USD $59,000 to
USD $75,000 over the same period12-15. From 2001 to 2009 the annual cost of revisions due
to infection in the United States increased from USD $320 million to USD $566 million, and
is projected to exceed USD $1.62 billion by 202013.
Important predisposing factors for modern prosthetic joint infection can be divided
into patient preoperative factors, surgical factors and postoperative factors. Patient
preoperative factors include a higher body mass index, a history of rheumatoid arthritis,
anaemia, venous thromboembolism or dementia as well as an American Society of
Anaesthesiologists grading of more than two. Surgical factors include total knee arthroplasty,
a longer operative time or inpatient stay and simultaneous bilateral procedures. Postoperative
factors include allogenic blood transfusion, myocardial infarction, atrial fibrillation, urinary
tract infection, wound drainage and haematoma formation15.
An Analysis of Bioaerosol Emissions From Orthopaedic Surgical Clothing
11
Clinically, pain is the single most frequent symptom of prosthetic joint infection and
is often exacerbated by motion. Local warmth, tenderness, wound drainage, and joint
effusions are also helpful in diagnosing infection. A normal erythrocyte sedimentation rate,
along with a normal C-reactive protein level, would suggest a very low risk of infection. The
most frequently recovered isolates are Staphylococcus aureus and Staphylococcus
epidermidis in prosthetic joint infections, while gram-negative bacilli are also known to
contribute11.
Treatment is generally guided by the chronicity and severity of infection. Options
include washout and debridement procedures versus single or two staged revision procedures
with appropriate antibiotic administration. Generally, two-stage revision is superior to singlestage revision or to debridement with prosthesis retention. Long-term antibiotic suppression
and/or arthrodesis are useful for patients too frail to undergo extensive surgery11.
Current rates of prosthetic joint infection have been estimated to be anywhere
between 2.0% to 2.4% over an eight year period in the USA15. Yearly postoperative infection
rates have been estimated at approximately of 0.7%16. This is a significant improvement
compared to early arthroplasty series in the 1960s that described rates as high as 10%17. This
reduction in infection rates has been attributed to a number of measures that were introduced
at the time, including the use of prophylactic antibiotics and the formulation of the clean air
hypothesis17-19.
An Analysis of Bioaerosol Emissions From Orthopaedic Surgical Clothing
12
1.3 The clean air hypothesis
The clean air hypothesis suggested that the prosthetic joint might constitute a system
uniquely sensitive to infection by a very small bacterial inoculum, and that this inoculum
might be derived from airborne particles18. A multifaceted approach involving both refined
room air ventilation systems incorporating laminar flow and modified surgical clothing
consisting of body exhaust suits were introduced in an effort to reduce infection rates17, 18.
These body exhaust suits (Figure 1) incorporated both inlet and outlet tubing, which was
designed to extract potentially infectious bioaerosols produced by the surgeon and theatre
staff away from the surgical field. Studies performed subsequently in the 1960s showed a
very strong prima facie case for the value of clean air systems, but they were not statistically
robust and the conclusion that clean air was responsible for the improvement in infection
rates was strongly challenged20. By the 1970s there was still no consensus on the clinical
value of either the clean air hypothesis or the use of prophylactic antibiotics in joint
replacement surgery21.
This uncertainty led to a large prospective multicentre study of sepsis after total hip or
knee replacement. The study was conducted by the Medical Research Council in Europe from
1974 to 1979 and was based on records from over 8,000 total joint replacements21, 22. The
study’s results, reported by Lidwell in 1982, found the use of body exhaust suits led to a
statistically and clinically significant reduction in infection rates from 1.5% to 0.6% and led
to their widespread use. The study also showed a correlation between bacterial air counts and
rates of periprosthetic sepsis, which has also been shown in subsequent studies23, 24.
An Analysis of Bioaerosol Emissions From Orthopaedic Surgical Clothing
13
Multiple clinical and non-clinical studies on the impact of various forms of surgical
clothing and the use of body exhaust suits have since been published. Both have used air and
wound bacterial counts as surrogate markers for infection, as the number of samples or
participants required in a study of statistical significance with the current low prosthetic joint
infection rates would be in the thousands and logistically very difficult25-39. The use of air
particle counts as a surrogate marker for bacterial contamination in operating theatres, and
thus infection rates, has also been validated40-42.
Since Lidwell’s landmark trial, other studies assessing various forms of clothing with
particular reference to body exhaust suits and the clear air hypothesis have shown benefits
with the use of body exhaust suits. A non-clinical study published in 1975 assessed the effect
of body exhaust suits in a simulated surgical environment and found a significant reduction
(up to tenfold) in bacterial dispersion when body exhaust suits were used29. A clinical study
published in 1983 showed a reduction in airborne bacteria and bacteria cultured from
adhesive surgical drapes when body exhaust suits were used during total hip arthroplasty,
supporting the use of these suits30. More recent studies conducted in the last decade have
similarly supported the use of body exhaust suits31, 32, 37.
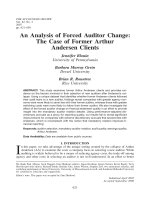
Figure 1 – Sir John Charnley in a body exhaust suit
An Analysis of Bioaerosol Emissions From Orthopaedic Surgical Clothing
14
Body exhaust suits were designed with both air inlet and outlet tubing to create
negative pressure inside the gown, ensuring any shed particles are extracted via the outlet
tube and released in a controlled manner away from the surgical field, preventing any
contamination. However, such tubing is cumbersome, which led to the development of more
portable ‘space suit’ systems such as the T4 Steri-Shield (Stryker Instruments, Kalamazoo,
MI, USA), the Provision Surgical Helmet (DePuy, Warsaw, IN, USA), and Stackhouse
FreedomAire (Stackhouse Incorporated, Palm Springs, CA, USA). Space suit systems have
an intake valve on the helmet itself, which draws air in from outside using the hood material
as a filter. The air is then blown down across the surgeon’s face and neck, creating positive
pressure inside the surgeon’s gown and potentially expelling contaminated particles onto the
surgical field25. With the added benefit of being splash resistant and serving as a form of selfprotection for the surgeon, space suits have now become the most common form of clean air
clothing systems used43.
In contrast to the proven effectiveness of body exhaust suits, the impact of space suits
on infection rates remains unclear. Only one study has shown any benefit; a recent analysis of
air bacterial colony forming unit (CFU) counts of twelve simulated hip arthroplasty
operations using the Stryker T4 hood/helmet versus a normal gown, which found a five-fold
increase with normal gown use32. Most of the other literature which comprises both clinical
and non-clinical studies has shown no significant reduction in particle and bacteria counts,
reflecting other findings showing no difference in infection rates when space suits are used
compared to conventional surgical clothing34, 36-38.
An Analysis of Bioaerosol Emissions From Orthopaedic Surgical Clothing
15
Recent reports based on nationwide registry data looking at infection rates specifically
rather than surrogate markers such as particle or bacterial counts have shown a potentially
harmful effect of space suits. A large registry study from New Zealand in 2011 analysed
more than 51,000 total hip replacements and 36,000 total knee replacements. This study,
although not a randomized control trial, found a significant increase in the rates of early
revision for deep infection for those procedures performed with the use of a space suit when
compared with those without (0.186% vs. 0.064%). Additionally, there were 23 surgeons
who performed at least 50 total knee replacements both with and without a space suit. There
was almost a tenfold increase in the rate of early revision because of deep infection in those
who used a space suit (0.251% compared with 0.028%)44. These findings were particularly
compelling because of the large sample size, specific focus on infection rates, and ability to
account for the surgeons’ experience. A summary of the key findings and other pertinent
literature is presented in Table 1 below25.
Table 1 – A summary of the space suit literature25
An Analysis of Bioaerosol Emissions From Orthopaedic Surgical Clothing
16
1.4 Causes of increased infection rates
Various hypotheses have been put forward to explain these increased rates, including
decreased spatial awareness, which makes it easier to contaminate oneself, and the exhaust
emissions of space suits. Surgeons surveyed in the 2011 New Zealand registry study agreed
with the spatial awareness issue. Studies have also shown that these suits regularly become
contaminated with bacteria capable of causing prosthetic joint infections during the course of
surgery and routine contact with all parts of the suit including headgear should be avoided27,
28
. Recent studies looking at the gown/glove interface have shown that it is prone to particle
contamination and may serve as a route for particles on the surgeons hand to escape onto the
surgical field 25, 26.
Despite these numerous hypotheses and the strong epidemiological evidence linking
space suits and infection, to date no studies have compared particle or microbiological
emission rates between space suits and standard surgical clothing as a potential mechanism to
explain the increased rates of infection recently reported.
An Analysis of Bioaerosol Emissions From Orthopaedic Surgical Clothing
17
1.5 Hypothesis and Aim
This study aimed to assess the emissions of space suits and standard surgical clothing
in a laboratory based setting by creating a simulated surgical environment. The null
hypothesis tested was that there is no difference in particle or microbiological emission rates
between space suits and standard surgical clothing.
An Analysis of Bioaerosol Emissions From Orthopaedic Surgical Clothing
18
Chapter 2: Materials and Methods
2.1 The simulated surgical environment
This study was conducted in a laboratory-based setting at the Prince Charles Hospital,
Chermside, Australia and Queensland University of Technology, Brisbane, Australia between
September 2011 and January 2015. Data was collected prospectively in a simulated surgical
environment, designed to replicate actual operating theatre conditions and custom-built for
the investigation of particle sources during five separate experiments.
The simulated surgical environment consisted of an airtight spirometry chamber with
dimensions measuring 2.1 x 0.9 x 0.85 m. The internal volume of the chamber measured 1.6
m3. A circular inlet measuring 17 cm in diameter was cut in the roof of the chamber (Figure
2). The inlet was connected to a high efficiency particulate air (HEPA) filtered air supply
from a large filter bank and fan unit via aluminium tubing measuring 15cm in diameter
(Figure 3). HEPA filtered clean air was thus introduced into the chamber constantly to ensure
there was no confounding influences from ambient room air, and that activities in the
chamber were the only source of particles and bacteria. The quality of the air was verified by
checking that there was a zero particle count prior to each experiment using two optical
particle counters (Chapter 2.2). The chamber operated at a slightly higher air pressure than
the surrounding room to prevent ingress of room air. This was verified using tracer smoke. A
circular outlet measuring 16cm in diameter was cut at a low point on the front wall of the
chamber 10cm above the floor (Figure 4). Electrically conductive rubber tubing measuring
4mm in diameter was attached at this outlet, and attached to a T-shaped bifurcation that
channelled air towards two separate particle counters. A steel hook was also attached to the
underside of the roof of the chamber to allow suspension of clothing for unequipped clothing
testing.
An Analysis of Bioaerosol Emissions From Orthopaedic Surgical Clothing
19
Figure 2 – Spirometry chamber and inlet.
Figure 3 – HEPA filtered clean air supply.
An Analysis of Bioaerosol Emissions From Orthopaedic Surgical Clothing
20
Figure 4 – Spirometry chamber and outlet
An Analysis of Bioaerosol Emissions From Orthopaedic Surgical Clothing
21
2.2 Measurement Devices
Particle counting was performed with two instruments, the Lasair II 110 optical
particle counter (OPC) (Lasair, Korskildelund, Greve, Denmark) and the TSI 3312A
ultraviolet aerodynamic particle sizer (UVAPS) (TSI, Shoreview, MN, USA) (Figures 5 & 6).
The use of both these counters has been reported in other similar studies analysing air
quality40-42, 45. The instruments were used together to ensure the widest possible range of
particle sizes was captured. The OPC analysed particles between 0.1µm and 5.0µm with
channel sizes (lower boundary) of 0.1µm, 0.2µm, 0.3µm, 0.5µm, 1.0µm and 5.0µm. The
UVAPS analysed particles between 0.5µm and 20 µm. Due to the high levels of noise and
low detection efficiency of channel sizes below 0.523µm and channel sizes above 15µm,
these measurements were excluded. This left channel sizes of 0.542µm, 0.583µm, 0.626µm,
0.673µm, 0.723µm, 0.777µm, 0.835µm, 0.898µm, 0.965µm, 1.037µm, 1.114µm, 1.197µm,
1.286µm, 1.382µm, 1.486µm, 1.596µm, 1.715µm, 1.843µm, 1.981µm, 2.129µm, 2.288µm,
2.458µm, 2.642µm, 2.839µm, 3.051µm, 3.278µm, 3.523µm, 3.786µm, 4.068µm, 4.371µm,
4.698µm, 5.048µm, 5.425µm, 5.829µm, 6.264µm, 6.732µm, 7.234µm, 7.774µm, 8.354µm,
8.977µm, 9.647µm, 10.37µm, 11.14µm, 11.97µm, 12.86µm, 13.82µm and 14.86µm for the
UVAPS. Measurements were made by both particle counters at 10 second intervals.
An Analysis of Bioaerosol Emissions From Orthopaedic Surgical Clothing
22
Figure 5 – OPC particle counter
Figure 6 – UVAPS particle counter
An Analysis of Bioaerosol Emissions From Orthopaedic Surgical Clothing
23
Microbiological analysis was performed in addition to particle counting as differences
in microbiological counts are far more likely to derive from the individual within the surgical
clothing rather than from the sterile surgical clothing itself. To sample air for microbiological
analysis, a Thermo Scientific six-stage viable Andersen cascade impactor (Waltham, MA,
USA) was also placed at the spirometry chamber outlet. The lower cut-point of the six size
channel was 0.6µm, 1.1µm, 2.1µm, 3.3µm, 4.7µm and 7.0 µm. A pump drew 28.3 L/min of
air through the impactor. Air was sampled onto Tryptone soya agar plates on each size stage
(Biomerieux, Marcy-l'Étoile, Lyon, France) which have previously been used in similar
experiments40, 42. Plates were sent immediately for microbiological analysis on the day of the
experiment and incubated for 48 hours at 37°C in air. Colony counts were performed at 24
and 48 hours, except for the first experiment where counts were only performed at 24 hours.
Bacterial subtyping was also done but only for the first experiment. Aspiration (eg sampling)
efficiency calculations were performed for all channel sizes on both the particle counters and
the air sampler (Appendix). These calculations showed lower efficiencies with the larger
particle sizes.
Figure 7 – Andersen cascade impactor and pump
An Analysis of Bioaerosol Emissions From Orthopaedic Surgical Clothing
24