Principles of macroeconomics 10e by case fair oster ch07
Bạn đang xem bản rút gọn của tài liệu. Xem và tải ngay bản đầy đủ của tài liệu tại đây (865.1 KB, 42 trang )
PRINCIPLES OF
MACROECONOMICS
PART II Concepts and Problems in Macroeconomics
TENTH
EDITION
CASE FAIR OSTER
© 2012 Pearson Education, Inc. Publishing as Prentice Hall
Prepared by: Fernando Quijano & Shelly
1 ofTefft
28
PART II Concepts and Problems in Macroeconomics
© 2012 Pearson Education, Inc. Publishing as Prentice Hall
2 of 42
Unemployment,
Inflation, and
Long-Run Growth
7
CHAPTER OUTLINE
Unemployment
Measuring Unemployment
Components of the Unemployment Rate
The Costs of Unemployment
PART II Concepts and Problems in Macroeconomics
Inflation
© 2012 Pearson Education, Inc. Publishing as Prentice Hall
The Consumer Price Index
The Costs of Inflation
Long-Run Growth
Output and Productivity Growth
Looking Ahead
3 of 42
Unemployment
Measuring Unemployment
PART II Concepts and Problems in Macroeconomics
employed Any person 16 years old or older (1) who works for
pay, either for someone else or in his or her own business for 1
or more hours per week, (2) who works without pay for 15 or
more hours per week in a family enterprise, or (3) who has a
job but has been temporarily absent with or without pay.
unemployed A person 16 years old or older who is not
working, is available for work, and has made specific efforts to
find work during the previous 4 weeks.
© 2012 Pearson Education, Inc. Publishing as Prentice Hall
4 of 42
Unemployment
Measuring Unemployment
not in the labor force A person who is not looking for work
because he or she does not want a job or has given up looking.
PART II Concepts and Problems in Macroeconomics
labor force The number of people employed plus the number
of unemployed.
labor force = employed + unemployed
population = labor force + not in labor force
© 2012 Pearson Education, Inc. Publishing as Prentice Hall
5 of 42
Unemployment
Measuring Unemployment
unemployment rate The ratio of the number of people
unemployed to the total number of people in the labor force.
PART II Concepts and Problems in Macroeconomics
unemployment rate =
unemployed
employed + unemployed
labor force participation rate The ratio of the labor force to
the total population 16 years old or older.
labor force participation rate =
© 2012 Pearson Education, Inc. Publishing as Prentice Hall
labor force
population
6 of 42
PART II Concepts and Problems in Macroeconomics
A person not looking for work, because he or she either does not
want a job or has given up looking, is classified as:
a.
Unemployed.
b.
Not in the labor force.
c.
In the labor force but not currently employed.
d.
In the labor force participation rate, but not in the labor
force.
© 2012 Pearson Education, Inc. Publishing as Prentice Hall
7 of 42
PART II Concepts and Problems in Macroeconomics
A person not looking for work, because he or she either does not
want a job or has given up looking, is classified as:
a.
Unemployed.
b.
Not in the labor force.
c.
In the labor force but not currently employed.
d.
In the labor force participation rate, but not in the labor
force.
© 2012 Pearson Education, Inc. Publishing as Prentice Hall
8 of 42
Unemployment
Measuring Unemployment
TABLE 7.1 Employed, Unemployed, and the Labor Force, 1950–2009
(1)
PART II Concepts and Problems in Macroeconomics
Population
16 Years
Old or Over
(Millions)
(2)
Labor
Force
(Millions)
(3)
(4)
(5)
(6)
Employe
d
(Millions)
Unemployed
(Millions)
Labor Force
Participation
Rate
(Percentage
Points)
Unemployment
Rate
(Percentage
Points)
1950
105.0
62.2
58.9
3.3
59.2
5.3
1960
117.2
69.6
65.8
3.9
59.4
5.5
1970
137.1
82.8
78.7
4.1
60.4
4.9
1980
167.7
106.9
99.3
7.6
63.8
7.1
1990
189.2
125.8
118.8
7.0
66.5
5.6
2000
212.6
142.6
136.9
5.7
67.1
4.0
2009
235.8
154.1
139.9
14.3
65.4
9.3
Note: Figures are civilian only (military excluded).
© 2012 Pearson Education, Inc. Publishing as Prentice Hall
9 of 42
Unemployment
Components of the Unemployment Rate
Unemployment Rates for Different Demographic Groups
TABLE 7.2 Unemployment Rates by Demographic Group, 1982 and 2010
PART II Concepts and Problems in Macroeconomics
Years
Total
White
Men
Women
Both sexes
African American
Men
Women
Both sexes
© 2012 Pearson Education, Inc. Publishing as Prentice Hall
20+
20+
16–19
20+
20+
16–19
November 1982
June 2010
10.8
9.6
9.0
8.1
21.3
9.5
8.6
8.9
7.1
23.2
20.2
19.3
16.5
15.4
17.4
11.8
49.5
39.9
10 of 42
Unemployment
Components of the Unemployment Rate
Unemployment Rates in States and Regions
PART II Concepts and Problems in Macroeconomics
TABLE 7.3 Regional Differences in Unemployment, 1975, 1982, 1991, 2003 and 2010
U.S. avg.
Cal.
Fla.
Ill.
Mass.
Mich.
N.J.
N.Y.
N.C.
Ohio
Tex.
© 2012 Pearson Education, Inc. Publishing as Prentice Hall
1975
8.5
9.9
10.7
7.1
11.2
12.5
10.2
9.5
8.6
9.1
5.6
1982
9.7
9.9
8.2
11.3
7.9
15.5
9.0
8.6
9.0
12.5
6.9
1991
6.7
7.5
7.3
7.1
9.0
9.2
6.6
7.2
5.8
6.4
6.6
2003
6.0
6.7
5.1
6.7
5.8
7.3
5.9
6.3
6.5
6.1
6.8
2010
9.7
12.4
11.7
10.8
9.2
13.6
9.7
8.3
10.3
10.7
8.3
11 of 42
PART II Concepts and Problems in Macroeconomics
Unemployment rates in states and regions across the United
States reveal that:
a.
States and regions in the United States generally display
the same levels of unemployment.
b.
The labor force in the United States is almost completely
mobile, with workers taking advantage of job opportunities clear
across the country.
c.
A low national rate of unemployment does not mean that
the entire nation is growing and producing at the same rate.
d.
All of the above.
© 2012 Pearson Education, Inc. Publishing as Prentice Hall
12 of 42
PART II Concepts and Problems in Macroeconomics
Unemployment rates in states and regions across the United
States reveal that:
a.
States and regions in the United States generally display
the same levels of unemployment.
b.
The labor force in the United States is almost completely
mobile, with workers taking advantage of job opportunities clear
across the country.
c.
A low national rate of unemployment does not mean
that the entire nation is growing and producing at the same
rate.
d.
All of the above.
© 2012 Pearson Education, Inc. Publishing as Prentice Hall
13 of 42
Unemployment
Components of the Unemployment Rate
Discouraged-Worker Effects
PART II Concepts and Problems in Macroeconomics
discouraged-worker effect The decline in the measured
unemployment rate that results when people who want to work
but cannot find jobs grow discouraged and stop looking, thus
dropping out of the ranks of the unemployed and the labor force.
© 2012 Pearson Education, Inc. Publishing as Prentice Hall
14 of 42
PART II Concepts and Problems in Macroeconomics
When an unemployed worker becomes discouraged about finding
work and stops looking, the unemployment rate will:
a.
Rise.
b.
Fall.
c.
Remain unchanged.
d.
Increase only if the worker falls out of the labor force.
© 2012 Pearson Education, Inc. Publishing as Prentice Hall
15 of 42
PART II Concepts and Problems in Macroeconomics
When an unemployed worker becomes discouraged about finding
work and stops looking, the unemployment rate will:
a.
Rise.
b.
Fall.
c.
Remain unchanged.
d.
Increase only if the worker falls out of the labor force.
© 2012 Pearson Education, Inc. Publishing as Prentice Hall
16 of 42
E C O N O M I C S I N PRACTI C E
A Quiet Revolution: Women Join the Labor Force
PART II Concepts and Problems in Macroeconomics
As women began joining the
labor force in greater numbers
in the 1970s and 1980s, their
wages relative to men’s wages
actually fell.
Most economists attribute this
decline to the fact that less
experienced women were
entering the labor force,
pointing out the importance of
correcting for factors such as
experience and education when we analyze labor markets.
If you are interested in learning more about the economic history of American
women, read the book Understanding the Gender Gap: An Economic History
of American Women by Harvard University economist Claudia Goldin.
© 2012 Pearson Education, Inc. Publishing as Prentice Hall
17 of 42
Unemployment
Components of the Unemployment Rate
The Duration of Unemployment
TABLE 7.4 Average Duration of Unemployment, 1970–2009
PART II Concepts and Problems in Macroeconomics
Weeks
1970
1971
1972
1973
1974
1975
1976
1977
1978
1979
1980
1981
1982
1983
8.6
11.3
12.0
10.0
9.8
14.2
15.8
14.3
11.9
10.8
11.9
13.7
15.6
20.0
© 2012 Pearson Education, Inc. Publishing as Prentice Hall
Weeks
1984
1985
1986
1987
1988
1989
1990
1991
1992
1993
1994
1995
1996
18.2
15.6
15.0
14.5
13.5
11.9
12.0
13.7
17.7
18.0
18.8
16.6
16.7
Weeks
1997
1998
1999
2000
2001
2002
2003
2004
2005
2006
2007
2008
2009
15.8
14.5
13.4
12.6
13.1
16.6
19.2
19.6
18.4
16.8
16.8
17.9
24.4
18 of 42
Unemployment
The Costs of Unemployment
Some Unemployment Is Inevitable
When we consider the various costs of unemployment, it is
useful to categorize unemployment into three types:
PART II Concepts and Problems in Macroeconomics
Frictional unemployment
Structural unemployment
Cyclical unemployment
© 2012 Pearson Education, Inc. Publishing as Prentice Hall
19 of 42
Unemployment
The Costs of Unemployment
Frictional, Structural, and Cyclical Unemployment
PART II Concepts and Problems in Macroeconomics
frictional unemployment The portion of unemployment that
is due to the normal turnover in the labor market; used to
denote short-run job/skill matching problems.
structural unemployment The portion of unemployment
that is due to changes in the structure of the economy that
result in a significant loss of jobs in certain industries.
natural rate of unemployment The unemployment rate that
occurs as a normal part of the functioning of the economy.
Sometimes taken as the sum of frictional unemployment rate
and structural unemployment rate.
cyclical unemployment Unemployment that is above
frictional plus structural unemployment.
© 2012 Pearson Education, Inc. Publishing as Prentice Hall
20 of 42
Unemployment
The Costs of Unemployment
Social Consequences
PART II Concepts and Problems in Macroeconomics
The costs of unemployment are neither evenly distributed
across the population nor easily quantified.
The social consequences of the Depression of the 1930s are
perhaps the hardest to comprehend. Few emerged from this
period unscathed.
At the bottom were the poor and the fully unemployed, about
25 percent of the labor force. Even those who kept their jobs
found themselves working part-time.
Many people lost all or part of their savings as the stock
market crashed and thousands of banks failed.
© 2012 Pearson Education, Inc. Publishing as Prentice Hall
21 of 42
Inflation
The Consumer Price Index
PART II Concepts and Problems in Macroeconomics
consumer price index (CPI) A price index computed each
month by the Bureau of Labor Statistics using a bundle that is
meant to represent the “market basket” purchased monthly
by the typical urban consumer.
© 2012 Pearson Education, Inc. Publishing as Prentice Hall
22 of 42
Inflation
PART II Concepts and Problems in Macroeconomics
The Consumer Price Index
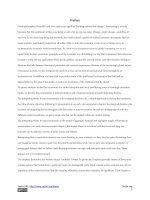
▲ FIGURE 7.1 The CPI Market Basket
The CPI market basket shows how a typical consumer divides his or her money among various
goods and services.
Most of a consumer’s money goes toward housing, transportation, and food and beverages.
© 2012 Pearson Education, Inc. Publishing as Prentice Hall
23 of 42
PART II Concepts and Problems in Macroeconomics
The CPI market basket shows that most of a typical consumer’s
money goes toward:
a.
Recreation, medical care, and education.
b.
Food and beverage, apparel, and other goods and
services.
c.
Housing, transportation, and food and beverages.
d.
None of the above. The typical consumer spends about
the same amount of money on each of the categories listed in the
choices above.
© 2012 Pearson Education, Inc. Publishing as Prentice Hall
24 of 42
PART II Concepts and Problems in Macroeconomics
The CPI market basket shows that most of a typical consumer’s
money goes toward:
a.
Recreation, medical care, and education.
b.
Food and beverage, apparel, and other goods and
services.
c.
Housing, transportation, and food and beverages.
d.
None of the above. The typical consumer spends about
the same amount of money on each of the categories listed in the
choices above.
© 2012 Pearson Education, Inc. Publishing as Prentice Hall
25 of 42