Principles of macroeconomics 10e by case fair oster ch08
Bạn đang xem bản rút gọn của tài liệu. Xem và tải ngay bản đầy đủ của tài liệu tại đây (1.04 MB, 41 trang )
PRINCIPLES OF
MACROECONOMICS
PART III The Core of Macroeconomic Theory
TENTH
EDITION
CASE FAIR OSTER
© 2012 Pearson Education, Inc. Publishing as Prentice Hall
Prepared by: Fernando Quijano & Shelly
1 ofTefft
11
PART III The Core of Macroeconomic Theory
© 2012 Pearson Education, Inc. Publishing as Prentice Hall
2 of 41
III
PART
PART III The Core of Macroeconomic Theory
The Core of
Macroeconomic
Theory
© 2012 Pearson Education, Inc. Publishing as Prentice Hall
3 of 41
The level of GDP, the overall price level, and the level of employment
—three chief concerns of macroeconomists—are influenced by events
in three broadly defined “markets”:
PART III The Core of Macroeconomic Theory
Goods-and-services market
Financial (money) market
Labor market
© 2012 Pearson Education, Inc. Publishing as Prentice Hall
4 of 41
PART III The Core of Macroeconomic Theory
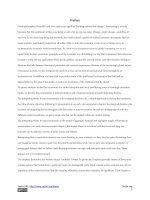
FIGURE III.1 The Core of Macroeconomic Theory
We build up the macroeconomy slowly.
In Chapters 8 and 9, we examine the market for goods and services.
In Chapters 10 and 11, we examine the money market.
Then in Chapter 12, we bring the two markets together, in so doing explaining the links between
aggregate output (Y) and the interest rate (r), and derive the aggregate demand curve.
In Chapter 13, we introduce the aggregate supply curve and determine the price level (P).
We then explain in Chapter 14 how the labor market fits into the macroeconomic picture.
© 2012 Pearson Education, Inc. Publishing as Prentice Hall
5 of 41
Aggregate
Expenditure and
Equilibrium Output
8
CHAPTER OUTLINE
The Keynesian Theory of Consumption
Other Determinants of Consumption
Planned Investment (I)
The Determination of Equilibrium Output (Income)
The Saving/Investment Approach to Equilibrium
Adjustment to Equilibrium
PART III The Core of Macroeconomic Theory
The Multiplier
© 2012 Pearson Education, Inc. Publishing as Prentice Hall
The Multiplier Equation
The Size of the Multiplier in the Real World
Looking Ahead
Appendix: Deriving the Multiplier Algebraically
6 of 41
aggregate output The total quantity of goods and services produced
(or supplied) in an economy in a given period.
PART III The Core of Macroeconomic Theory
aggregate income The total income received by all factors of
production in a given period.
In any given period, there is an exact equality between aggregate output
(production) and aggregate income. You should be reminded of this fact
whenever you encounter the combined term aggregate output (income) (Y).
aggregate output (income) (Y) A combined term used to remind you
of the exact equality between aggregate output and aggregate income.
© 2012 Pearson Education, Inc. Publishing as Prentice Hall
7 of 41
The Keynesian Theory of Consumption
consumption function The relationship between consumption and income.
FIGURE 8.1 A Consumption
Function for a Household
PART III The Core of Macroeconomic Theory
A consumption function for an
individual household shows the
level of consumption at each
level of household income.
© 2012 Pearson Education, Inc. Publishing as Prentice Hall
8 of 41
PART III The Core of Macroeconomic Theory
To explain aggregate spending behavior, economists speculate
that an increase in aggregate income in a given period will result in
an increase in aggregate consumption in all of the following
instances, except:
a.
When household wealth increases.
b.
When interest rates rise.
c.
When households form positive expectations about the
future.
d.
None of the above. In all of the cases above, aggregate
consumption will rise.
© 2012 Pearson Education, Inc. Publishing as Prentice Hall
9 of 41
PART III The Core of Macroeconomic Theory
To explain aggregate spending behavior, economists speculate
that an increase in aggregate income in a given period will result in
an increase in aggregate consumption in all of the following
instances, except:
a.
When household wealth increases.
b.
When interest rates rise.
c.
When households form positive expectations about the
future.
d.
None of the above. In all of the cases above, aggregate
consumption will rise.
© 2012 Pearson Education, Inc. Publishing as Prentice Hall
10 of 41
The Keynesian Theory of Consumption
With a straight line consumption curve, we can use the following equation to
describe the curve:
C = a + bY
PART III The Core of Macroeconomic Theory
FIGURE 8.2 An Aggregate
Consumption
Function
The aggregate
consumption function
shows the level of aggregate
consumption at each level of
aggregate income.
The upward slope indicates that
higher levels of income lead to
higher levels of consumption
spending.
© 2012 Pearson Education, Inc. Publishing as Prentice Hall
11 of 41
The Keynesian Theory of Consumption
marginal propensity to consume (MPC) That fraction of a change in income
that is consumed, or spent.
marginal propensity to consume ≡ slope of consumption function ≡
∆C
∆Y
PART III The Core of Macroeconomic Theory
aggregate saving (S) The part of aggregate income that is not consumed.
© 2012 Pearson Education, Inc. Publishing as Prentice Hall
S≡Y–C
12 of 41
PART III The Core of Macroeconomic Theory
When aggregate consumption is plotted along a straight line, C = a
+ bY, an increase in income results in an increase in consumption
equal to:
a.
b.
b.
b times ΔY.
c.
a times ΔY.
d.
a + b.
© 2012 Pearson Education, Inc. Publishing as Prentice Hall
13 of 41
PART III The Core of Macroeconomic Theory
When aggregate consumption is plotted along a straight line, C = a
+ bY, an increase in income results in an increase in consumption
equal to:
a.
b.
b.
b times ΔY.
c.
a times ΔY.
d.
a + b.
© 2012 Pearson Education, Inc. Publishing as Prentice Hall
14 of 41
The Keynesian Theory of Consumption
identity Something that is always true.
marginal propensity to save (MPS) That fraction of a change in income that
is saved.
MPC + MPS ≡ 1
PART III The Core of Macroeconomic Theory
Because the MPC and the MPS are important concepts, it may help to review
their definitions.
The marginal propensity to consume (MPC) is the fraction of an increase in
income that is consumed (or the fraction of a decrease in income that comes
out of consumption).
The marginal propensity to save (MPS) is the fraction of an increase in income
that is saved (or the fraction of a decrease in income that comes out of saving).
© 2012 Pearson Education, Inc. Publishing as Prentice Hall
15 of 41
The Keynesian Theory of Consumption
FIGURE 8.3 The Aggregate
Consumption Function Derived from the
Equation C = 100 + .75Y
In this simple consumption function,
consumption is 100 at an income of
zero.
As income rises, so does
consumption.
For every 100 increase in income,
consumption rises by 75.
The slope of the line is .75.
PART III The Core of Macroeconomic Theory
Aggregate
Income, Y
Aggregate
Consumption, C
0
100
80
160
100
175
200
250
400
400
600
550
800
700
1,000
850
© 2012 Pearson Education, Inc. Publishing as Prentice Hall
16 of 41
The Keynesian Theory of Consumption
FIGURE 8.4 Deriving the Saving Function
from the Consumption Function in Figure 8.3
PART III The Core of Macroeconomic Theory
Because S ≡ Y – C, it is easy to derive the
saving function from the consumption
function.
A 45° line drawn from the origin can be
used as a convenient tool to compare
consumption and income graphically.
At Y = 200, consumption is 250.
The 45° line shows us that consumption is
larger than income by 50.
Thus, S ≡ Y – C = −50.
At Y = 800, consumption is less than
income by 100.
Thus, S = 100 when Y = 800.
C
=
S
Y
−
AGGREGATE
AGGREGATE
AGGREGATE
CONSUMPTION
SAVING
INCOME
0
100
-100
80
160
-80
100
175
-75
200
250
-50
400
400
0
600
550
50
800
700
100
1,000
850
150
© 2012 Pearson Education, Inc. Publishing as Prentice Hall
17 of 41
PART III The Core of Macroeconomic Theory
Fill in the blanks. Where the consumption function is below the 45°
line, consumption is ________ than income, and saving is
________.
a.
more; positive
b.
more; negative
c.
less; positive
d.
less; negative
© 2012 Pearson Education, Inc. Publishing as Prentice Hall
18 of 41
PART III The Core of Macroeconomic Theory
Fill in the blanks. Where the consumption function is below the 45°
line, consumption is ________ than income, and saving is
________.
a.
more; positive
b.
more; negative
c.
less; positive
d.
less; negative
© 2012 Pearson Education, Inc. Publishing as Prentice Hall
19 of 41
The Keynesian Theory of Consumption
Other Determinants of Consumption
The assumption that consumption depends only on income is obviously
a simplification.
PART III The Core of Macroeconomic Theory
In practice, the decisions of households on how much to consume in a
given period are also affected by their wealth, by the interest rate, and
by their expectations of the future.
Households with higher wealth are likely to spend more, other things
being equal, than households with less wealth.
© 2012 Pearson Education, Inc. Publishing as Prentice Hall
20 of 41
E C O N O M I C S I N PRACTI C E
Behavioral Biases in Saving Behavior
PART III The Core of Macroeconomic Theory
Economists have generally
assumed that people make their
saving decisions rationally, just as
they make other decisions about
choices in consumption and the
labor market.
Saving decisions involve thinking
about trade-offs between present
and future consumption.
Recent work in behavioral
economics has highlighted the role of psychological biases in saving behavior
and has demonstrated that seemingly small changes in the way saving
programs are designed can result in big behavioral changes.
© 2012 Pearson Education, Inc. Publishing as Prentice Hall
21 of 41
Planned Investment (I)
planned investment (I) Those additions to capital stock and
inventory that are planned by firms.
actual investment The actual amount of investment that takes
place; it includes items such as unplanned changes in inventories.
PART III The Core of Macroeconomic Theory
FIGURE 8.5 The Planned Investment
Function
For the time being, we will assume
that planned investment is fixed.
It does not change when income
changes, so its graph is a
horizontal line.
© 2012 Pearson Education, Inc. Publishing as Prentice Hall
22 of 41
The Determination of Equilibrium Output (Income)
equilibrium Occurs when there is no tendency for change. In
the macroeconomic goods market, equilibrium occurs when
planned aggregate expenditure is equal to aggregate output.
PART III The Core of Macroeconomic Theory
planned aggregate expenditure (AE) The total amount the
economy plans to spend in a given period. Equal to
consumption plus planned investment: AE ≡ C + I.
Y>C+I
aggregate output > planned aggregate expenditure
C+I>Y
planned aggregate expenditure > aggregate output
© 2012 Pearson Education, Inc. Publishing as Prentice Hall
23 of 41
The Determination of Equilibrium Output (Income)
TABLE 8.1 Deriving the Planned Aggregate Expenditure Schedule and Finding Equilibrium.
The Figures in Column 2 Are Based on the Equation C = 100 + .75Y.
(1)
(2)
(3)
(4)
(5)
(6)
PART III The Core of Macroeconomic Theory
Unplanned
Planned
Inventory
Aggregate
Aggregate
Output
Aggregate
Planned
Expenditure (AE) Change
Equilibrium?
Y − (C + I)
(Income) (Y) Consumption (C) Investment (I)
C+I
(Y = AE?)
100
175
25
200
− 100
No
200
250
25
275
− 75
No
400
400
25
425
− 25
No
500
475
25
500
0
Yes
600
550
25
575
+ 25
No
800
700
25
725
+ 75
No
1,000
850
25
875
+ 125
No
© 2012 Pearson Education, Inc. Publishing as Prentice Hall
24 of 41
The Determination of Equilibrium Output (Income)
FIGURE 8.6 Equilibrium
Aggregate Output
PART III The Core of Macroeconomic Theory
Equilibrium occurs when
planned aggregate expenditure
and aggregate output are equal.
Planned aggregate expenditure
is the sum of consumption
spending and planned
investment spending.
© 2012 Pearson Education, Inc. Publishing as Prentice Hall
25 of 41