Integrated geophysical exploration for iron ore deposit in omo beyem, jimma zone, south west ethiopia
Bạn đang xem bản rút gọn của tài liệu. Xem và tải ngay bản đầy đủ của tài liệu tại đây (17.46 MB, 106 trang )
ADDIS ABABA UNIVERSITY
COLLEGE OF NATURAL AND COMPUTATIONAL SCIENCES
SCHOOL OF EARTH SCIENCES
STREAM OF APPLIED GEOPHYSICS
INTEGRATED GEOPHYSICAL EXPLORATION FOR IRON ORE DEPOSIT
IN OMO BEYEM, JIMMA ZONE, SOUTH WEST ETHIOPIA
A THESIS SUBMITTED TO
THE SCHOOL OF GRADUATE STUDIES OF ADDIS ABABA UNIVERSITY FOR
PARTIAL FULFILLMENT OF THE REQUIREMENTS FOR THE DEGREE OF
MASTER OF SCIENCE IN EARTH SCIENCES (APPLIED GEOPHYSICS)
BY
MENGISTU BACHA
ADDIS ABABA UNIVERSITY
ADDIS ABABA, ETHIOPIA
JUNE, 2017
2017
Integrated Geophysical Exploration for Iron ore Deposit in, Omo Beyem, Jimma zone, South West Ethiopia
ADDIS ABABA UNIVERSITY
SCHOOL OF GRADUATE STUDIES
SCHOOL OF EARTH SCEINCES
This is to certify that the thesis prepared by Mengistu Bacha, entitled: “Integrated
Geophysical Exploration for Iron ore Deposit in Omo Beyem, Jima zone, South West
Ethiopia”and submitted in partial fulfillment of the requirements for the degree of Master of
Science in Applied Geophysics complies with the regulations of the University and meets the
accepted standards with respect to originality and quality.
Approved by examining committee:
Signature
Dr. Balemwal Atnafu
____________
Date
_______
(Head, School of Earth Sciences)
Dr. Getnet Mewa
__________
_________
(Advisor)
Dr.Worash Getaneh
____________
_______
(Examiner)
Prof. Tilahun Mamo
____________
(Examiner)
i
_______
2017
Integrated Geophysical Exploration for Iron ore Deposit in, Omo Beyem, Jimma zone, South West Ethiopia
DECLARATION
I, the undersigned, hereby declare that the thesis entitled with: “Integrated Geophysical
Exploration for Iron ore Deposit in, Omo Beyem, Jimma zone, South West Ethiopia” is my
original work carried out under the supervision of Dr. Getnet Mewa and has not presented to any
University or institution for the award of any degree or diploma program and all sources of
materials used for the thesis are duly acknowledged.
Name of the candidate
Signature
Mengistu Bacha
Date
________________
__________
This is to certify that the above declaration made by the candidate is correct to the best of my
knowledge and it has been submitted for examination with my approval as University advisors.
Signature
Dr. Getnet Mewa
Date
________________
(Advisor)
ii
___________
2017
Integrated Geophysical Exploration for Iron ore Deposit in, Omo Beyem, Jimma zone, South West Ethiopia
ABSTRACT
An integrated geophysical exploration using Magnetic, Induced Polarization (IP) and Gamm-Ray
Spectrometry methods were conducted for iron ore exploration in Meti Segeda locality, Omo
Beyem woreda, Jimma zone Southwest Ethiopia. Geologically, the area is situated by volcanic
rocks represented by basalts, rhyolite and trachyte flows. The NW-SE striking iron bearing zone
is occurred between the rhyolite and basalt.
The objective of the study was to map anomalous zones for possible iron ore mineralization with
its extents and dip. This objective was achieved through different steps and processes including,
collection and reviewing of all relevant secondary data and reports which followed by field
primary data collection. In doing so Magnetic, Induced Polarization, Gamm-Ray Spectrometry,
and Resistivity surveys were applied for data acquisition. Rock samples were also collected for
thin section description, major oxide analysis and susceptibility measurements. Remote sensing
methods of ASETR imagery data was used for iron alteration mapping of surrounding area.
The processed, interpreted and integrated geophysical data revealed the mineralized zone as a
zone of intersection of high chargeability, high resistivity, intermediate magnetic susceptibility
and high Thorium to Potassium ratio. This intersection zone has NW-SE strike direction and
represents the mineralized zone. The same zone is correlates with the IP/R inverted section
which is easterly dipping with depth of more than 30m and length of 190m. Mineralization
seems to have an association with NE-SW and NW-SE structures within survey area. Based on
lateral and vertical extents of the mineralized zone the prospect may be used for small scale
investment. Based on northern opened Induced Polarization/Resistivity anomalies and processed
satellite imagery data, the extensional surveys are recommended to the northwest and northern
part of the grid.
Keywords: Iron; deposit; Mineralization; Association; Structure; Susceptibility; Magnetic
Anomaly; Chargeability;
iii
2017
Integrated Geophysical Exploration for Iron ore Deposit in, Omo Beyem, Jimma zone, South West Ethiopia
ACKNOWLEDGEMENTS
I would like to express my deepest appreciation to my advisor, Dr. Getnet Mewa for his especial
and devoted support in advices, guidance and encouragements throughout all the work with
friendly and exemplary characters. His devotion to reviewing the thesis and providing
corrections was really admirable.
I am very much grateful to Ato Bekana Muleta for his unreserved professional support. His
contribution in commenting, guiding in all steps of the work and reviewing the thesis for relevant
corrections were significant.
I would like also to thank the Geological Survey of Ethiopia for the chance it gave to me and all
necessary field equipment and data for the fulfillment of the study.
I would like to extend my thanks to Ato Dawit Mamo for his encouragement, professional
support and cooperation for all material I had needed during the study.
My special thanks go to W/o Emebet Lisanu and secretary office members for their support and
cooperation in all support I had needed from the office.
I would like to express my deepest gratitude to all graduate students of the stream of Applied
Geophysics for their team work sprit and interests for sharing knowledge through discussions
during all the study.
Finally, I would like to express my deepest gratitude to mywife; Tadeleche Girma and my
daughter; Hasset Mengistu for their time, support and all encouragement for the success of this
study.
iv
2017
Integrated Geophysical Exploration for Iron ore Deposit in, Omo Beyem, Jimma zone, South West Ethiopia
TABLE OF CONTENTS
DECLARATION ........................................................................................................................................................II
ABSTRACT .............................................................................................................................................................. III
ACKNOWLEDGEMENTS ..................................................................................................................................... IV
TABLE OF CONTENTS ........................................................................................................................................... V
LIST OF FIGURES ................................................................................................................................................. VII
LIST OF TABLE ...................................................................................................................................................... IX
ACRONYMS AND ABBREVIATION ................................................................................................................... IX
CHAPTER I ................................................................................................................................................................. 1
1. INTRODUCTION....................................................................................................................................................... 1
1.1 Background ..................................................................................................................................................... 1
1.1.1 Iron Ore Deposit in Ethiopia ....................................................................................................................... 2
1.1.1.2 History of Iron Exploration in Ethiopia .................................................................................................... 3
1.2 LOCATION AND DESCRIPTION OF THE STUDY AREA .............................................................................................. 3
1.2.1 Location and Accessibility ........................................................................................................................... 3
1.2.2 Physiography ............................................................................................................................................... 4
1.2.3 Site description ............................................................................................................................................ 5
1.3 STATEMENT OF THE PROBLEMS ............................................................................................................................ 6
1.4. OBJECTIVES OF THE RESEARCH PROJECT ............................................................................................................. 7
1.4.1 Main Objectives ........................................................................................................................................... 7
To understand and asses the iron prospect of Omo Beyem .................................................................................. 7
1.4.2 Specific Objectives ....................................................................................................................................... 7
1.5 SIGNIFICANCES AND EXPECTED OUTCOME .......................................................................................................... 7
1.6 PREVIOUS WORKS ................................................................................................................................................ 8
1.7 METHODOLOGIES ................................................................................................................................................. 9
1.7.1 Rock Samples Collections .......................................................................................................................... 10
1.8.2 Remote Sensing: Thermal Emission and Reflection Radiometer (ASTER) ................................................ 12
1.9 STRUCTURES OF THESIS ..................................................................................................................................... 13
CHAPTER II ............................................................................................................................................................. 14
2. GEOLOGICAL AND STRUCTURAL SETTING............................................................................................................ 14
2.1 Regional Geology ......................................................................................................................................... 14
2.2 Local Geology and Mineralization ............................................................................................................... 16
2.2.1 Thin section descriptions for rock samples (by: Workineh Haro, GSE) .................................................... 17
2.3 Geological Structure ..................................................................................................................................... 22
CHAPTER III ............................................................................................................................................................ 24
3. BASIC THEORY AND PRINCIPLES OF GEOPHYSICAL METHODS ............................................................................. 24
v
2017
Integrated Geophysical Exploration for Iron ore Deposit in, Omo Beyem, Jimma zone, South West Ethiopia
3.1 Magnetic method........................................................................................................................................... 24
3.1.1 Magnetic field strength and flux density .................................................................................................... 24
3.1.2 Earth's Magnetic Field (B) ........................................................................................................................ 25
3.1.3 Components of the Earth's total magnetic field ......................................................................................... 26
3.1.4 Elements of the Earth magnetic field ......................................................................................................... 26
3.1.5 Magnetic properties ................................................................................................................................... 27
3.1.6 Magnetic Data Processing ......................................................................................................................... 28
3.2 ELECTRICAL METHODS ...................................................................................................................................... 30
3.2.1 Electrical Resistivity Methods .................................................................................................................... 30
3.2.2 Electrode Arrays ........................................................................................................................................ 34
3.2.2.1 Dipole-Dipole array................................................................................................................................ 35
3.2.3 Electrical properties of earth materials ..................................................................................................... 35
3.2.2 Induced Polarization .................................................................................................................................. 36
3.2.2.1 Mechanisms of Induced Polarization ...................................................................................................... 37
3.2.2.1.1 Electrode Polarization ......................................................................................................................... 37
3.3 RADIOMETRIC SURVEY ...................................................................................................................................... 40
3.4 Remote Sensing ............................................................................................................................................. 42
3.4.1 Advanced Space Borne Thermal Emission and Reflection Radiometer (ASTER) ...................................... 42
CHAPTER IV ............................................................................................................................................................ 43
4. GEOPHYSICAL DATA ACQUISITIONS, PROCESSING AND PRESENTATION .............................................................. 43
4.1 Magnetic Method .......................................................................................................................................... 43
4.1.1 Instrumentation and Data Acquisition ....................................................................................................... 43
4.1.2 Data Processing and Presentation ............................................................................................................ 45
4.2 INDUCED POLARIZATION .................................................................................................................................... 46
4.2.1 Instrumentation and Data Acquisition ....................................................................................................... 46
4.2.2 Data Processing and Presentations ........................................................................................................... 49
4.3 RADIOMETRIC METHOD ..................................................................................................................................... 50
4.3.1 Instrumentation and Data Acquisition ....................................................................................................... 50
4.3.2 Data Processing and Presentation ............................................................................................................ 51
CHAPTER V .............................................................................................................................................................. 53
5. INTERPRETATIONS AND DISCUSSIONS .................................................................................................................. 53
5.1 Magnetic Method .......................................................................................................................................... 53
5.1.2 Quantitative Interpretation ........................................................................................................................ 58
5.2 INDUCED POLARIZATION/RESISTIVITY ............................................................................................................... 61
5.2.1 Qualitative Interpretation .......................................................................................................................... 61
5.2.1.1 Stacked Apparent Chargeability Pseudo-Section maps .......................................................................... 62
5.2.1.2 Chargeability Plan Maps ........................................................................................................................ 64
5.2.1.3 Stacked Apparent Resistivity Pseudo-Section Maps ............................................................................... 67
5.2.1.4 Resistivity Plan Maps ............................................................................................................................ 69
5.2.2 Quantitative interpretation ........................................................................................................................ 72
5.2.2.1 IP/Resistivity Inverse Model Section (Line100N) ................................................................................... 72
5.2.2.2 IP/Resistivity Inverse Model Section (Line 50N) .................................................................................... 74
5.2.2.3 IP/Resistivity Inverse Model Section (Line 0) ......................................................................................... 76
vi
2017
Integrated Geophysical Exploration for Iron ore Deposit in, Omo Beyem, Jimma zone, South West Ethiopia
5.2.2.4 IP/Resistivity Inverse Model Section (Line 50S) ..................................................................................... 78
5.3 RADIOMETRIC METHOD ..................................................................................................................................... 78
5.4 ASTER SATELLITE IMAGERY INTERPRETATION ................................................................................................ 85
CHAPTER VI ............................................................................................................................................................ 86
6. INTEGRATED INTERPRETATION ............................................................................................................................ 86
CHAPTER VII........................................................................................................................................................... 89
7. CONCLUSION AND RECOMMENDATION ................................................................................................................ 89
7.1 Conclusions ................................................................................................................................................... 89
7.2 Recommendation ........................................................................................................................................... 90
REFERENCES .......................................................................................................................................................... 91
LIST OF FIGURES
Figure 1.1: Location map of study area ........................................................................................................ 4
Figure 1.2: Physiographic map of the area ................................................................................................... 5
Figure 1.3: Field rock sample collection .................................................................................................... 11
Figure 2.1: Regional geological map of Jimma area .................................................................................. 14
Figure 2.2: Outcrops of major lithological units ........................................................................................ 15
Figure 2.3 Local geology of study area....................................................................................................... 16
Figure 2.4: N500W striking outcrop of iron-bearing zone .......................................................................... 17
Figure 2.5: Thin section view for basalt rock sample ................................................................................. 18
Figure 2.7: Thin section view of rhyolite rock sample ............................................................................... 21
Figure 2.8 Geological Structure of the study area....................................................................................... 23
Figure 3.1: Earth’s geomagnetic dipole as a bar magnet ............................................................................ 26
Figure 3.2: Elements of the Earth’s magnetic field..................................................................................... 27
Figure 3.3: Inducing field, B producing Magnetization ............................................................................. 28
Figure 3.4: Demonstration of Ohm's law .................................................................................................... 31
Figure 3.5: The potential distribution due to: a point current sources ........................................................ 33
Figure 3.6: Generalized form of electrode configuration ........................................................................... 33
Figure: 3.7 Dipole-Dipole array electrode configurations .......................................................................... 35
Figure 3.8: The phenomenon of induced polarization. ............................................................................... 37
Figure 3.9: Microscopic pore channels in rocks. ........................................................................................ 38
Figure 3.10: Membrane polarization. .......................................................................................................... 38
Figure 3.11: Energy spectra of 40K, 238U and 232Th .................................................................................... 41
Figure 4.1: Proton precession magnetometer .............................................................................................. 43
Figure 4.2: Magnetic survey: ..................................................................................................................... 44
Figure 4.3: IP unit (transmitter, receiver etc. ............................................................................................. 47
vii
2017
Integrated Geophysical Exploration for Iron ore Deposit in, Omo Beyem, Jimma zone, South West Ethiopia
Figure 4.4 Dipole-dipole array electrode configuration .............................................................................. 48
Figure 4.5: Radiometric field data acquisitio .............................................................................................. 51
Figure 5.1: Magnetic total field map ........................................................................................................... 54
Figure 5.2: Magnetic total field central EW profile (white line) ................................................................ 54
Figure 5.3: The residual field anomaly map ............................................................................................... 55
Figure 5.4: Analytic signal map .................................................................................................................. 57
Figure 5.5 Tilt angle derivatives: from analytic signals. ............................................................................. 58
Figure 5.7: A model of subsurface under selected profile using magnetic data ......................................... 60
Figure 5.8: Estimated depth of the anomaly sources for SI =1 ................................................................... 61
Figure 5.9: IP stacked pseudo section map ................................................................................................. 62
Figure 5.10 Chargeability plan map Level 1............................................................................................... 64
Figure 5.11: Chargeability plan map Level 3 ............................................................................................. 64
Figure 5.12: Chargeability plan map Level 5 ............................................................................................. 65
Figure 5.13 Stacked IP plan map ................................................................................................................ 66
Figure 5.14: Resistivity stacked pseudo section map.................................................................................. 68
Figure 5.15 Resistivity plan map level 1 (n=1) ........................................................................................... 69
Figure 5.16 Resistivity plan map level 3 (n=3) ........................................................................................... 69
Figure 5.17 Resistivity plan map level 5 (n= 5) .......................................................................................... 70
Figure 5.18 Stacked resistivity plan map .................................................................................................... 71
Figure 5.19: I P Measured and inverted section for line100N .................................................................... 72
Figure 5.20: Model resistivity and model IP for line 100N ........................................................................ 73
Figure 5.21: Measured and inverted Resistivity section for line 50N......................................................... 74
Figure 5.22: Model resistivity and model IP for line 50N .......................................................................... 75
Figure 5.23: Chargeability measured and inverted section for line 0 ......................................................... 76
Figure 5.25: Model resistivity and model IP sections for line 50S ............................................................. 78
Figure 5.27: Potassium concentration map ................................................................................................. 80
Figure 5.28: Uranium concentration map ................................................................................................... 81
Figure 5.30 Uranium to Thorium ratio map ................................................................................................ 83
Figure 5.31 Ternary map of radioelement concentration ............................................................................ 84
Figure 5.38: Iron oxide distribution from ASTER band ratio (B2/B1)....................................................... 85
Figure 6.1: Compilation map of interpreted geophysical methods ............................................................. 86
Figure 6.2: Chargeability plan map of level 6 ............................................................................................ 88
viii
2017
Integrated Geophysical Exploration for Iron ore Deposit in, Omo Beyem, Jimma zone, South West Ethiopia
LIST OF TABLE
Table 1.1: Major iron bearing minerals ........................................................................................................ 2
Table 1.2 Chemical laboratory results of samples ....................................................................................... 8
Table 1.3: The details of the survey grids and summary statistics................................................................ 9
Table 1.4: Laboratory results for susceptibility (k)..................................................................................... 12
Table 3.1: Resistivities of common rocks and ore minerals ...................................................................... 36
Table 3.2: The IP Values for some rocks and minerals ............................................................................. 40
Table 3.3: More common radioactive minerals .......................................................................................... 42
ACRONYMS AND ABBREVIATION
Permeability of vacuum
.m
Ohm.meter
NAI (TI)
Titanium Activated Sodium Iodide
2D
2 Dimensional
3D
3 Dimensional
ASTER
Advanced Space Born Thermal Emission and Reflection Radiometer
CGS
Centimeter gram Second
Cps
Count per second
D
Declination
DC
Direct Current
E
East
eTh
Equivalent Thorium concentration
eU
Equivalent Uranium concentration
GPS
Global Positioning System
GSE
Geological Survey of Ethiopia
I
Inclination
ix
2017
Integrated Geophysical Exploration for Iron ore Deposit in, Omo Beyem, Jimma zone, South West Ethiopia
I
Current
IGRF
International Geomagnetic Reference
IP/R
Induced Polarization/Resistivity
K
Potassium
mV/V
Mill volt per volt
N
North
NE
North East
nT
Nano Tesla
NW
North West
NW
North West
NW-SE
North West -South East
RES2DINV
Resistivity 2D Inversion
RMS
Root mean Square
SE
South East
SI
Structural Index
NE-SW
North East-South West
SW
South West
SWIR
Short Wave Infrared
Tc
Total count
Th
Thorium
TIR
Thermal Infrared
U
Uranium
UTM
Universal Transverse Mercator
VNIR
Very Near Infrared
x
2017
Integrated Geophysical Exploration for Iron ore Deposit in, Omo Beyem, Jimma zone, South West Ethiopia
xi
2017
Integrated Geophysical Exploration for Iron ore Deposit in, Omo Beyem, Jimma zone, South West Ethiopia
CHAPTER I
1. Introduction
1.1 Background
A development in human life is unthinkable without the proper utilization of natural
resources, including water, minerals, forest, etc. From time to time the dependency on such
resources is increasing. On the other hand, the basic natural resources which were easily
obtained in the past are becoming scarce and demand intensive searching using sophisticated
exploration techniques. Iron ore deserved special attention by ancient people as it uses to
make household tools, weapons and different materials. It had been exploited and smelted at
several localities for centuries using primitive technique of smelting. In other way, as it is
among the hottest elements besides oil, gas and gold, the demand for iron ore is rising yearly
among people and industries.
Due to that fact, iron is arguably the backbone for development and indispensable to modern
civilization. It is the fourth most common element in the Earth’s crust after oxygen, silicon
and aluminum. It is mostly found combined with oxygen forming iron oxide minerals such as
magnetite (Fe3O4) which contains 72.36% iron and 27.64% oxygen; or hematite (Fe2O3) that
contains 69.94% iron and 30.06% oxygen. Magnetite occurs in igneous, metamorphic, and
sedimentary rocks while, hematite in association with vein deposits as a product of the
weathering of magnetite. However, some compounds are contain iron as one of their
constitute, based on their chemical compositions, only oxides, carbonates, sulfides and
silicates are used as commercially important iron compounds as shown table 1.1
1
2017
Integrated Geophysical Exploration for Iron ore Deposit in, Omo Beyem, Jimma zone, South West Ethiopia
Table 1.1: Major iron bearing minerals (Lindgren and Waldemer, 1933)
Mineralogical name
Formula and %Fe
Hematite
Fe2O3 (69.9)
Magnetite
Siderite
Ilmenite
Fe3O4 (74.2)
Common designation
Ferric oxide
Ferrous-ferric
oxide
Iron carbonate
Iron-titanium
oxide
FeCO2 (48.2)
FeTiO3 (36.81)
Depending on the presence of iron in compound, iron ores can be categorized as high-grade
(compound that contain more than 60% Fe) and low-grad (which contain 25-30% Fe).
Therefore, economical iron ore deposits belong to magnetite, hematite and Limonite.
However, iron ores are known to occur in sedimentary, hydrothermal, and magmatic
environments, more than 95% of all deposits exploited today are of sedimentary origin that
originated as chemical precipitates from ancient ocean water (Jens. G. and Nicolas J.B.,
2000). In Ethiopia, extensive iron exploration had been made to meet the plan of constructing
steel and metal industry in the period between 1962-1964 (Milan,H., 1963).
1.1.1 Iron Ore Deposit in Ethiopia
The most promising region for base metal prospecting in Ethiopia is low grade Metamorphic
or metavolcano sediments belt in the northern, western and south-western parts which are in
the metamorphic volcano-sedimentary succession and associated intrusive (Mengesha Tefera
et al., 1996). According to Golivkin, N.I. and Kovalevich, V.B. (1982) out of the six genetic
types of iron (stratiform, magmatic, hydrothermal, elluvial, sedimentary and placer) the most
promising iron ore deposits in Ethiopia is the stratiform type that is connected with late
Precamperian volcanogenic sedimentary strata. The magmatic and hydrothermal types are
lesser important as compared with the first.
However Murdock.T.G (1960) stated that, none of the ore occurrence in Wollega are of any
importance except for local use, Milan, H., (1963) in his study concludes that, most
promising high-grade iron ores are confined to the Precambrian metamorphic rocks in central
Wollega. About 58 million tons of iron ore reserve is confirmed so far in Bikilal area by
Ethio-Korea iron ore exploration project in1987.
2
2017
Integrated Geophysical Exploration for Iron ore Deposit in, Omo Beyem, Jimma zone, South West Ethiopia
And thus, the Precambrian basement complex must be considered as the potentially
favorable environment to contain primary high-grade iron ore. The metamorphic type is
found in Koree-Gollisso-Nejo area which seems to be one of the promising areas in the
country.
1.1.1.2 History of Iron Exploration in Ethiopia
In Mai Gudo area, which is only 60km SE of Jimma, iron ore had been exploited by natives
and smelted in a primitive way from extrusive rocks (Milan, H., 1963). Extracting and
smelting of iron in current study area (Jimma zone) had been known since the regime of
Jimma Aba Jiffar, around 1820th and thus, approximately, 5500 kg iron was produced in
Jimma area in 1938 using blast furnaces (Milan, H., 1963). During Italian occupation, efforts
were made to assess iron deposits throughout the country including Jimma area. As a result,
about 20,000 tons of ore were mined (Barnum, B., and Hamrl, M., 1966). In 1945 Murdock
estimated the reserve of the ore Jimma area to be 120, 000 tones (Murdock,T.G., 1960).
According to Masresha Gebrselassie and Wolf, U. R. (2000), small steel foundry and rolling
mill was built in 1962 at Akaki which used imported raw material and scrap iron. Entoto hill
had been known for long time to yield limonitic iron ore to meet local requirement of the
Akaki smelting factory (Golivkin, N.I. and Kovalevich, V.B., 1982).
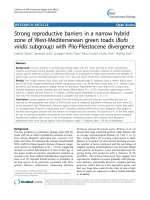
1.2 Location and description of the study area
1.2.1 Location and Accessibility
The study area, Meti Segeda (Figure 1.1) is located in Omo BeyemWoreda, Jimma zone in
Oromia National Region State at about 329km from Addis Ababa in SW direction. It can be
reached by the road from Addis Ababa to Nada via Woliso, Welkite and Sokoru towns
driving 293km on asphalt road, from Nada to Iliche village 20km in all-weather gravel road
and from Iliche to study area with 10km dry weathered road.
3
2017
Integrated Geophysical Exploration for Iron ore Deposit in, Omo Beyem, Jimma zone, South West Ethiopia
Iliche village
Figure 1.1: Location map of study area
1.2.2 Physiography
Physiographic features of the area are the results of volcanism, faulting and rifting
represented by plateau areas, dissected gorges and graben. The study area is situated in the
elevated part of
the region between Asendabo graben in the North and dissected Omo River in the south
(Workineh Haro et al., 2012 and Habtamu Eshetu et al., 2014).
4
2017
Integrated Geophysical Exploration for Iron ore Deposit in, Omo Beyem, Jimma zone, South West Ethiopia
Figure 1.2: Physiographic map of the area
1.2.3 Site description
The study area is bounded by longitudes 37° 22' 0.37" E–37° 22' 31.59" E and latitudes
7°32'56.37" N-7°33'20.57"N in Meti Segeda Kebele of Omo Beyem Woreda. It covers an
area of approximately 0.71 km2. It can be reached through the road from Omo Nada to Omo
Duri. The terrain of the site is characterized by slightly steep surface at the northern and
southern parts, flat at the northern central and lowlands of soil cover at eastern part of the
area with streams at the northern and southern parts. Most of the area is laid within grazing
land while only small portion in farm lands. A typical local setting of the area is the outcrop
of volcanic rocks at the north east part and its elevation that varies between 2250 m to 2150
m above mean sea level.
5
2017
Integrated Geophysical Exploration for Iron ore Deposit in, Omo Beyem, Jimma zone, South West Ethiopia
1.3 Statement of the Problems
Industrial developments need natural resources as raw materials for manufacturing of
varieties of products that are vital to human needs. In this respect, almost all sectors require
iron ores as key raw material for the production of machineries and other utilities. World
widely, in the form of steel about 20 times more iron is consumed than all the metals put
together. The increasing consumption of iron by a country is taken as the indicators of the
level of the industrial developments of the same country.
In Ethiopia, (Jimma zone) a primitive way of iron smelting had been known during the
regime of Jimma Aba Jifar and lately during the Italian occupation. Based on these
information, several studies have been conducted in different areas throughout the country
although not much have been done to determine the cumulative potential of all scale deposits
that would have considerable input to national potential. And thus, it is not yet possible to use
local ore for domestic steel factories. They depend only on imported raw materials and
recycled scrap iron. As worldwide consumption of iron in relation to industrialization is
increasing from time to time, depending on those sources would be a problem that requires
solutions. In relation to this, understanding the nature and viability of even small scale iron
occurrences becoming the demand of mining sectors nowadays to enhance the national
reserve.
This study will contribute its part in generating reliable information about the nature and
viability of iron occurrence in the current study area and providing valuable input for further
studies in the vicinity of the area, which in turn play significant role in understanding and
estimating a national ore reserve.
6
2017
Integrated Geophysical Exploration for Iron ore Deposit in, Omo Beyem, Jimma zone, South West Ethiopia
1.4. Objectives of the research project
1.4.1 Main Objectives
To understand and asses the iron prospect of Omo Beyem
1.4.2 Specific Objectives
1. To map lithologic and structural features that may have genetic or spatial association
with iron mineralization
2. To determine parameters of mineralized zone through identification and modeling of
specific anomalies
3. To determine specific parameters of ore bodies such as lateral extent, depth and dip
direction
1.5 Significances and Expected Outcome
The demand for iron ore as raw material for metallic industries is drastically increasing
nationally and internationally. As a result, the need for studying the undiscovered resources
has become critically essential to promote economic development. In this regard, this study
may contribute its part in delineating small scale resource in areas expected to have iron ore
potential and enhance the national reserve to the already confirmed ones, such as like the
Bikilal and Melka Areba iron deposits. The result of this study is expected to play significant
role inproviding the realizable geophysical information for further and extensional studies in
and around the area. Generally, after scientific data analysis had been made to recent and
previous geophysical, geological and geochemistry data, the following outcomes are
summarized:
All possible geophysical information was extracted from integrated geophysical maps
to get equivalent geological meanings
The horizontal extent, depth and dip of the ore occurrences are identified
Possible mineralization controlling structures are inferred with the boundary of
anomalies
7
2017
Integrated Geophysical Exploration for Iron ore Deposit in, Omo Beyem, Jimma zone, South West Ethiopia
Subsurface under mineralized zone is modeled to define the extents of mineralized
zone
1.6 Previous Works
Understanding the geological conditions of the study area is crucial in order to
successfully apply geophysical method and interpret the results. However, more
studies were not conducted in current area, some regional scale (1:250,000
and1:200,000 scale) works were so far performed by different scholars around the
current area. The purposes of those studies were for iron ore exploration, regional
geological mapping, and geo-hazards assessment. Therefore, to prepare this paper
some of those works were reviewed.
The geology of Jimma zone, including current study area were a studied by Mohar
(1983), Kazmine (1972), Davidsone et al. (1980) and (1983), and Golivkn.N.I (1982).
According to Golivkn.N.I (1982), Melka Sedi and Dombova localities in Mai Gudo
Mountains, are covered by volcanites of the Trap series, which have the same content
of (about 40%) concentrations of iron which related to tectonic zones. The study of
Hamral, M. (1963) using laboratory silicate analysis from pits of Mia Gudo areas
presented follow.
Table 1.2 Chemical laboratory results of samples (Golivkn.N.I, 1982)
Locality
Iliche
Fe2O3 (%)
37
SiO2 (%)
36
Kurkure
Aebicha I
Aebicha II
Sunaro
45
45
34.8
58.8
20
21
41
3.5
ore
Siliceous ore (10km from current site in west
direction)
Rich compact ore
Siliceouse ore
Unclean breccious ore
Clean compact ore
Based on assessments Hamral, M. (1963) concludes that:
The mineralization of Mia Gudo area is the result of chemical weathering of the country
rock.
Iron and manganese have been leached out of mafic minerals and precipitated to be
accumulated in residuals.
Economically important iron ores are bound to more basic rocks.
8
2017
Integrated Geophysical Exploration for Iron ore Deposit in, Omo Beyem, Jimma zone, South West Ethiopia
Due to transportation difficulties, the iron ore in Mai Gudo area shows very small
economic importance for the time being.
Recently, GSE conducted both geological and geophysical reconnaissance survey in Omo
Beyem and Kersa woredas in (Jimma zone) for iron ore exploration in 2016. The surveys
were conducted in Meti Segada, Omo Duri, Gato and Bulbul Kebeles. Gamma ray
spectrometry, magnetic and IP/R data were acquired as a result. Even though, the technical
reports are not yet completed, the progress report indicates the necessity of detail geophysical
work to prove if the iron occurrence observed during survey is a surface manifestation or has
extents.
1.7 Methodologies
To achieve the objective of the research and answer the proposed questions according to the
proposal, several steps were taken. Secondary data and respective reports were collected from
GSE resource center and internet. As a result, different literatures were reviewed and finally
integrated geophysical methods (Magnetic, IP/Resistivity and Gamma ray spectrometry)
surveys as summarized in table 1.3 and remote sensing were employed.
Table 1.3: The details of the survey grids and summary statistics
Area
Meti Segeda
Geographic coordinate
37° 22' 0.37" E–37° 22' 31.59" E
7° 32' 56.37" N–7° 33' 20.57" N
Line orientation
N-S for Magnetic and
Radiometric, E-W for
IP/R and VES
Summary grid statistics of the geophysical survey
No
Geophysical
Method
No. of
lines
Sampling interval
1
Total field
Magnetic
8
2
IP/Resistivity
3
4
Total
100mX20m
No of
observation/
No of Dipoles
134
Volume of
Work (Line
Km
2.8
5
50mX20m
141
3.5
Radiometry
14
50mX20m
227
4.3
VES
(Schlumberger
Array)
1
150m
3
-
28
-
505
10.6
9
Area (Km2)
0.71Km2
Instrumentation
IGS-2/MP4 Proton
Precession
Magnetometer
IPR-12 Receiver
3kw-TSQ-2
Transmitter
GAD-6 Gamma-Ray
Spectrometers
Scintrex made TSQ2 Transmitter and
IPR-10A receiver
2017
Integrated Geophysical Exploration for Iron ore Deposit in, Omo Beyem, Jimma zone, South West Ethiopia
Fifteen days field work was conducted to collect geophysical data along selected profiles
(crossing the strike of assumed anomaly) according to base map prepared during pre-field
period. Some rock samples were taken from site for thin section, major oxide and petrophysics investigation. Relevant field photos and necessary notes were acquired as well.
Remote sensing satellite imagery data processing was employed to map iron oxide alteration
zone.
1.7.1 Rock Samples Collections
To help geophysical data interpretation process, seventeen rock samples were collected
(Figure 1.4a) from the host rock and mineralized zone for thin section investigation, rock slab
preparation and major oxides investigation. Samples were coded and their respective
location, elevations and descriptions were recorded during collection. All information of rock
samples were entered into computer and fourteen samples were selected and submitted to
Geological Survey of Ethiopia to Chemical and Geotechnical laboratories. Accordingly, the
compositions for six samples (from iron bearing zone) were determined. Thin sections for
twelve samples were
prepared and their representation of rock and mineral types determined. Petro physical
parameter (magnetic susceptibility) from twelve rock slabs was measured (Figure1.4b) using
Norwegian made magnetic susceptibility meter. Before measuring susceptibility; the meter
was calibrated using its own calibration sample. Slabs of rock samples prepared in laboratory
with an approximate dimension of 4x2x2cm were inserted into the sensor of susceptibility
meter and reading was taken from its six faces and the average of those is considered as the
susceptibility values of the same sample.
10
2017
Integrated Geophysical Exploration for Iron ore Deposit in, Omo Beyem, Jimma zone, South West Ethiopia
b
a
Figure 1.3: Field rock sample collection (a) and Magnetic susceptibility measurement (b)
Susceptibilities that were measured in CGS unit were converted into SI unit by the relation of
kmSI unit = km cgs 4 unit; were km is magnetic susceptibility. Measured susceptibilities (km)
range between 174.584 SI units to 8063.52 SI units as shown table1.4. All information of the
thin sections analysis and iron oxide composition of rock samples with their measured
susceptibilities were used during geophysical data interpretation.
11
2017
Integrated Geophysical Exploration for Iron ore Deposit in, Omo Beyem, Jimma zone, South West Ethiopia
Table 1.4: Laboratory results for susceptibility (k) measurements and (SiO2 and Fe2O3)
concentration for rock samples
Sample ID
X
Y
SiO2 (%)
Fe2O3 (%)
k(SI)
MT01
320248
835128
MT02
320291
835145
38.4
40.68
1159.28
MT03
320331
835152
29.96
52.24
1875.2
MT04
320434
835231
174.584
MT05
320415
835070
369.264
MT06
320524
835098
8063.52
MT07
320415
835328
231.104
MT09
320225
835112
458.44
MT10
320326
835164
MT11
320224
834710
MT12
320047
834916
MT 13
320440
835290
282.6
MT 14
320220
835110
175.84
MT 15
320220
835110
481.048
MT16
320390
835110
42.84
34.96
Tr-2-1
Tr-2-2
320457
320458
835309
835309
10.4
47.56
66
30
226.08
39.46
35.88
639.304
360.472
1072.62
[
1.8.2 Remote Sensing: Thermal Emission and Reflection Radiometer (ASTER)
Iron alteration distributions were detected in wider zone around current study area by using
ASTER Imagery data with Qgis software. Band ratio of B2 to B1 was used to enhance the
small contribution of iron oxide minerals to discriminate iron bearing zone shown in figure
5.38.
12
2017
Integrated Geophysical Exploration for Iron ore Deposit in, Omo Beyem, Jimma zone, South West Ethiopia
1.9 Structures of Thesis
This thesis has been developed as a series of chapter that are connected each other.
Chapter I: Introduction
Chapter II: Geology of the area (regional and local geology)
Chapter III Basic principles of geophysical methods
Chapter IV: Geophysical Exploration (data acquisitions, processing and presentation)
Chapter V: Interpretation and Discussion
Chapter VI: Integrated Interpretation
Chapter VII: Conclusions and Recommendations
13