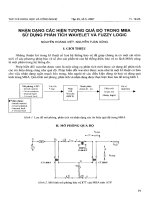
Fuzzy logic 821 3154 1 PB
Bạn đang xem bản rút gọn của tài liệu. Xem và tải ngay bản đầy đủ của tài liệu tại đây (621.08 KB, 12 trang )
Institute of Advanced Engineering and Science
International Journal of Information & Network Security (IJINS)
Vol.1, No.4, October 2012, pp. 294~305
ISSN: 2089-3299
294
Performance evaluation of data clustering techniques using
KDD Cup-99 Intrusion detection data set.
A. M. Chandrashekhar*,
K. Raghuveer**
* Department of Computer Science & Engg, S. J. College of Engineering (SJCE), Mysore, Karnataka, India.
** Department of Information Science, National Institute of Engineering (NIE), Mysore, Karnataka, India.
Article Info
ABSTRACT
Article history:
th
Received Jun 12 , 2012
Revised Aug 20th, 2012
Accepted Sept 02nd , 2012
Keyword:
Data mining
Fuzzy c-means
K-means clustering
Mountain-clustering
subtractive-clustering
network security
Intrusion detection systems aim at detecting attacks against
computer systems and networks or, in general, against information systems.
A number of techniques are available for intrusion detection. Data mining is
the one of the efficient technique among them. Intrusion detection and
clustering have forever been hot topics in the area of machine learning. Data
clustering is a procedure of putting related data into groups. Clustering
procedure clusters the data into groups with the property of inter-group
similarity and intra-group dissimilarity. A clustering technique partitions a
data-set into several groups such that the likeness within a group is larger
than amongst groups. Clustering as an intrusion detection technique has long
before proved to be beneficial.
This paper evaluates four most representative off-line clustering
techniques:
k-means clustering, fuzzy c-means clustering, Mountain
clustering, and Subtractive-clustering. These techniques are implemented and
tested against KDD cup-99 data set, which is used as a standard benchmark
data set for intrusion detection. Performance and accuracy of the four
techniques are presented and compared in this paper. Results shows Accuracy
of K-means is 91.02%, FCM is 91.89%, Mountain clustering is 75% and
Subtractive clustering is 78.27%. The experimental outcomes obtained by
applying these algorithms on KDD cup-99 data set demonstrate that k-means
and fuzzy c-means clustering algorithms perform well in terms of accuracy
and computation time.
Copyright @ 2012 Insitute of Advanced Engineeering and Science.
All rights reserved.
Corresponding Author:
A. M. Chandrashekhar,
Dept. Of Computer Science & Engineering,
Sri. Jayachamarajendra College of Engin eering(SJCE),
Mysore-57006, Karnataka, India.
1.
INTRODUCTION
Intrusion detection is the process of observing and analysing the events taking place in a computer
system in order to discover signs of security problems. Over the past ten years, intrusion detection and other
security technologies such as cryptography, authentication, and firewalls have increasingly gained in
importance. However, intrusion detection is not yet a perfect technology. This has given data mining the
opportunity to make several important contributions to the field of intrusion detection. In intrusion detection,
an object is a single observation of audit data and/or network packets after the values from selected features
have been extracted. Hence, values from selected features, and one observation, define one object (or vector).
If we have values from n number of features, the vector (or object plot) fits into an n-dimensional coordinate
system (Euclidean space).
A cluster is a group of data objects that are analogous to one another inside the same cluster and are
divergent to the objects in other clusters. The method of grouping a set of physical or intangible objects into
Journal homepage: IJINS
w w w . i a e s j o u r n a l . c o m
IJINS
ISSN: 2089-3299
295
set of similar objects is called clustering. Data clustering is considered an interesting approach for finding
similarities in data and putting similar data into groups. Clustering partitions a data-set into several troops
such that the similarity within a troop is larger than that among troops [1]. Clustering does not rely on
predefined classes and class labelled training examples. That‟s why; clustering is a type of learning by
observation.
In this paper, four of the most representative off-line clustering techniques are reviewed: K-means
clustering, Fuzzy c-means clustering, Mountain clustering and Subtractive clustering.These techniques are
usually used in conjunction with Radial Basis Function Networks (RBFNs) and Fuzzy Modelling. These four
techniques are implemented and tested against a KDD cup 99 data set which is used as a bench mark data set
for intrusion detection research. The results are presented with a comprehensive comparison of the different
techniques and the effect of different parameters in the process.
The remainder of this paper is structured as follows. Section 2 presents background of IDS, data
mining, clustering and KDD cup 99 data set. Section 3 presents each of the four clustering techniques in
detail along with the underlying mathematical foundations. Section 4 introduces the implementation of the
techniques and goes over the results of each technique, followed by a comparison of the results. A brief
conclusion is presented in Section 5.
2.
BACKGROUND
This section presents principal concepts of intrusion detection system (IDS), an intrusion detection
dataset (KDD cup-99), Data mining and clustering.
2.1 Intrusion detection systems:
With the enormous growth of computer networks usage and the huge increase in the number of
applications running on top of it, network security is becoming increasingly more important. As all the
computer systems suffer from security vulnerabilities which are both technically difficult and economically
costly to be solved by the manufacturers. Therefore, the role of IDS, as special-purpose devices to detect
anomalies and attacks in the network, is becoming more important.
An intrusion detection system (IDS) is a component of the information security framework. An
intrusion is defined as any set of actions that compromise the integrity, availability or confidentiality of a
resource. Intrusion detection is an important task for information infrastructure security. Its main goal is to
differentiate between normal activities of the system and behaviour that can be classified as suspicious or
intrusive. As depicted in the figure-1, the goal of intrusion detection is to build a system which would
automatically scan network activity and detect such intrusion attacks. Once an attack is detected, the system
administrator can be informed, who can take appropriate action to deal with the intrusion.
Figure 1. Intrusion Detection process.
One major challenge in intrusion detection is that we have to identify the camouflaged intrusions
from a huge amount of normal communication activities. It is demanding to apply data mining techniques to
detect various intrusions. Data mining is capable of identifying legitimate, novel, potentially useful, and
eventually understandable patterns in massive data.
Performance evaluation of data clustering tehniques using KDD Cup-99 ID data set (A.M.Chandrashekhar)
296
ISSN: 2089-3299
2.2 Data Mining and Clustering
The term data mining is frequently used to designate the process of extracting useful information
from large databases. The term knowledge discovery in databases (KDD) is used to denote the process of
extracting useful knowledge from large data sets. Data mining, by contrast, refers to one particular step in
this process, which ensures that the extracted patterns actually correspond to useful knowledge. Data mining
refers to a set of procedures that use the process of excavating previously unknown but potentially valuable
data from large stores of past data. Data mining techniques basically correspond to pattern discovery
algorithms, but most of them are drawn from related fields like machine learning or pattern recognition.
As per Wikipedia, “clustering is the classification of similar objects into different groups, or more
precisely, the partitioning of a data into subsets (clusters), so that the data in each subset (ideally) share some
common trait-often proximity according to some defined distance measure. By clustering, one can spot dense
and sparse regions and consequently, discover overall distribution sample and interesting relationship among
data attributes. Clustering algorithms are used extensively not only to organize and categorize data, but are
also useful for data compression and model construction. By finding similarities in data, one can represent
similar data with fewer symbols for example. Also if we can find groups of data, we can build a model of the
problem based on those groupings. Another reason for clustering is to discover relevance knowledge in data.
Clustering is a challenging field of research as it can be used as a separate tool to gain insight into
the allocation of data, to observe the characteristic feature of each cluster, and to spotlight on a particular set
of clusters for more analysis. The advantage of applying Data Mining technology to the Intrusion Detection
System lies in its ability of mining the succinct and precise characters of intrusions in the system from large
quantities of information automatically. It can solve the problem of difficulties in picking-up rules and in
coding of the traditional Intrusion Detection system.
2.3 KDD Cup-99 Intrusion Detection Data set
The KDD Cup-99 data set was created by processing the TCP-dump segment of 1998 DARPA
Intrusion Detection System evaluation dataset. This data set is prepared by Stolfo et al. Of Lincoln Labs,
U.S.A[2]. DARPA-98 is about 4 gigabytes of compressed raw (binary) TCP-dump data of 7 weeks of
network traffic, which can be processed into about 5 million connection records, each with about 100 bytes.
The two weeks of test data have around 2 million connection records. KDD cup-99 is the data-set used for
Third International Knowledge Discovery and Data Mining Tools contest, which was held in concurrence
with KDD Cup-99, the Fifth International Conference on Knowledge Discovery and Data Mining. Since
1999, KDD Cup-99 has been the most wildly used data set for the evaluation of anomaly detection methods
[3].
KDD Cup-99 training dataset consists of approximately 4, 90,000 single connection vectors each
of which contains 41 features and is labelled as either normal or an attack, with exactly one specific attack
type. The data set contains a total of 24 attack types(connections) that fall into one of the 4 major categories:
Denial of service(DOS), Probe/scan, User to Root(U2R)and Remote to User(R2L). A complete listing of the
set of features given in KDD cup 99 dataset defined for the connection vectors is given in Srilatha Chebrolu
et.al [4].
3.
CLUSTERING TECHNIQUES
Clustering is significant task in mining evolving data streams. The method of grouping a set of
physical or conceptual objects into classes of related objects is called clustering. By definition, “cluster
analysis is the art of finding groups in data”. Clustering can be achieved by applying various algorithms that
vary significantly in their perception of what makes up a cluster and how to ably find them. The appropriate
clustering algorithm and parameter settings (for instance, the number of likely clusters, the distance function
to use or a density threshold) depend on the individual data-set and intended use of the results.
A clustering algorithm tries to find natural groups of components/data based on some similarity.
In addition, the clustering algorithm locates the centroid of a group of data-sets. To determine cluster
membership, the majority of algorithms evaluate the distance among a point and the cluster centroid. The
output from a clustering algorithm is fundamentally a statistical description of the cluster centroid with the
number of elements in each cluster.
3.1 Classification of Clustering Algorithms
As shown in the figure-2, there are essentially two types of clustering methods: hierarchical
clustering and partitioning clustering. In hierarchical clustering once groups are found and objects are assigned
to the groups, this assignment cannot be changed. In case of partitioning clustering, the assignment of objects
into groups may change during the algorithm application. Further, the Partitioning clustering are categorised in
to hard clustering and soft clustering. Hard Clustering is based on mathematical set theory i.e. either a data
IJINS Vol. 1, No. 4, October 2012 : 294 – 305
IJINS
ISSN: 2089-3299
297
point belong to a particular cluster or not. k-means clustering is of type hard clustering. Soft Clustering is
based on fuzzy set theory i.e. a data point may partially belong to a cluster. Fuzzy c-means is of type soft
clustering.
Clustering algorithms can also be classified based on different parameters. Based on the number of
clusters to be formed is well known in advance or not, clustering algorithms can be classified priori or
a-priory clustering algorithms. Since number of clusters are well known in advance, priory algorithms tries to
partition the data into the given number of clusters. Since k-means and fuzzy c-means clustering algorithms
needs a priori knowledge of the number of clusters, they belong to priory type. In the case of a-priory, since
number of clusters are not known in advance, the algorithm starts by finding the first large cluster, and
then goes to find the second, and so on. Mountain and Subtractive clustering algorithms are examples for
this type. In both cases a problem of known cluster numbers can be applied; however if the number of
clusters is not known, k-means and Fuzzy c-means clustering cannot be used.
Figure 2. Classification of clustering algorithms.
Another aspect of classification of clustering algorithms is their ability to be implemented in
on-line or off-line mode. On-line clustering is a process in which each input vector is used to update the
cluster centers according to this vector position. The system in this case learns where the cluster centers are
by introducing new input every time. In off-line mode, the system is presented with a training data set, which
is used to find the cluster centers by analyzing all the input vectors in the training set. Once the cluster
centers are found they are fixed, and they are used later to classify new input vectors. The techniques
presented here are of the off-line type and are intended to find cluster centers that will represent each cluster.
A cluster centre is a way to tell where the heart of each cluster is located, so that later when
presented with an input vector, the system can tell which cluster this vector belongs to by
measuring a similarity metric between the input vector and all the cluster centers, and determining
which cluster is the nearest or most similar one. The description of all the four techniques considered here
are presented below.
3.1.1 K-means Algorithm
The k-means clustering algorithm is a classical and well known clustering algorithm. In this
algorithm, after an initial random assignment of data points to K clusters, the centres of clusters are computed
and the data points are allocated to the clusters with the closest centres. The process is repeated until the
cluster centres do not significantly change. Once the cluster assignment is fixed, the mean distance of a data
point to cluster centres is used as the score [5]. K-means algorithm is given in figure-3.
K-means clustering algorithm is well known data mining algorithms that can be used in
anomaly detection. It has been used in an attempt to detect anomalous user behaviour, as well as unusual
behaviour in network traffic. As the algorithm iterates through the data set, each cluster‟s architecture is
updated. In updating clusters, data points are removed from one cluster and added to another. The updating of
clusters causes the values of the centroids to change. This change is a reflection of the current cluster data
points. Once there are no changes to any cluster, the training of the k-means algorithm is complete. At the
end of the k-means algorithm, the „k‟ cluster centroids are created and the algorithm is ready for classifying
traffic.
The k-means clustering algorithm is based on finding data clusters in a data set by keeping
minimized cost function of dissimilarity measure. In most cases this dissimilarity measure is chosen as the
Performance evaluation of data clustering tehniques using KDD Cup-99 ID data set (A.M.Chandrashekhar)
298
ISSN: 2089-3299
Euclidean distance. For each data point to be clustered, the cluster centroid with the minimal euclidean
distance from the data point will be the cluster for which the data point will be a member.
A set of n vectors Xj , j = 1,… ,n, are to be partitioned into C groups Gi , i=1,…,C. The cost
function, based on the Euclidean distance between a vector xk in group j and the corresponding cluster centre
Ci , can be defined by:
(1)
2
Where j=
is a cost function within group i. There are two problems that are inherent
to k-means clustering algorithms. The first is determining the initial partition and the second is determining
the optimal number of clusters [6]. The performance of the k-means algorithm depends on the initial
positions of the cluster centres, thus it is advisable to run the algorithm several times, each with a
different set of initial cluster centres.
Figure 3. The k-means clustering algorithm.
3.1.2
Fuzzy c-means Algorithm
Fuzzy c-means algorithm is an improvement over earlier k-means algorithm and also known as
fuzzy ISODATA. It was proposed by Bezdek as extension to Dunn‟s algorithm to generate fuzzy sets for
every observed feature in1973[7].
It is practical that data points can fit in to more than one cluster, and connected with each of the
points are membership grades, which indicate the degree to which the data points belong to the different
clusters. The fuzzified c-means algorithm permits each data point to be a member of a cluster to a degree
indicated by a membership grade, and therefore each point may fit in to several clusters. In fuzzy clustering,
points on the border of the cluster may be in the cluster to a smaller degree than points in the centre of
cluster. Fuzzy c-means is applying fuzzy logic on k-means partitions based on mean of data points. The
Fuzzy c-means algorithm is given in figure-4. FCM algorithm partitions a collection of data points specified
by m-dimensional vectors into „c‟ fuzzy clusters, and locate a cluster centre in each, minimising an objective
function. Fuzzy c-means clustering involves two processes: the calculation of cluster centres and the
assignment of points to these centres using a form of Euclidian distance. This process is recurring
until the cluster centres stabilize. The algorithm is similar to k-means clustering in many ways but it
assigns a membership value to the data items for the clusters within a range of 0 to 1. Fuzzy c-means is
differing from hard c-means, mainly because it makes use of fuzzy partitioning. As k-means, Fuzzy c-means
algorithm relies on minimizing a cost function of dissimilarity measure.
IJINS Vol. 1, No. 4, October 2012 : 294 – 305
IJINS
ISSN: 2089-3299
299
FCM is an iterative algorithm to find cluster centres that minimize a dissimilarity function. Rather than
partitioning the data into a collection of distinct sets by fuzzy partitioning, the membership matrix U is
randomly initialized according to equation (2) given below.
The dissimilarity function used here is given equation-3.
m € [1, ∞ ] is a weighting exponent. There is no prescribed manner for choosing the exponent parameter,
„m‟. In practice, m=2 is common choice, which is equivalent to normalizing the coefficients linearly to make
their sum equal to 1. When m is close to 1, then the cluster centre closest to the point is given much larger
weight than the others and the algorithm is similar to k-means. To reach a minimum of dissimilarity function
there are two conditions. These are given in (4) and (5).
By iteratively renewing the cluster centres and the membership grades for every data point, FCM
iteratively shifts the cluster centres to the „right‟ place within a data set. FCM does not ensure that it
converges to an optimal solution, because the cluster centres are randomly initialised. Though, the
performance depends on initial centroids, there are two ways as described below for a robust approach in this
regard. First one, using an algorithm to determine all of the centroids and the second is run FCM several
times each starting with different initial centroids. More mathematical details about the objective function
based clustering algorithms can be found in [8].
Figure 4. The Fuzzy c-means Clustering algorithm
Performance evaluation of data clustering tehniques using KDD Cup-99 ID data set (A.M.Chandrashekhar)
300
ISSN: 2089-3299
3.1.3. Mountain Clustering Algorithm
K-means and FCM Clustering algorithms typically require the user to pre-specify the number of
cluster centres and their initial locations. The quality of the solution depends strongly on the choice of initial
values like the number of cluster centres and their initial locations. Yager and Filev [9] proposed a simple
and effective algorithm, called the mountain method, for estimating the number and initial location of cluster
centres. The mountain clustering approach is a simple way to find cluster centres based on a density measure
called the mountain function. This method is a simple way to find approximate cluster centres, and can be
used as a pre-processor for other sophisticated clustering methods.
This technique builds and calculates a mountain function (or density function) at every possible
position (or grid) in the data space, and chooses the position with the greatest density value as the centre of
the first cluster. It then destructs the effect of the first cluster mountain function and finds the second cluster
centre and so on. This process is repeated until the desired number of clusters has been found.
Mountain clustering is based on gridding the data space and computing a potential value for each
grid point based on its distances to the actual data points. A grid point with many data points nearby will
have a high potential value. The grid point with the highest potential value is chosen as the first cluster
centre. The key idea in their method is that once the first cluster centre is chosen, the potential of all grid
points is reduced according to their distance from the cluster centre. Grid points near the first cluster centre
will have greatly reduced potential. The next cluster centre is then placed at the grid point with the highest
remaining potential value. This procedure of acquiring new cluster centre and reducing the potential of
surrounding grid points repeats until the potential of all grid points falls below a threshold. In other words,
this process continues until a sufficient number of clusters is attained. The mathematical equations used for
density measure and other related equations are available in [10]. Although this method is simple and
effective, the computation grows exponentially with the dimension of the problem because the mountain
function has to be evaluated at each grid point.
3.1.4 Subtractive clustering Algorithm
S. L. Chiu [11] proposed an extension of Yager and Filev‟s mountain method, called subtractive
clustering. Suppose that there is no clear idea of how many clusters there should be for a specified set of data,
Subtractive clustering is a quick, one-pass algorithm for approximation of cluster centres and the number of
clusters in a given set of data.
The problem with the previously discussed mountain clustering is that its computation grows
exponentially with the dimension of the problem; that is because the mountain function has to be evaluated at
each grid point. Subtractive clustering solves this problem by using data points as the candidates for cluster
centres, instead of grid points as in mountain clustering. The technique used in subtractive algorithm is
similar to mountain clustering, except that instead of calculating the density function at every possible
position in the data space, it uses the positions of the data points to calculate the density function, thus
reducing the number of calculations significantly, making it linearly proportional to the number of input data
instead of being exponentially proportional to its dimension. This means that the computation is now
proportional to the problem size instead of the problem dimension.
Consider a collection of m data points {X1. . . .Xm} in an N-dimensional space. Subtractive
clustering assumes each data point as a potential cluster centre and calculates a measure of the potential for
each data point based on the density of surrounding data points. The algorithm selects the data point with the
highest density measure as the first cluster centre and then eradicates the potential of data points near the first
cluster centre. The algorithm then selects the data point with the highest remaining potential (next highest
density measure has been remained) as the next cluster centre and eradicates the potential of data points near
this new cluster centre. This Process of acquiring a new cluster centre and eradicating the potential of
surrounding data-points repeats until the potential of all data points fall below a threshold [12]. The range of
influence of a cluster centre in each of the data dimensions is called cluster radius. The cluster radius
specifies the range of influence of a cluster when you think the data space as a single hypercube. A small
cluster radius will lead to find many small clusters in the data (resulting in many rules) and vice versa. The
mathematical equations used for density measure and other related equations are available in [13].
The problem with this method is that sometimes the actual cluster centres are not necessarily
located at one of the data points. However, this method provides a good approximation, especially with the
reduced computation that this method offers. It also eliminates the need to specify a grid resolution, in which
tradeoffs between accuracy and computational complexity must be considered. The subtractive clustering
method also extends the mountain method‟s criterion for accepting and rejecting cluster centres.
IJINS Vol. 1, No. 4, October 2012 : 294 – 305
IJINS
ISSN: 2089-3299
301
4 EXPERIMENTAL SET-UP AND RESULTS
This section describes the experimental set-up, results and performance evaluation of the proposed
technique. We used MATLAB for implementation of all the four algorithms. KDD cup-99 dataset is used for
experimental evaluation, as discussed earlier. It is very hard to execute the proposed technique on the KDD
cup- 99 dataset for estimating the performance, because it is a large scale and in order to compare the
performance of techniques considered, we used a 10% subset of original KDD Cup-99 data set. We prepared
the data set by dividing intrusions records of 10% KDD cup 99 data set in to two half‟s, one half is used for
Training and another for Testing. The whole data set consists of 54,226 data records, during training we
considered 27,114 data records and during testing we considered 27,114 data records.
Attributes in the KDD Cup data sets had all forms of data like continuous, discrete, and symbolic,
with significantly varying resolution and ranges. Most pattern classification methods are not able to process
data in such a format. Hence pre-processing was required. Pre-processing consisted of two steps: first step
involved mapping symbolic-valued attributes to numeric-valued attributes and second step implemented
scaling. Attack names (like buffer-overflow, guess-passwd, etc.) were first mapped to one of the five
classes, 0 for Normal, 1 for Probe, 2 for DOS, 3 for U2R, and 4 for R2L, as described in [14].
This study involves the implementation of each of the four techniques introduced in previous
section and testing each one of them on 10% KDD cup 99 data set related to intrusion detection which was
disused in section 2.3. Since there are 4 categories of attacks records (DOS, PROBE, R2L, and URL) & a
normal (non attack) records are in KDD cup-99 data set, the number of clusters into which the data set is to
be partitioned is five clusters. Because of the high number of dimensions in the problem (34-dimensions), no
visual representation of the clusters can be presented only 2D and 3D clustering problems can be visually
inspected. Here, we rely on performance measures to evaluate the clustering techniques under consideration.
As mentioned earlier; the similarity metric used to calculate the similarity between an input vector and a
cluster centre is the Euclidean distance.
Each clustering algorithm is presented with the training data set, and as a result five clusters formed.
The data in the evaluation set is then tested against the found clusters and an analysis of the results is
conducted. The following sections present the results of each clustering technique, followed by a comparison
of the four techniques.
4.1 Evaluation of k-means clustering
Since the k-means algorithm initializes the cluster centres randomly, its performance is affected by
those initial cluster centres. So, several runs of the algorithm is advised to have better results therefore the
algorithm was tested for ten times to determine the best performance.
Evaluation of the algorithm is realized by testing the accuracy of the evaluation set. After the cluster
centres are determined, the evaluation data vectors are assigned to their respective clusters according to the
distance between each vector and each of the cluster centres. An error measure, the root mean square error
(RMSE) is then calculated; is used for this purpose. Also an accuracy measure is calculated as the percentage
of correctly classified vectors. To further measure how accurately the identified clusters represent the actual
classification of data, a regression analysis is performed of the resultant clustering against the original
classification. Performance is considered better if the regression line slope (RLS) is close to 1. The algorithm
was tested for 10 times to determine the best performance. Table 1 lists the results. As seen from the results,
the best case achieved 91.02% accuracy and an RMSE of 0.22 and regression slope is 0.8.
Table 1: Performance Result of k-means Clustering.
No-of-Tests
1
2
3
4
5
6
7
8
9
10
RMSE
0.21
0.22
0.30
0.29
0.30
0.30
0.22
0.29
0.22
0.29
RLS
0.7
0.8
0.62
0.69
0.62
0.62
0.8
0.74
0.8
0.74
Accuracy
90.23%
91.02%
84.78%
87.82%
84.78%
84.78%
91.02%
87.82%
91.02%
87.82%
Performance evaluation of data clustering tehniques using KDD Cup-99 ID data set (A.M.Chandrashekhar)
302
ISSN: 2089-3299
4.2 Evaluation of Fuzzy c-means clustering
As it is the case in k-means clustering, FCM starts by assigning random values to the membership
matrix U, thus several runs have to be conducted to have higher probability of getting good performance.
However, the results showed no variation in performance or accuracy when the algorithm was run for several
times. For testing the results, every vector in the evaluation data set is assigned to one of the clusters with a
certain degree of belongingness (as done in the training set).The same performance measures applied in kmeans clustering will be used here; however only the effect of the weighting exponent „m‟ is analyzed, since
the effect of random initial membership grades has insignificant effect on the final cluster centres. Table 2
lists the results of the tests with the effect of varying the weighting exponent „m‟.
As seen from the results, the best case (Weighing Exponent m=8) achieved 91.89% accuracy and
an RMSE of 0.28. It is noticed that very low or very high values for m reduces the accuracy; moreover high
values tend to increase the time taken by the algorithm to find the clusters.
Table 2: Performance Result of Fuzzy c-means clustering
Weighing
Exponent ‘m’
1
2
5
8
10
12
15
RMSE
RLS
Accuracy
0.31
0.30
0.22
0.28
0.22
0.38
0.42
0.67
0.62
0.62
0.69
0.74
0.71
0.68
83.57%
84.79%
91.36%
91.89%
91.22%
84.79%
82.97%
4.3 Evaluation of Mountain clustering
Mountain clustering relies on dividing the data space into grid points and calculating a mountain
function at every grid point. This mountain function is a representation of the density of data at this point.
The performance of mountain clustering is severely affected by the dimension of the problem; the
computation needed rises exponentially with the dimension of input data because the mountain function has
to be evaluated at each grid point in the data space. So for the problem at hand, with input data of 34dimensions, 2700 training inputs, and a grid size of 10 per dimension, the required number of mountain
function calculation obviously seems to be impractical for our problem
In order to be able to test this algorithm, the dimension of the problem has to be reduced to a
reasonable number; say, 8-dimensions. This is achieved by randomly selecting 8 variables from the input
data out of the original and performing the test on those variables. Several tests involving differently selected
random variables are conducted in order to have a better understanding of the results. Table 3 lists the results
of 10 test runs of randomly selected variables.
Table 3: Performance Result of Mountain Clustering.
No-of-Tests
1
2
3
4
5
6
7
8
9
10
RMSE
0.46
0.36
0.46
0.39
0.49
0.47
0.46
0.43
0.44
0.38
RLS
0.55
0.75
0.54
0.71
0.63
0.55
0.56
0.69
0.35
0.75
Accuracy
73.0%
83.0%
73.0%
81.0%
76.0%
73.0%
73.0%
77.0%
57.0%
83.0%
The accuracy achieved ranged between 57% and 83% with an average of 75%, and average RMSE
of 0.41. These results are quite discouraging compared to the results achieved in k-means and FCM
clustering. This is due to the fact that not all of the variables of the input data contribute to the clustering
process; only 8 are chosen at random to make it possible to conduct the tests.
IJINS Vol. 1, No. 4, October 2012 : 294 – 305
IJINS
ISSN: 2089-3299
303
However, with only 8 attributes chosen to do the tests, mountain clustering required far much more
time than any other technique during the tests; this is because of the fact that the number of computation
required is exponentially proportional to the number of dimensions in the problem. So apparently mountain
clustering is not suitable for problems of dimensions higher than two or three.
4.4 Evaluation of Subtractive clustering
This method is similar to mountain clustering, with the difference that a density function is
calculated only at every data point, instead of at every grid point. So the data points themselves are the
candidates for cluster centres. This has the effect of reducing the number of computations significantly,
making it linearly proportional to the number of input data instead of being exponentially proportional to its
dimension.
Since the algorithm is fixed and does not rely on any randomness, the results are fixed. However,
we can test the effect of the two variables ra and rb on the accuracy of the algorithm. Those variables
represent a radius of neighbourhood after which the effect (or contribution) of other data points to the density
function is diminished. Usually the rb variable is taken to be as 1.5 ra . Table 4 shows the results of varying ra.
Table 4: Performance Result of Subtractive Clustering.
Neighbourhood radius ra
0.1
0.3
0.4
0.5
0.6
0.8
RMSE
0.32
0.38
0.44
0.46
0.46
0.48
RLS
0.43
0.44
0.47
0.50
0.50
0.62
Accuracy
80.33%
81.14%
79.26%
78.27%
78.27%
72.43%
As seen from table 4, the maximum achieved accuracy was 78% with an RMSE of 0.46. Compared
to k-means and FCM, this result is a little bit behind the accuracy achieved in those techniques.
4.5 Results comparison and review
According to the previous discussion of the implementation of the four data clustering techniques
and their results, it is useful to summarize the results and present some comparison of performances. A
summary of the best achieved results for each of the four clustering techniques is presented in Table 5. The
comparative results expressed in graphical form are shown in Figure 5.
Table 5. Result comparison of clustering techniques.
Clustering
Algorithms
K-means
Fuzzy c-means
Mountain
Subtractive
Comparison aspect
RMSE
0.22
0.28
0.41
0.46
RLS
0.8
0.69
0.6
0.50
Accuracy
91.02%
91.89%
75.00%
78.27%
From this comparison, we can conclude some remarks:
K-means clustering produces fairly higher accuracy and lower RMSE than the other techniques.
Fuzzy-c-means produces close results to k-means clustering; however it requires more computation time than
k-means since fuzzy measures calculations complicated the algorithm. In general, the FCM technique
showed no strong improvement over the k-means clustering for this problem. Both showed close accuracy;
moreover FCM was found to be slower than k-means because of fuzzy calculations.
Mountain clustering has a very poor performance regarding its requirement for huge number of
computation and low accuracy. However, we have to notice that tests conducted on mountain clustering
were done using part of the input variables in order to make it feasible to run the tests. Mountain clustering
is suitable only for problems with two or three dimensions. In subtractive clustering, care has to be taken
when choosing the value of the neighbourhood radii, since too small radii will result in neglecting the effect
of neighbouring data points, while large radii will result in a neighbourhood of all the data points thus
cancelling the effect of the cluster.
Performance evaluation of data clustering tehniques using KDD Cup-99 ID data set (A.M.Chandrashekhar)
304
ISSN: 2089-3299
1
RMSE
0.8
RLS
0.6
Accuracy
0.4
0.2
0
K-means
F-C-means
Mountain
Subtractive
Figure. 5. Performance comparison of clustering algorithms.
5
CONCLUSION
Intrusion detection is an essential component of layered computer security mechanism. It requires
accurate and efficient models for analysing a large amount of system and network audit data. Data mining
techniques make it capable to search large quantity of data for distinctive rules and patterns. If correlated to
network monitoring information recorded on a host or in a network, they can be used to identify intrusions,
attacks and/or abnormalities. Clustering is a key task of explorative data mining. The main advantage that
clustering provides is the ability to learn from and detect intrusions in the audit data, while not requiring the
system administrator to provide explicit description of various attack types. As a result, the amount of
training data that needs to be provided to the anomaly detection system is reduced.
In this paper we discussed the overview of performance evaluation of data mining techniques, in
particular clustering techniques used to build intrusion detection model. Four clustering techniques have been
reviewed in this paper, namely: k-means, Fuzzy c-means, Mountain and Subtractive clustering. The four
methods have been implemented and tested against an intrusion detection data set called KDD cup-99. The
comparative study done here is concerned with the accuracy of each algorithm, with care being taken toward
the efficiency in calculation and other performance measures like RMSE and RLS. The problem presented
here is of high number of dimensions. The FCM technique showed no strong improvement over the k-means
clustering for this problem. Both showed close accuracy (accuracy of FCM is 91.89% and K-means is
91.02%); moreover FCM was found to be slower than k-means because of fuzzy calculations. However in the
problems where the number of clusters is not known, k- means and FCM cannot be used to solve, leaving the
choice only to mountain or subtractive clustering. Mountain clustering(accuracy is 75%) is not a good
techniques for problems with this high number of dimensions due to its exponential proportionality to
the dimension of the problem. With subtractive clustering (accuracy is 78.27%), result is a little bit behind
the accuracy achieved compared to k-means and FCM techniques. K-means clustering seemed to over
perform the other techniques for this type of problem.
Finally, the clustering techniques discussed here do not have to be used as stand-alone approaches;
they can be used in conjunction with other neural or fuzzy systems for further refinement of the overall
system performance.
REFERENCES
Jang J.S. R., Sun, C.-T., Mizutani, E., “Neuro-Fuzzy and Soft Computing – A Computational Approach to Learning
and Machine Intelligence”, Engleword cliffs, NJ; Prentance Hall, pp 640, ISBN 0-13-261066-3.
[2] KDD Cup 1999 Data,University of California, />[3] R. P. Lippmann, D. J. Fried, I. Graf et al. “Evaluating intrusion detection systems: The 1998 DARPA off-line
intrusion detection evaluation,” Proc. DISCEX, volume 2, , Novemebr 2000,pp 1012-25.
[4] Srilatha Chebrolu et al., “Feature deduction & ensemble design of intrusion detection systems”, Elsevier Journal of
Computers & Security” Vol. 24/4, pp. 295-307, 2005.
[1]
IJINS Vol. 1, No. 4, October 2012 : 294 – 305
IJINS
[5]
[6]
[7]
[8]
[9]
[10]
[11]
[12]
[13]
[14]
ISSN: 2089-3299
305
Zhengxim Chen “Data Mining and Uncertain Reasoning-An integrated approach”, John Willey, 2001, ISBN
0471388785.
Witcha Chimphlee, Abdul Hanan Abdullah, Mohd Noor Md Sap et al. “Un-supervised clustering methods for
identifying Rare Events in Anomaly detection”, Proc. of World Academy of Science, Engg. and Tech (PWASET),
Vol.8, Oct2005, pp.253-258.
A. M. Chandrashekhar, K Raghuveer, “Diverse and Conglomarate Modi operandi for Anamoly intrusion detection”
Internation journal of computer applications (IJCA), Special issue on NSC, Number 5, Dce 2011.
Mrutyunjaya Panda, Manas Ranjan Patra, “Some Clustering Algorithms To Enhance The Performance Of The
Network Intrusion Detection System”, International Journal of theoretical and applied information technology
(JATIT), ISSN-1992-8645, Vol.4, No.8, August 2008. pp.710-716.
R. R Yager, D.Filevv, “Generation of Fuzzy rules by Mountain Clustering”, Journal of Intelligent and Fuzzy
systems, Vol 2, 1994, pp 209-219.
Khaled Hammouda, Fakhreddine Karray, “A Comparative Study of Data Clustering Techniques”, University of
Waterloo, Ontario, Canada, Volume 13, Issues 2-3, November 1997,pp. 149-159.
S. L. Chiu “Fuzzy model identification based on cluster estimation”, Journal of Intelligent and Fuzzy systems, Vol
2, 1994, pp 267-278.
K. M. Batainesh, M. Naji, M.Saqer, “A Comparison study between various Clustering algorithms”, Jordan Journal
of Mechanical and Industrial Engineering (JJMIE). Volume 5, Number 4, Sept 2001, pp-335-43.
Agus Priyono, Muhammad Ridwan et al. “Generation of Fuzzy Rules with Subtractive Clustering”, journal
Teknologi, University Teknologi Malaysia,Volume 43(D), 2005, pp 143-153.
C. Elkan,“Results of the KDD-99 Classifier Learning”, SIGKDD Explorations, ACM SIGKDD, Jan 2000,
pp 63-63.
Performance evaluation of data clustering tehniques using KDD Cup-99 ID data set (A.M.Chandrashekhar)