ISO 354:2003 Acoustics Measurement of sound absorption in a reverberation room
Bạn đang xem bản rút gọn của tài liệu. Xem và tải ngay bản đầy đủ của tài liệu tại đây (327.99 KB, 28 trang )
ISO
354
INTERNATIONAL
STANDARD
Second edition
2003-05-15
Acoustics — Measurement of sound
absorption in a reverberation room
Acoustique — Mesurage de l'absorption acoustique en salle
réverbérante
Reference number
ISO 354:2003(E)
--`,,`,-`-`,,`,,`,`,,`---
Copyright International Organization for Standardization
Provided by IHS under license with ISO
No reproduction or networking permitted without license from IHS
© ISO 2003
Not for Resale
ISO 354:2003(E)
PDF disclaimer
This PDF file may contain embedded typefaces. In accordance with Adobe's licensing policy, this file may be printed or viewed but
shall not be edited unless the typefaces which are embedded are licensed to and installed on the computer performing the editing. In
downloading this file, parties accept therein the responsibility of not infringing Adobe's licensing policy. The ISO Central Secretariat
accepts no liability in this area.
Adobe is a trademark of Adobe Systems Incorporated.
--`,,`,-`-`,,`,,`,`,,`---
Details of the software products used to create this PDF file can be found in the General Info relative to the file; the PDF-creation
parameters were optimized for printing. Every care has been taken to ensure that the file is suitable for use by ISO member bodies. In
the unlikely event that a problem relating to it is found, please inform the Central Secretariat at the address given below.
© ISO 2003
All rights reserved. Unless otherwise specified, no part of this publication may be reproduced or utilized in any form or by any means,
electronic or mechanical, including photocopying and microfilm, without permission in writing from either ISO at the address below or
ISO's member body in the country of the requester.
ISO copyright office
Case postale 56 • CH-1211 Geneva 20
Tel. + 41 22 749 01 11
Fax + 41 22 749 09 47
Web www.iso.org
Published in Switzerland
ii
Copyright International Organization for Standardization
Provided by IHS under license with ISO
No reproduction or networking permitted without license from IHS
© ISO 2003 — All rights reserved
Not for Resale
ISO 354:2003(E)
Contents
Page
Foreword ............................................................................................................................................................ iv
Introduction ........................................................................................................................................................ v
1
Scope...................................................................................................................................................... 1
2
Normative references ........................................................................................................................... 1
3
Terms and definitions........................................................................................................................... 1
4
Principle ................................................................................................................................................. 3
5
Frequency range ................................................................................................................................... 3
6
6.1
6.2
6.3
Test arrangement .................................................................................................................................. 3
Reverberation room and diffusion of sound field ............................................................................. 3
Test specimens ..................................................................................................................................... 4
Temperature and relative humidity ..................................................................................................... 5
7
7.1
7.2
7.3
7.4
Measurement of reverberation time .................................................................................................... 5
General ................................................................................................................................................... 5
Interrupted noise method..................................................................................................................... 6
Integrated impulse response method ................................................................................................. 7
Evaluation of reverberation times based on decay curves .............................................................. 9
8
8.1
8.2
8.3
Expression of results............................................................................................................................ 9
Method of calculation ........................................................................................................................... 9
Precision .............................................................................................................................................. 11
Presentation of results ....................................................................................................................... 12
9
Test report ........................................................................................................................................... 13
Annex A (normative) Diffusivity of the sound field in the reverberation room.......................................... 14
Annex B (normative) Test specimen mountings for sound absorption tests............................................ 15
--`,,`,-`-`,,`,,`,`,,`---
Bibliography ..................................................................................................................................................... 21
iii
© ISO 2003 — All rights reserved
Copyright International Organization for Standardization
Provided by IHS under license with ISO
No reproduction or networking permitted without license from IHS
Not for Resale
ISO 354:2003(E)
Foreword
International Standards are drafted in accordance with the rules given in the ISO/IEC Directives, Part 2.
The main task of technical committees is to prepare International Standards. Draft International Standards
adopted by the technical committees are circulated to the member bodies for voting. Publication as an
International Standard requires approval by at least 75 % of the member bodies casting a vote.
Attention is drawn to the possibility that some of the elements of this document may be the subject of patent
rights. ISO shall not be held responsible for identifying any or all such patent rights.
ISO 354 was prepared by Technical Committee ISO/TC 43, Acoustics, Subcommittee SC 2, Building
acoustics.
This second edition cancels and replaces the first edition (ISO 354:1985), which has been technically revised,
as follows:
an integrated impulse response method has been introduced;
the requirement to measure at least 36 decays has been added;
mounting conditions according to ISO 354:1985:Amd.1:1997 and mounting conditions Type B and Type J
have been introduced.
iv
Copyright International Organization for Standardization
Provided by IHS under license with ISO
No reproduction or networking permitted without license from IHS
© ISO 2003 — All rights reserved
Not for Resale
--`,,`,-`-`,,`,,`,`,,`---
ISO (the International Organization for Standardization) is a worldwide federation of national standards bodies
(ISO member bodies). The work of preparing International Standards is normally carried out through ISO
technical committees. Each member body interested in a subject for which a technical committee has been
established has the right to be represented on that committee. International organizations, governmental and
non-governmental, in liaison with ISO, also take part in the work. ISO collaborates closely with the
International Electrotechnical Commission (IEC) on all matters of electrotechnical standardization.
ISO 354:2003(E)
Introduction
When a sound source operates in an enclosed space, the level to which reverberant sound builds up, and the
subsequent decay of reverberant sound when the source is stopped, are governed by the sound-absorbing
characteristics of the boundary surfaces, the air filling the space, and objects within the space. In general, the
fraction of the incident sound power absorbed at a surface depends upon the angle of incidence. In order to
relate the reverberation time of an auditorium, office, workshop, etc., to the noise reduction that would be
effected by an absorbing treatment, knowledge of the sound-absorbing characteristics of the surfaces, usually
in the form of a suitable average over all angles of incidence, is required. Since the distribution of sound
waves in typical enclosures includes a wide and largely unpredictable range of angles, a uniform distribution is
taken as the basic condition for the purposes of standardization. If, in addition, the sound intensity is
independent of the location within the space, the sound distribution is called a diffuse sound field, and the
sounds reaching a room surface are said to be at random incidence.
The sound field in a properly designed reverberation room closely approximates a diffuse field. Hence, sound
absorption measured in a reverberation room closely approximates the sound absorption that would be
measured under the basic conditions assumed for standardization.
The purpose of this International Standard is to promote uniformity in the methods and conditions of
measurement of sound absorption in reverberation rooms.
--`,,`,-`-`,,`,,`,`,,`---
v
© ISO 2003 — All rights reserved
Copyright International Organization for Standardization
Provided by IHS under license with ISO
No reproduction or networking permitted without license from IHS
Not for Resale
--`,,`,-`-`,,`,,`,`,,`---
Copyright International Organization for Standardization
Provided by IHS under license with ISO
No reproduction or networking permitted without license from IHS
Not for Resale
INTERNATIONAL STANDARD
ISO 354:2003(E)
Acoustics — Measurement of sound absorption
in a reverberation room
1
Scope
This International Standard specifies a method of measuring the sound absorption coefficient of acoustical
materials used as wall or ceiling treatments, or the equivalent sound absorption area of objects, such as
furniture, persons or space absorbers, in a reverberation room. It is not intended to be used for measuring the
absorption characteristics of weakly damped resonators.
The results obtained can be used for comparison purposes and for design calculation with respect to room
acoustics and noise control.
2
Normative references
The following referenced documents are indispensable for the application of this document. For dated
references, only the edition cited applies. For undated references, the latest edition of the referenced
document (including any amendments) applies.
ISO 266, Acoustics ― Preferred frequencies
ISO 9613-1, Acoustics ― Attenuation of sound during propagation outdoors ― Part 1: Calculation of the
absorption of sound by the atmosphere
IEC 61260, Electroacoustics ― Octave-band and fractional-octave-band filters
3
Terms and definitions
For the purpose of this document, the following terms and definitions apply.
3.1
decay curve
graphical representation of the decay of the sound pressure level in a room as a function of time after the
sound source has stopped
3.2
reverberation time
T
time, in seconds, that would be required for the sound pressure level to decrease by 60 dB after the sound
source has stopped
NOTE 1
The definition of T with a decrease by 60 dB of the sound pressure level can be fulfilled by linear extrapolation
of shorter evaluation ranges.
NOTE 2
This definition is based on the assumptions that, in the ideal case, there is a linear relationship between the
sound pressure level and time, and that the background noise level is sufficiently low.
--`,,`,-`-`,,`,,`,`,,`---
1
© ISO 2003 — All rights reserved
Copyright International Organization for Standardization
Provided by IHS under license with ISO
No reproduction or networking permitted without license from IHS
Not for Resale
ISO 354:2003(E)
3.3
interrupted noise method
method of obtaining decay curves by direct recording of the decay of the sound pressure level after exciting a
room with broadband or band-limited noise
3.4
integrated impulse response method
method of obtaining decay curves by reverse-time integration of the squared impulse responses
3.5
impulse response
temporal evolution of the sound pressure observed at a point in a room as a result of the emission of a Dirac
impulse at another point in the room
NOTE
It is impossible in practice to create and radiate true Dirac delta functions, but short transient sounds (e.g. from
shots) may offer close enough approximations for practical measurements. An alternative measurement technique,
however, is to use a period of maximum-length sequence type signal (MLS) or another deterministic, flat-spectrum signal
and to transform the measured response back to an impulse response.
3.6
equivalent sound absorption area of a room
hypothetical area of a totally absorbing surface without diffraction effects which, if it were the only absorbing
element in the room, would give the same reverberation time as the room under consideration
NOTE 1
The area is measured in square metres.
NOTE 2
For the empty reverberation room, this quantity is denoted by A1; for the reverberation room containing the
test specimen, it is denoted by A2.
3.7
equivalent sound absorption area of the test specimen
AT
difference between the equivalent sound absorption area of the reverberation room with and without the test
specimen
NOTE
The area is measured in square metres.
3.8
area of the test specimen
S
area of the floor or wall covered by the test specimen
NOTE 1
The area is measured in square metres.
NOTE 2
In the case of a test specimen surrounded by a structure (type E mounting or type J mounting), it is the area
enclosed by the structure.
3.9
sound absorption coefficient
αs
NOTE 1
For absorbers where both sides are exposed, the sound absorption coefficient is the equivalent sound
absorption area of the test specimen divided by the area of the two sides of the test specimen.
NOTE 2
The sound absorption coefficient evaluated from reverberation time measurements can have values larger
than 1,0 (e.g. because of diffraction effects), and αs is not, therefore, expressed as a percentage.
NOTE 3
The use of the subscript “s” is to avoid confusion with the sound absorption coefficient defined as the ratio of
non-reflected-to-incident sound energy if a plane wave strikes a plane wall at a particular angle of incidence. That
“geometric” sound absorption coefficient is always smaller than 1,0 and may therefore be expressed as a percentage.
2
Copyright International Organization for Standardization
Provided by IHS under license with ISO
No reproduction or networking permitted without license from IHS
© ISO 2003 — All rights reserved
Not for Resale
--`,,`,-`-`,,`,,`,`,,`---
ratio of the equivalent sound absorption area of a test specimen divided by the area of the test specimen
ISO 354:2003(E)
4
Principle
The average reverberation time in the reverberation room is measured with and without the test specimen
mounted. From these reverberation times, the equivalent sound absorption area of the test specimen, AT, is
calculated by using Sabine’s equation (see 8.1.2.1).
In the case of a test specimen that uniformly covers a surface (a plane absorber or a specified array of test
objects), the sound absorption coefficient is obtained by dividing AT by the treated surface area S (see 3.8).
When the test specimen comprises several identical objects, the equivalent sound absorption area Aobj of an
individual object is found by dividing AT by the number of objects, n:
Aobj = AT/n
5
Frequency range
Measurements shall be made in one-third-octave bands with the following centre frequencies, in hertz, as
specified in ISO 266:
100
125
160
200
250
315
400
500
630
800
1 000
1 250
1 600
2 000
2 500
3 150
4 000
5 000
Additional measurements may be made in one-third-octave bands with centre frequencies specified by
ISO 266 outside this range. Especially at low frequencies (below 100 Hz), it could be very difficult to obtain
accurate measurement results due to the low modal density of the reverberation room.
6
Test arrangement
6.1
Reverberation room and diffusion of sound field
6.1.1
Volume of reverberation room
The volume of the reverberation room shall be at least 150 m3. For new constructions, the volume is strongly
recommended to be at least 200 m3. When the volume of the room is greater than about 500 m3, it may not
be possible to measure sound absorption accurately at high frequencies because of air absorption.
6.1.2
Shape of reverberation room
The shape of the reverberation room shall be such that the following condition is fulfilled:
I max < 1,9 V 1/ 3
(1)
where
Imax is the length of the longest straight line which fits within the boundary of the room (e.g. in a
rectangular room it is the major diagonal), in metres;
V
is the volume of the room, in cubic metres.
In order to achieve a uniform distribution of natural frequencies, especially in the low-frequency bands, no two
dimensions of the room shall be in the ratio of small whole numbers.
3
--`,,`,-`-`,,`,,`,`,,`---
© ISO 2003 — All rights reserved
Copyright International Organization for Standardization
Provided by IHS under license with ISO
No reproduction or networking permitted without license from IHS
Not for Resale
ISO 354:2003(E)
6.1.3
Diffusion of the sound field
The decaying sound field in the room shall be sufficiently diffuse. In order to achieve satisfactory diffusion
whatever the shape of the room, the use of stationary or suspended diffusers or rotating vanes is, in general,
required (see Annex A).
6.1.4
Sound absorption area
The equivalent sound absorption area of the empty room, A1, calculated according to 8.1.2.1, determined in
one-third octave bands, shall not exceed the values given in Table 1.
Table 1 — Maximum equivalent sound absorption areas for room volume V = 200 m3
Frequency, Hz
100
125
160
200
250
315
400
500
630
Equivalent sound absorption area, m2
6,5
6,5
6,5
6,5
6,5
6,5
6,5
6,5
6,5
Frequency, Hz
Equivalent sound absorption area,
m2
800
1 000
1 250
1 600
2 000
2 500
3 150
4 000
5 000
6,5
7,0
7,5
8,0
9,5
10,5
12,0
13,0
14,0
If the volume V of the room differs from 200 m3, the values given in Table 1 shall be multiplied by
(V/200 m3)2/3.
The graph of the equivalent sound absorption area of the empty room versus the frequency shall be a smooth
curve and shall have no dips or peaks differing by more than 15 % from the mean of the values of both
adjacent one-third-octave bands.
6.2
6.2.1
Test specimens
Plane absorbers
6.2.1.1
The test specimen shall have an area between 10 m2 and 12 m2. If the volume V of the room is
greater than 200 m3, the upper limit for the test specimen area shall be increased by the factor (V/200 m3)2/3.
The area to be chosen depends on the room volume and on the absorption capability of the test specimen.
The larger the room, the larger the test area should be. For specimens with small absorption coefficient, the
upper limit area should be chosen.
6.2.1.2
The test specimen shall be of rectangular shape with a ratio of width to length of between 0,7
and 1. It should be placed so that no part of it is closer than 1 m to any edge of the boundary of the room; the
distance shall be at least 0,75 m. The edges of the specimen shall preferably not be parallel to the nearest
edge of the room. If necessary, heavy test specimens may be mounted vertically along the walls of the room,
and directly resting on the floor. In this case, the requirement of at least 0,75 m distance need not be
respected.
6.2.1.3
The test specimen shall be installed in one of the mountings specified in Annex B, unless the
relevant specifications provided by the producer or the application details provided by the user require a
different mounting. The measurement of the reverberation time of the empty room shall be made in the
absence of the frame or the side walls of the test specimen except for the barrier around a Type J mounting.
6.2.2
Discrete sound absorbers
6.2.2.1
Rectangular unit sound absorber pads or baffles shall be installed in a Type J mounting as
specified in Annex B.
--`,,`,-`-`,,`,,`,`,,`---
4
Copyright International Organization for Standardization
Provided by IHS under license with ISO
No reproduction or networking permitted without license from IHS
© ISO 2003 — All rights reserved
Not for Resale
ISO 354:2003(E)
6.2.2.2
Discrete objects (e.g. chairs, free-standing screens or persons) shall be installed for the test in the
same manner as they are typically installed in practice. For example, chairs or free-standing screens shall rest
on the floor, but they shall not be closer than 1 m to any other boundary. Space absorbers shall be mounted at
least 1 m from any boundary or room diffusers and at least 1 m from any microphone. Office screens shall be
mounted as individual objects.
6.2.2.3
A test specimen shall comprise a sufficient number of individual objects (in general, at least three)
to provide a measurable change in the equivalent sound absorption area of the room greater than 1 m2, but
not more than 12 m2. If the volume, V, of the room is greater than 200 m3, these values shall be increased by
the factor (V/200 m3)2/3. Objects normally treated as individual objects shall be arranged randomly, spaced at
least 2 m apart. If the test specimen comprises only one object, it shall be tested in at least three locations, at
least 2 m apart, and the results shall be averaged.
6.3
Temperature and relative humidity
6.3.1
Changes in temperature and relative humidity during the course of a measurement can have a
large effect on the measured reverberation time, especially at high frequencies and at low relative humidities.
The changes are described quantitatively in ISO 9613-1.
6.3.2
Measurements should be performed in the empty room and in the room containing the test
specimen under conditions of temperature and relative humidity that are almost the same so that the
adjustments due to air absorption do not differ significantly. In any case, the relative humidity in the room shall
be at least 30 % and max. 90 % and the temperature shall be at least 15 °C during the whole test. For all
measurements, the corrections for the change in air absorption as described in 8.1.2.3 shall be applied.
Allow the test specimen to reach equilibrium with respect to temperature and relative humidity in the room
before tests are carried out.
7
Measurement of reverberation time
7.1
7.1.1
General
Introduction
Two methods of measuring decay curves are described in this International Standard: the interrupted noise
method and the integrated impulse response method. The decay curve measured with the interrupted noise
method is the result of a statistical process, and averaging several decay curves or reverberation times
measured at one microphone/loudspeaker position is mandatory in order to obtain a suitable repeatability. The
integrated impulse response of a room is a deterministic function and not prone to statistical deviations, so no
averaging is necessary. However, it requires more sophisticated instrumentation and data processing than the
interrupted noise method.
7.1.2
Microphones and microphone positions
The directivity characteristic of the microphones used for the measurement shall be omnidirectional. The
measurements shall be made with different microphone positions which are at least 1,5 m apart, 2 m from any
sound source and 1 m from any room surface and the test specimen. Decay curves measured at different
microphone positions shall not be combined in any way.
7.1.3
Source positions
The sound in the reverberation room shall be generated by a sound source with an omnidirectional radiation
pattern. Different sound source positions which are at least 3 m apart shall be used.
--`,,`,-`-`,,`,,`,`,,`---
5
© ISO 2003 — All rights reserved
Copyright International Organization for Standardization
Provided by IHS under license with ISO
No reproduction or networking permitted without license from IHS
Not for Resale
ISO 354:2003(E)
7.1.4
Number of microphone and loudspeaker positions
--`,,`,-`-`,,`,,`,`,,`---
The number of spatially independent measured decay curves shall be at least 12. Therefore the number of
microphone positions times the number of sound source positions shall be at least 12. The minimum number
of microphone positions shall be three, the minimum number of sound source positions shall be two. It is
permissible to use more than one sound source simultaneously provided the difference in the radiated power
is within a tolerance band of 3 dB for each one-third-octave band. If more than one sound source is used for
excitation simultaneously, the number of spatially independent measured decay curves may be reduced to six.
7.2
Interrupted noise method
7.2.1
Excitation of the room
A loudspeaker source shall be used and the signal fed into the loudspeaker shall be derived from broad-band
or band-limited noise having a continuous frequency spectrum. When using broad-band noise and a real-time
analyser, the spectrum of the noise used shall be such that the differences in the resulting sound pressure
levels in the room shall be less than 6 dB in adjacent one-third-octave bands. When using band-limited noise,
the bandwidth shall be at least one-third octave.
The excitation signal shall be sufficiently long to produce a steady-state sound pressure level in all frequency
bands of interest before it is switched off. In order to obtain steady-state conditions, the excitation time shall
be at least half of the estimate of the expected reverberation time.
The level of the excitation signal before decay shall be sufficiently high that the lower decibel level of the
evaluation range is at least 10 dB above the background noise level (see 7.4.1).
If a signal with a bandwidth greater than one-third octave is used, reverberation times of different length in
adjacent frequency bands can influence the lower part of the decay curve. If the reverberation times in
adjacent bands differ by more than a factor of 1,5, the decay curves for those bands with the shortest
reverberation times shall be measured individually using one-third-octave band filtering of the sound source.
7.2.2
Averaging
As explained in 7.1.1, averaging several measurements performed at one microphone/loudspeaker position is
mandatory in order to reduce the measurement uncertainty caused by statistical deviations. The number of
averages shall be at least three. If the desired repeatability is to be in the same range as the repeatability
produced by the integrated impulse response method, the number of averages shall be at least ten (see 8.2).
Two averaging methods are possible. The first averaging method is to average the decay curves recorded at
one microphone/loudspeaker position using the formula
1
L p (t ) = 10 lg
N
N
∑10
n =1
L pn (t )
10
(2)
where
Lp(t)
is the averaged sound pressure level at the time t calculated for a total number of N decays;
Lpn(t) is the sound pressure level of the nth decay at the time t.
This method is generally referred to as “ensemble averaging”. As the second averaging method to be applied
in cases where ensemble averaging is not possible, the single decay curves shall be evaluated first and the
resulting reverberation times shall be averaged using arithmetic averaging. Decay curves recorded at different
microphone/loudspeaker positions shall not be averaged.
NOTE
In theory, for laboratory measurements, averaging the reverberation times produces similar results as
ensemble averaging. When using computer-controlled devices, however, ensemble averaging should be used in any case.
6
Copyright International Organization for Standardization
Provided by IHS under license with ISO
No reproduction or networking permitted without license from IHS
© ISO 2003 — All rights reserved
Not for Resale
ISO 354:2003(E)
The decay curve resulting from several averaged decays is normally “smoother” than a single recorded decay. This leads
to a more reliable detection of the evaluation range, which is done automatically in most cases.
7.2.3
Recording system
The recording system shall be a level recorder or any other adequate system for determining the average
slope of the decay curve of the corresponding reverberation time, including the necessary amplifiers and filters.
The apparatus for recording (and displaying and/or evaluating) the decay in sound pressure level may use
a)
exponential averaging, with a continuous curve as output, or
b)
exponential averaging, with successive discrete sample points from the continuous average as output, or
c)
linear averaging, with successive discrete linear averages as output, in some cases with pauses of
considerable duration between determinations of the averages.
The time constant of an exponential averaging device (or approximate equipment, see Note 2) shall be less
than, but as close as possible to, T/20.
The averaging time of a linear averaging device shall be less than T/12.
For apparatus in which the decay record is formed as a succession of discrete points, the time interval
between points on the record shall be less than the averaging time of the device (u T/12).
In all cases where the decay record must be evaluated visually, the time scale of the display should be
adjusted so that the slope of the record is as close to 45° as possible.
NOTE 1
Commercial level recorders in which the sound pressure level is recorded graphically as a function of time are
approximately equivalent to exponential averaging devices.
NOTE 2
When an exponential averaging device is used, there is little advantage in setting the averaging time to very
much less than T/20. When a linear averaging device is used, there is no advantage in setting the interval between points
to very much less than T/12. In some sequential measurement procedures, it is feasible to set the averaging time
appropriately for each frequency band. In other procedures this is not feasible, and an averaging time or interval chosen
as above with reference to the smallest reverberation time is strongly recommended to be used for measurements in all
frequency bands.
The one-third-octave band filters included in the receiving equipment shall meet the requirements specified in
IEC 61260.
7.3
7.3.1
Integrated impulse response method
Direct method
The impulse response may be measured directly by using an impulse source such as a pistol shot, balloon
burst, spark gap or any other sound source that produces an impulse with sufficient bandwidth and energy to
meet the requirements of 7.2.1.
NOTE
Loudspeakers are usually not suited to produce broadband impulse signals with sufficient energy. It is,
however, possible to generate band-filtered pulses. One practice that works well is to feed the loudspeaker system with
the time-reversed impulse response of a bandpass filter, i.e. a one-third-octave band filter.
7.3.2
Indirect method
Special sound signals may be used which yield the impulse response only after special processing of the
microphone signal. This can provide an improved signal-to-noise ratio. Tone sweeps or pseudo-random noise
(e.g. maximum-length sequences) may be used if the requirements for the spectral characteristics of the
source are fulfilled. Because of the gain in signal-to-noise ratio, the dynamic requirements of the source may
--`,,`,-`-`,,`,,`,`,,`---
7
© ISO 2003 — All rights reserved
Copyright International Organization for Standardization
Provided by IHS under license with ISO
No reproduction or networking permitted without license from IHS
Not for Resale
ISO 354:2003(E)
be considerably lower than those set in 7.3.1. If synchronized time averaging is used (e.g. in order to enhance
the signal-to-noise ratio), it is necessary to verify that the impulse response remains unchanged during the
whole measurement process. The signals may be generated by devices that will consist either of external
hard- and software, or devices that form an integrated part of the measuring device.
The bandwidth of the signal shall be greater than one-third octave. The spectrum should be reasonably flat
within the actual one-third-octave band to be measured. Alternatively, the broadband noise spectrum may be
shaped to provide an approximately pink spectrum in the range covering the one-third-octave bands with midband frequencies from 100 Hz to 5 kHz ,with the reverberation time being measured simultaneously in
different one-third-octave bands. The test signal shall be such that the resulting decay curve for the respective
frequency band meets the level requirements given in 7.2.1.
7.3.3
Recording system
The recording system shall consist of microphones and amplifiers satisfying the requirements given in 7.1.2
and 7.2.3, as well as an additional device that is capable of digitalizing the recorded signal and of performing
all the necessary data processing, including the integration of the impulse response and the evaluation of the
decay curve. In the case of 7.3.2, the recording system may also contain the necessary hardware and
software to process the impulse response from the recorded signal and also to generate the test signal.
--`,,`,-`-`,,`,,`,`,,`---
The impulse response shall be filtered in one-third-octave bands. The filtering may be processed before or
after the digitalization of the impulse response, but in any case before performing the integration. Analog or
digital filters may be used. The filters shall conform to IEC 61260.
NOTE
The use of special test signals, such as maximum length sequences, not only requires more sophisticated
data processing, but also a deeper knowledge of the theoretical background in order to obtain proper results. Since a
detailed introduction to this technique is outside scope of this International Standard, the user should refer to appropriate
literature.
7.3.4
Integration of the impulse response
The filtered impulse response shall be backward integrated. The result is theoretically equivalent to an infinite
number of averaged decays obtained by the interrupted noise method. As there are several commercial
systems available that offer the backward integration as an integrated feature, it will normally not be
necessary for the user to program the integration. The basic procedure is the following.
Generate for each frequency band the decay curve by a backward integration of the squared impulse
response. In an ideal situation with no background noise, the integration would start at the end of the impulse
response (t →∞) and proceed to the beginning of the squared impulse response. Thus the decay as a function
of time is
∞
E (t ) =
∫
0
p 2 (τ )dτ −
t
∫
0
p 2 (τ )dτ =
∞
∫
p 2 (τ )dτ =
t
t
∫p
2
(τ )d( −τ )
(3)
∞
where
E(t) is the backward integrated squared impulse response;
p(τ) is the sound pressure impulse response.
In order to minimize the influence of the background noise on the later part of the impulse response, use the
following technique for implementation.
If the level of the background noise is known, determine the starting point of the integration t1 as the
intersection between a horizontal line through the background noise and a sloping line through a
representative part of the squared impulse response decay curve. Continue the backward integration up to the
beginning of the impulse response, and calculate the decay curve from
8
Copyright International Organization for Standardization
Provided by IHS under license with ISO
No reproduction or networking permitted without license from IHS
© ISO 2003 — All rights reserved
Not for Resale
ISO 354:2003(E)
t
E (t ) =
∫p
2
(τ )d( −τ ) + C
(4)
t1
--`,,`,-`-`,,`,,`,`,,`---
where (t < t1) and C is an optional correction for the integrated squared impulse response between t1 and
infinity. The most reliable result is obtained when C is calculated under the assumption of an exponential
decay of energy with the same rate as given by the squared impulse response between t0 and t1, where t0 is
the time corresponding to a level 10 dB higher than the level at t1.
If C is set to zero, the finite starting point of the integration causes a systematic underestimation of the
reverberation time. For a maximum underestimation of the reverberation time of 5 %, the backward integration
shall begin at a level below the maximum level of the squared impulse response, which is at least 15 dB plus
the dynamic range over which T is to be assessed.
7.4
Evaluation of reverberation times based on decay curves
7.4.1
Evaluation range
The evaluation of the decay curve for each frequency band specified in Clause 5 shall start at 5 dB below the
initial sound pressure level. The evaluation range shall be 20 dB. The bottom of the evaluation range shall be
at least 10 dB above the overall background noise of the measuring system.
7.4.2
Evaluation method
When using a computer-controlled recording system, the calculation of a least-squares-fit line over the
evaluation range is a convenient method for the determination of the reverberation time. Other algorithms may
be used that provide similar results. When using a direct plot from a level recorder, a straight line shall be
fitted manually as closely as possible to the decay curve. In the case of evaluation of discrete points, the
number of points shall be sufficient for applying, for example, a least-squares-fit line algorithm.
8
Expression of results
8.1
Method of calculation
8.1.1
Calculation of reverberation times T1 and T2
The reverberation time of the room in each frequency band is expressed by the arithmetic mean of the total
number of reverberation time measurements made in that frequency band.
The mean reverberation times of the room in each frequency band without and with the test specimen, T1 and
T2 respectively, shall be calculated and expressed using at least two decimal places.
Calculation of A1, A2 and AT
8.1.2
8.1.2.1
The equivalent sound absorption area of the empty reverberation room, A1, in square metres,
shall be calculated using the formula
A1 =
55,3 V
− 4 Vm1
cT1
(5)
where
V
is the volume, in cubic metres, of the empty reverberation room;
9
© ISO 2003 — All rights reserved
Copyright International Organization for Standardization
Provided by IHS under license with ISO
No reproduction or networking permitted without license from IHS
Not for Resale
ISO 354:2003(E)
is the propagation speed of sound in air, in metres per second;
c
T1 is the reverberation time, in seconds, of the empty reverberation room;
m1 is the power attenuation coefficient, in reciprocal metres, calculated according to ISO 9613-1 using
the climatic conditions that have been present in the empty reverberation room during the
measurement. The value of m can be calculated from the attenuation coefficient, α, which is used in
ISO 9613-1 according to the formula
m =
NOTE
α
10 lg(e)
For temperatures in the range of 15 °C to 30 °C, c can be calculated from the formula
(6)
c = (331 + 0,6t / °C) m/s
where t is the air temperature, in degrees Celsius.
--`,,`,-`-`,,`,,`,`,,`---
8.1.2.2
The equivalent sound absorption area of the reverberation room containing a test specimen, A2,
in square metres, shall be calculated using the formula
A2 =
55,3 V
− 4V m 2
c T2
(7)
where
c and V have the same meanings as in 8.1.2.1;
T2
is the reverberation time, in seconds, of the reverberation room after the test specimen has been
introduced;
m2
is the power attenuation coefficient, in reciprocal metres, calculated according to ISO 9613-1 using
the climatic conditions that have been present in the empty reverberation room during the
measurement. The value of m can be calculated from the attenuation coefficient, α, which is used in
ISO 9613-1 according to the formula
m =
α
10 lg(e)
8.1.2.3
The equivalent sound absorption area of the test speciment, AT, in square metres, shall be
calculated using the formula
1
1
AT = A2 − A1 = 55,3V
−
− 4V ( m 2 − m1)
c
T
c
1T1
2 2
(8)
where
c1
is the propagation speed of sound in air at the temperature t1;
c2
is the propagation speed of sound in air at the temperature t2;
A1, V, T1 and m1 have the same meanings as in 8.1.2.1;
A2, T2 and m2
have the same meanings as in 8.1.2.2.
10
Copyright International Organization for Standardization
Provided by IHS under license with ISO
No reproduction or networking permitted without license from IHS
© ISO 2003 — All rights reserved
Not for Resale
ISO 354:2003(E)
Calculation of αs
8.1.3
The sound absorption coefficient αs of a plane absorber or a specified array of test objects shall be calculated
using the formula
αs =
AT
S
(9)
where
AT is the equivalent sound absorption area of the test specimen, in square metres, calculated in
accordance with 8.1.2.3;
S
8.1.4
is the area, in square metres, covered by the test specimen (see 3.8).
Calculation of equivalent sound absorption area of discrete absorbers
For discrete absorbers, the result is generally expressed as the equivalent sound absorption area per object,
which is determined by dividing AT by the number of objects tested.
For a specified array of objects, the result is given as the sound absorption coefficient.
8.2
Precision
8.2.1
General
The overall measurement uncertainty of absorption coefficients is influenced by two effects. The first is the
uncertainty of the measured reverberation times. This effect is particularly important when the interrupted
noise method is used (see 8.2.2). The second factor causing uncertainty is described by reproducibility limits.
It is caused by the complete measurement set-up including the reverberation room and the mounting method.
Variations due to the laboratory set-up are being investigated in interlaboratory tests (see 8.2.3).
8.2.2
Repeatability of measured reverberation times
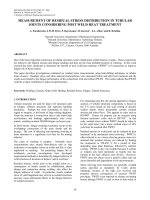
The relative standard deviation of the reverberation time T20, evaluated over a 20 dB decay range, can be
estimated by the following formula (see ISO/TR 140-13 for details):
ε 20 (T ) / T =
2,42 + 3,59 / N
fT
(10)
ε20 (T) is the standard deviation of the reverberation time T20;
T
is the reverberation time measured;
f
is the centre frequency of the one-third-octave band;
N
is the number of decay curves evaluated.
An example of the standard deviation of measurement of T20 at 12 positions with 3 repetitions of decay
registration at each position is illustrated in Figure 1.
11
--`,,`,-`-`,,`,,`,`,,`---
© ISO 2003 — All rights reserved
Copyright International Organization for Standardization
Provided by IHS under license with ISO
No reproduction or networking permitted without license from IHS
Not for Resale
ISO 354:2003(E)
Figure 1 — Example of the standard deviation
8.2.3
Reproducibility
The reproducibility of absorption coefficient measurement is still under investigation.
8.3
Presentation of results
For all frequencies of measurement, the following results shall be reported, presented in the form of a table
and as a graph:
a)
for plane absorbers, the sound absorption coefficient, αs;
b)
for single objects, the equivalent sound absorption area per object, Aobj;
c)
for a specified array of objects, the sound absorption coefficient, αs.
The equivalent sound absorption area of a test specimen shall be rounded to 0,1 m2 and the sound absorption
coefficient to 0,01.
NOTE
imply.
It should be noted that the precision of the results may be less than the above decimal rounding limits might
In the graphical presentation, the points of measurement shall be connected by straight lines, the x-axis giving
the frequency on a logarithmic scale and the y-axis showing the equivalent sound absorption area or sound
absorption coefficient on a linear scale. The ratio of the y-axis distance from AT = 0 to AT = 10 m2, or from
αs = 0 to αs = 1, to the x-axis distance corresponding to 5 octaves, shall be 2 : 3. For measuring results with
AT u 3 m2, a y-axis distance from AT = 0 to AT = 5 m2 can be chosen.
In addition, a single-number rating calculated according to ISO 11654 may be included. As specified in
ISO 11654, octave-band values are deduced by determining the arithmetic mean of the three one-third-octave
sound absorption coefficients within the octave.
12
--`,,`,-`-`,,`,,`,`,,`---
Copyright International Organization for Standardization
Provided by IHS under license with ISO
No reproduction or networking permitted without license from IHS
© ISO 2003 — All rights reserved
Not for Resale
ISO 354:2003(E)
9
Test report
The test report shall make reference to this International Standard and shall include the following information:
the name of the organization that performed the test;
b)
the date of test;
c)
the description of the test specimen, the test area of the test specimen, S, and its mounting and position in
the reverberation room, preferably by means of drawings;
d)
the shape of the reverberation room, its diffusion treatment (the number and size of diffusers) and the
number of microphone and sound source positions;
e)
the dimensions of the reverberation room, its volume, V, and its total surface area (walls, floor and
ceiling), St;
f)
the temperature and relative humidity during measurements of T1 and T2;
g)
the mean reverberation times T1 and T2, at each frequency;
h)
the test results, reported in accordance with 8.3.
13
© ISO 2003 — All rights reserved
Copyright International Organization for Standardization
Provided by IHS under license with ISO
No reproduction or networking permitted without license from IHS
--`,,`,-`-`,,`,,`,`,,`---
a)
Not for Resale
ISO 354:2003(E)
Annex A
(normative)
Diffusivity of the sound field in the reverberation room
A.1 Diffusers
An acceptable diffusivity can be achieved by using fixed diffusers and/or rotating vanes. Ideally, these
diffusing elements should be sheets with low sound absorption and with a mass per unit area of about 5 kg/m2.
Diffusers of different sizes, ranging from approximately 0,8 m2 to 3 m2 in area (for one side) are
recommended. The sheets may be slightly curved and shall be oriented at random and positioned throughout
the room.
If rotating vanes are used, the decay repetition frequency and frequency of rotation of the vane shall not be in
the ratio of small whole numbers.
A.2 Check of diffusivity
Select a suitable test specimen, i.e. a sample 5 cm to 10 cm thick, of homogeneous, porous absorbing
material which, under optimum conditions, has a sound absorption coefficient greater than 0,9 over the
frequency range from 500 Hz to 4 000 Hz. (Certain glass-wools, rock-wools or polyurethane foams meet this
criterion.)
Mount the test specimen in accordance with 6.2.
Perform sound absorption measurements on the test specimen as follows:
a)
with no diffusers;
b)
with a small number of stationary diffusers (approximately 5 m2 in area); and
c)
with increasing quantities of stationary diffusers, in steps of approximately 5 m2 in area.
It will be seen that the mean sound absorption coefficient approaches a maximum and thereafter remains
constant with increasing numbers (area) of diffusers.
The optimum number (area) of diffusers is that at which this constant value is attained.
If rotating vanes are used, the resulting diffusion shall be proved to be equivalent to that achieved by the
procedure described above.
NOTE
From experience it has been found that, in rectangular rooms, the area (both sides) of diffusers required to
achieve satisfactory diffusion is approximately 15 % to 25 % of the total surface area of the room.
14
Copyright International Organization for Standardization
Provided by IHS under license with ISO
No reproduction or networking permitted without license from IHS
© ISO 2003 — All rights reserved
Not for Resale
--`,,`,-`-`,,`,,`,`,,`---
For each set of measurements, calculate the mean value of the sound absorption coefficients, in the range
from 500 Hz to 5 000 Hz, and plot these values against the number (total area) of diffusers used in each case.
ISO 354:2003(E)
Annex B
(normative)
Test specimen mountings for sound absorption tests
B.1 General
The sound-absorption properties of a material depend on how that material is mounted during a test. This
annex specifies several different standard mountings that shall be used during a test for sound absorption.
Normally a test specimen is tested using only one of the specified mountings.
--`,,`,-`-`,,`,,`,`,,`---
Designations for Type E and Type G mountings include a numerical suffix, for example, E-400 or G-100. The
suffix is equal to a distance characteristic of the mounting in millimetres, rounded off to the nearest 5 mm.
NOTE
Where applicable, the designations used for each type of mounting have been chosen to match those used in
a standard that already existed when this annex was written, ASTM E 795, Standard Practices for Mounting Test
Specimens During Sound Absorption Tests.
B.2 Type A mounting
The test specimen is mounted or placed directly against a room surface, such as the floor of the reverberation
room. Adhesives or mechanical fasteners that do not leave a thin air space may be used to hold the test
specimen in place during the test, if required. A complete description of the fasteners and their location or the
method of surface preparation and the adhesive used to retain the specimen shall be included in the test
report.
If two or more pieces of material (or separate panels) are butted together to form the test specimen, it may be
necessary to cover the joints between the adjacent pieces with tape, caulking compound, or other material
that is not sound absorbing. The reason for covering the joints is to prevent the side edges of the individual
pieces from absorbing sound. If the joints are covered, the test report shall describe the method and material
used.
The perimeter edge of the test specimen shall be sealed or covered to prevent the edges from absorbing
sound. If the edges of the test specimen are exposed when the material is normally installed in an actual
application, then the edges of the test specimen shall not be sealed or covered during a test. If the edges are
not covered, the area of the edges shall be included in calculating the test specimen area.
The treatment of the edges of the test specimen shall be described in the test report. If the area of the edges
was included in the calculation of test specimen area, this shall be noted in the test report.
The perimeter edges of the test specimen may be sealed or covered with an acoustically reflective frame. The
frame shall be solid, not hollow, and shall have no air space between the test specimen and the frame and
between the room surface and the frame. A frame of 1,0 mm thick steel, 12,5 mm thick gypsum board or
12,5 mm wood (minimum thicknesses) may be used. The frame shall be tightly butted to the specimen and
sealed to the room surface. The exposed face of the frame shall be flush with the surface of the specimen.
If a perforated, expanded metal, or other open facing material is used over the test specimen, a complete
description of this facing material shall be given in the test report.
15
© ISO 2003 — All rights reserved
Copyright International Organization for Standardization
Provided by IHS under license with ISO
No reproduction or networking permitted without license from IHS
Not for Resale
ISO 354:2003(E)
B.3 Type B mounting
--`,,`,-`-`,,`,,`,`,,`---
This mounting is used for products that are glued directly to a hard surface with an acoustic panel adhesive,
the application of which normally leaves a thin airspace between the product and the surface to which it is
adhered.
Adhere the test specimen to a gypsum board laid directly against the room surface. The thickness of the
gypsum board is not critical. Apply the adhesive in accordance with the manufacturer’s specification. If there
are no instructions, apply four dabs of adhesive to the back of each piece of the test specimen. In order to
secure the airspace, shims of 3 mm thickness of size 25 mm by 25 mm shall be located at the four corners of
each piece of the test specimen. The perimeter edges of the test specimen shall be sealed or covered with an
acoustically reflective frame. The frame shall be solid, not hollow, and shall have no air space between the
test specimen and the frame or between the room surface and the frame. A frame of 1,0 mm steel, 12,5 mm
gypsum board or 12,5 mm wood (minimum thicknesses) may be used. The frame shall be tightly butted to the
test specimen and sealed to the room surface. The exposed face of the frame shall be flush with the surface
of the test specimen.
B.4 Type E mounting
The test specimen is mounted with an airspace behind it. The suffix of the designation (e.g. Type E-400) shall
be the distance rounded off to the nearest integral multiple of 5 mm between the exposed face of the test
specimen and the room surface behind the specimen. If a Type E mounting is used, the specimen shall be
tested in either an E-400, E-300 or E-200 configuration. Other air spaces may be used in addition to the
200 mm, 300 mm or 400 mm distances.
The mounting fixture shall be constructed of metal, wood or other non-porous material with a surface density
of at least 20 kg m2, and shall enclose an air space behind the sample that does not have any interior
partitions unless provided as part of the sample. The joint between the fixture and the room surface shall be
sealed to prevent air leaks between the enclosed space and the outside. The fixture shall cover the perimeter
edges of the test specimen. The joints between the fixture and the room surface and between the fixture and
the test specimen shall be sealed to prevent air leakage between the enclosed space and the outside.
The Type E mounting may be placed on the floor of the room with the test specimen pointing upwards, unless
the construction of the sample will affect the sound absorption due to gravity effects.
B.5 Type G mounting
The test specimen, such as a curtain, drapery, window shade or window blind, is hung parallel to the room
surface. The suffix of the mounting designation (e.g. Type G-100) shall be the distance from the face of the
test specimen to the room surface. If a Type G mounting is used, the specimen shall be tested in the G-100
configuration. Other air spaces may be used in addition to the 100 mm distance.
If another distance is used, it shall be an integral multiple of 50 mm. The specimen may be tested with or
without a perimeter frame, depending on how it is used in practice. If a perimeter frame is used, it shall be
butted against the specimen and sealed to the room surface.
Other curtain arrangements are possible and may be tested. The test report shall describe the specific
arrangement in detail.
B.6 Type I mounting
This mounting is used for spray- or trowel-applied materials, such as plaster. The material shall be applied to
a suitable substrate. Care shall be taken to prevent distortion of the substrate while the applied material is
curing. The test specimen shall be tested in a Type A mounting including a frame around the test specimen.
16
Copyright International Organization for Standardization
Provided by IHS under license with ISO
No reproduction or networking permitted without license from IHS
© ISO 2003 — All rights reserved
Not for Resale
ISO 354:2003(E)
B.7 Type J mounting
This mounting shall be used for the general specification of the sound absorption per unit of rectangular unit
sound absorber pads or baffles. The sound absorber pads or baffles shall be mounted with one edge resting
on or touching a room surface. Optional mountings with ground clearance may be used. There shall not be an
air space between the baffle edge and the room surface. The treated surface of the floor shall be between
10 m2 and 15 m2.
The baffles shall be arranged in two or three parallel rows. There shall not be an airspace between the single
baffles in a row. The shortest distance from any baffle to a room surface other than the surface which the
baffles are touching shall be at least 1 m, unless these surfaces are a part of the barrier.
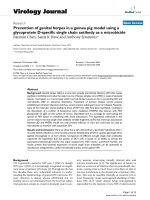
The array of baffles or pads shall be surrounded by a non-absorptive barrier. One or two walls of the
reverberation room may be used as part of the barrier, as shown in Figures B.1 and B.2 respectively. The part
of the barrier parallel to the absorptive area of the baffles or pads shall be d/2 from the centreline of the
nearest row of baffles or pads, where d is the distance between the parallel rows. The part of the barrier
perpendicular to the rows of baffles or pads shall be flush with the ends of the baffles or pads. For the height
of the barrier, the following two designs are possible.
a)
Well approach:
The height of the barrier shall be the same as the height of the baffles or pads, as shown in Figure B.3.
--`,,`,-`-`,,`,,`,`,,`---
b)
Deep well approach:
The barrier shall be 0,8 m higher than the baffles or pads, but the height of the barrier shall not exceed
half of the height of the reverberation room, as shown in Figure B.4.
The barrier shall not be removed from the room for the empty room measurements.
Dimensions in metres
Key
1 baffles
2 barrier
d
is the distance between the parallel rows
Figure B.1 — Example of a Type J mounting using surrounding non-absorptive barrier (top view)
17
© ISO 2003 — All rights reserved
Copyright International Organization for Standardization
Provided by IHS under license with ISO
No reproduction or networking permitted without license from IHS
Not for Resale
ISO 354:2003(E)
Dimensions in metres
--`,,`,-`-`,,`,,`,`,,`---
Key
1
baffles
2
barrier
d
is the distance between the parallel rows
Figure B.2 — Example of a Type J mounting using surrounding non-absorptive barrier (top view)
18
Copyright International Organization for Standardization
Provided by IHS under license with ISO
No reproduction or networking permitted without license from IHS
© ISO 2003 — All rights reserved
Not for Resale
--`,,`,-`-`,,`,,`,`,,`---
ISO 354:2003(E)
Key
1
baffles
2
barrier
ha is the height of the absorber
Figure B.3 — Example of a Type J mounting, “well approach”
19
© ISO 2003 — All rights reserved
Copyright International Organization for Standardization
Provided by IHS under license with ISO
No reproduction or networking permitted without license from IHS
Not for Resale