Renewables information2017 overview
Bạn đang xem bản rút gọn của tài liệu. Xem và tải ngay bản đầy đủ của tài liệu tại đây (504.63 KB, 11 trang )
s t a t i s t i c s
Renewables
information:
Over view
2017
2 - RENEWABLES INFORMATION: OVERVIEW (2017 edition)
The following analysis is an overview from the publication Renewables Information 2017.
Please note that we strongly advise users to read definitions, detailed methodology and country specific notes
which can be found online under References at www.iea.org/statistics/topics/renewables/
Please address your inquiries to
Please note that all IEA data is subject to the following Terms and Conditions found on the IEA’s website:
/>
INTERNATIONAL ENERGY AGENCY
RENEWABLES INFORMATION: OVERVIEW (2017 edition) - 3
OVERVIEW OF RENEWABLES AND
WASTE IN THE WORLD
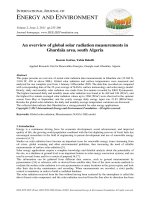
Figure 2: 2015 product shares in
world renewable energy supply
In 2015, world Total Primary Energy Supply (TPES)
was 13,647 Mtoe, of which 13.4%, or 1,823 Mtoe (up
from 1,784 Mtoe in 2014), was from renewable energy sources (Figure 1).
Solar, Tide
3.0%
Figure 1: 2015 fuel shares in
world total primary energy supply
Oil
31.8%
Biofuels
and waste
70.7%
Wind
4.0%
Other¹
0.3%
Natural
Gas
21.6%
Liquid
biofuels
4.3%
Geothermal
4.1%
Renewable
municipal
waste
0.9%
Solid biofuels/
charcoal
63.7%
Hydro
2.5%
Nuclear
4.9%
Hydro
18.3%
Biofuels
and
waste
9.4%
Renewables
13.4%
Coal
28.1%
Solar, wind,
geoth., tide
1.5%
1. Other includes electricity from energy sources not defined above
such as non-renewable wastes, peat, oil shale and chemical heat.
Note: Totals in graphs might not add up due to rounding.
Due to its widespread non-commercial use in developing countries (i.e. residential heating and cooking),
solid biofuels/charcoal remains the largest renewable
energy source, representing 63.7% of global renewables supply (Figure 2). The second largest source is
hydro power, which provides 2.5% of world TPES or
18.3% of renewable energy supply. Geothermal, liquid biofuels, biogases, solar, wind, and tide each hold
a smaller share making up the rest of the renewables
energy supply.
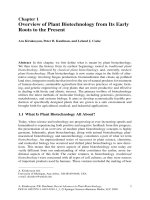
Since 1990, renewable energy sources have grown at
an average annual rate of 2.0%, which is slightly higher
than the growth rate of world TPES, 1.8% (Figure 3).
Biogases
1.7%
Note: Totals in graphs might not add up due to rounding.
Growth has been especially high for solar photovoltaic and wind power, which grew at average annual
rates of 45.5% and 24.0% respectively, both from
very low bases in 1990. Biogases had the third highest
growth rate at 12.8%, followed by solar thermal
(11.4%) and liquid biofuels (10.1%).
Figure 3: Average annual growth rates of world
renewables supply from 1990 to 2015
50%
Solar PV
45.5%
45%
40%
35%
30%
Wind
24.0%
25%
20%
15%
10%
5%
Total
TPES
1.8%
Renewables
2.0%
Biogases Solar
Liquid
12.8% thermal
biofuels
11.4% 10.1%
Solid
Geobiofuels/
thermal Hydro
Charcoal
3.1% 2.4%
1.1%
0%
INTERNATIONAL ENERGY AGENCY
4 - RENEWABLES INFORMATION: OVERVIEW (2017 edition)
The average annual growth rate of hydroelectric power in non-OECD countries between 1990 and 2015,
was 3.9%, much larger than the 0.6% growth in
OECD countries. Growth in non-OECD was mainly
driven by China accounting for 63.8% of hydro power
increase in non-OECD countries. China showed 9.1%
of growth rate between 1990 and 2015. Viet Nam and
Mozambique are the other main contributors to the
high growth rate, with average annual growth rates of
9.8% and 17.8% respectively.
In 2015, non-OECD countries accounted for 64.5% of
total hydro power and any further increase is likely to
be from these countries, as most of the remaining
hydro potential resides in these countries.
Non-OECD countries also account for most of the
production of solid biofuels. In 2015, 83.7% was produced and consumed in non-OECD countries, where
developing countries, situated mainly in Asia and
Africa, use non-commercial biomass for residential
cooking and heating (Figure 4). Africa, which accounted for only 5.8% of the world’s total TPES in
2015, accounted for 32.4% of the world’s solid biofuels supply.
Figure 4: 2015 regional shares
in renewables supply
Solid Biofuels
Non-OECD
Europe
and
Eurasia
1.5%
Middle
East
0.1%
China
8.5%
Hydro¹
Non-OECD
Europe
and
Eurasia
7.4%
OECD
Total
16.3%
Middle
East
0.5%
OECD
Total
35.5%
China
28.7%
Asia
excluding
China
32.3%
Non-OECD
Americas
8.9%
Africa
32.4%
Asia
excluding
China
8.2%
Africa
3.1%
Non-OECD
Americas
16.6%
major role when looking at “new” renewables, a
loosely defined term used to delineate between traditional and more recent technologies used to produce
renewable energy. In 2015, the OECD countries accounted for 64.0% of world energy from solar, wind,
tide, renewable municipal waste, biogases and liquid
biofuels, whilst Africa represented 0.4%, 9.4% for
Non-OECD Americas, 5.0% for Asia excluding China,
and 20.1% for China.
Figure 5: 2015 shares of renewables of
regional total primary energy supply
60%
49.8%
50%
40%
29.6%
30%
25.0%
20%
10%
8.4%
9.6%
4.1%
OECD
Total
Africa
Non-OECD
Asia
Americas excluding
China
Largely because of their use of non-commercial solid
biofuels, non-OECD countries are the principal renewable energy users, accounting for 72.3% of world total
renewables supply. On the other hand, while OECD
countries supply 27.7% of world renewables, they
constitute 38.5% of the world TPES. In OECD countries the share of renewables in total energy supply is
9.6% compared to 49.8% in Africa, 29.6% in NonOECD Americas, 25.0% in Asia excluding China
(Figure 5). However, the OECD countries play a
INTERNATIONAL ENERGY AGENCY
China
Non-OECD
Europe and
Eurasia
Middle
East
About half of the renewable primary energy supply in
OECD countries is used in the transformation sector
to generate electricity and sold heat. However, on a
global level a majority of renewables is consumed in
the residential, commercial and public services sectors. Again, this is a consequence of widespread solid
biofuels use in the residential sector of developing
countries. In fact, globally 35.1% of renewables are
used for electricity production and heat production
worldwide, while 45.0% are used in the residential,
commercial and public sectors (Figure 6).
Figure 6: 2015 world sectoral consumption
of renewables
Electricity
plants
31.8%
1. Excludes pump storage generation.
Note: Totals in graphs might not add up due to rounding.
0.4%
0%
Residential/
Comm. &
Public²
45.0%
Combined
heat & power
plants
2.9%
Transport
4.2%
Industry
10.2%
Heat plants
0.5%
Other¹
5.5%
1. Other transformation, energy industry own use, losses.
2. Includes the Agriculture/ forestry, fishing and non-specified
industries.
Note: Totals in graphs might not add up due to rounding.
RENEWABLES INFORMATION: OVERVIEW (2017 edition) - 5
Renewables were the third largest contributor to global electricity production in 2015. They accounted for
22.8% of world electricity generation, after coal
(39.3%) and gas (22.9%) and ahead of nuclear
(10.6%) and oil (4.1%). However, the relative position
of renewables and gas can be influenced by various
factors among which the weather conditions play
prime role.
Hydroelectricity supplies the vast majority of renewable electricity, generating 16.0% of world electricity,
which is 70.3% of total renewable electricity, whilst
biofuels and waste, including solid biofuels, play a
minor role in electricity generation, supplying 1.9% of
world electricity. Although growing rapidly, geothermal, solar, wind and tide energies accounted for only
4.8% of world electricity production, 21.2% of total
renewable electricity in 2015.
Since 1990, renewable electricity generation worldwide grew on average by 3.6% per annum, which is
slightly faster than the total electricity generation
growth rate (2.9%). So whilst 19.4% of global
electricity in 1990 was produced from renewable
sources, this share has increased to 22.8% in 2015.
Over this period, hydroelectric power saw its share of
total world electricity production fall from 18.1% in
1990 to 16.0% in 2015. Taking out hydroelectricity
from renewables, the share of the remaining renewable sources used to produce electricity grew from
1.3% in 1990 to 6.8% in 2015.
Figure 7: Fuel shares in
world electricity production in 2015
Other¹
0.4%
Oil
4.1%
Natural
Gas
22.9%
Nuclear
10.6%
Hydro
16.0%
Renewables
22.8%
Coal
39.3%
Biofuels and
waste
1.9%
Solar, wind,
geoth., tide
4.8%
1. Other includes electricity from energy sources not defined above
such as non-renewable wastes, peat, oil shale, and chemical heat.
Note: Totals in graphs might not add up due to rounding.
INTERNATIONAL ENERGY AGENCY
6 - RENEWABLES INFORMATION: OVERVIEW (2017 edition)
OVERVIEW OF RENEWABLES AND
WASTE IN OECD COUNTRIES
In 2016, the share of renewables in total OECD primary energy supply reached 9.7%, the highest share
since the IEA time series began in 1990 (Figure 8).
This represents a slowdown in the growth of the share
of renewables in TPES with the share increasing from
9.6% in 2015 and 9.4% in 2014, but well above the 6%
level of 1990. OECD Europe experienced an increase
in renewable TPES from 14.0% in 2015 to 14.2% in
2016. OECD Americas showed an increase in renewable TPES from 8.2% to 8.5% in the same period. On
the other hand, OECD Asia experienced a decrease in
renewables share in TPES from 5.0% to 4.8%.
Figure 8: 2016 fuel shares in
OECD total primary energy supply
Natural
Gas
26.9%
Oil
36.0%
Other¹
0.6%
Nuclear
9.8%
Renewables
9.7%
Coal
17.0%
TPES for non-renewable energy sources (including
coal, oil, gas and nuclear) was 0.4%.
The largest portion of renewable primary energy supply in the OECD comes from biofuels and waste,
which accounted for 53.7% of the renewable supply
(Figure 9). Of the biofuels, solid biofuels, including
wood, wood wastes, other solid wastes and charcoal,
constitutes the largest share, 36.1% of the renewable
supply. The second largest renewable energy source is
hydroelectric power, providing 23.5% of renewable
primary energy. Solid biofuels and hydro accounted
for 59.6% of the total OECD primary renewable
energy in 2016.
Figure 9: 2016 product shares in
OECD renewable energy supply
Hydro
2.3%
Biofuels and
waste
5.2%
Solar, Tide
5.5%
Liquid
biofuels
10.3%
Geothermal
7.2%
Wind
10.1%
Biofuels
and waste
53.7%
Renewable
municipal
waste
3.0%
Solid biofuels/
charcoal
36.1%
Solar, wind,
geoth., tide
2.2%
1. Other includes energy sources not classified elsewhere such as
non-renewable combustible wastes, ambient air for pumps, fuel cells,
hydrogen, etc.
Note: Totals in graphs might not add up due to rounding.
Primary energy supply
In OECD countries, total primary energy supply (TPES)
from renewable sources increased from 272 Mtoe to
512 Mtoe between 1990 and 2016, an average annual
growth rate of 2.5%. By comparison, the growth of
INTERNATIONAL ENERGY AGENCY
Hydro
23.5%
Biogases
4.3%
Note: Totals in graphs might not add up due to rounding.
The average annual growth rate of solid biofuels between 1990 and 2016 was 1.2% and 0.7% for hydro
(Figure 10), lower than the average annual growth rate
of all renewable energies, 2.5%. This is mainly because hydroelectric capacity is mature in most OECD
member states, and increasingly difficult to locate
suitable sites to expand this energy form.
RENEWABLES INFORMATION: OVERVIEW (2017 edition) - 7
Liquid
biofuels Solar PV
41.7%
43.3%
50%
45%
40%
35%
30%
Wind
21.4%
25%
20%
15%
Total
TPES
0.6%
10%
5%
0%
Renewable
2.5%
Biogases
10.8% Solar
thermal Solid
6.0% biofuels/ GeoCharcoal thermal Hydro
1.2%
1.3% 0.7%
Solid biofuels and hydro influenced much of the
growth of total renewables between 1990 and 2001
(Figure 11). However, since 2001, the majority of renewables growth can be attributed to “new” renewables
which have all seen growth rate above the average for
all renewables. For example, solar photovoltaic experienced the highest growth among the renewables, averaging 43.3% between 1990 and 2016. Also experiencing high growth rates are liquid biofuels, 41.7%, and
wind, 21.4% per annum since 1990. Biogases have
grown much more rapidly than solid biofuels, with an
average annual growth rate of 10.8%.
Among the different OECD regions, OECD Europe
has the highest share of primary energy supply from
renewable sources, with 14.2% in 2016 (Figure 12)
and the largest increase in its renewable share since
1990 (up from 5.8%). The increase of the renewable
share in OECD Europe is the result of the implementation
of strong policies supporting renewable energy in the late
1990s and early 2000s, in particular the European Union’s
directive to increase the share of renewable energy in
TFC to 20% by 2020, which includes targets for individual countries. The renewable share of TPES in OECD
Americas reached 8.5% in 2016, the highest level since
the IEA time series began. In OECD Asia Oceania the
share of renewable primary energy supply remained more
constant between 1990 and 2016 (from 4.0% to 4.8%).
Figure 12: OECD regional shares in
renewable energy supply
16%
14%
Share of renewable energy
Figure 10: Annual growth rates of
renewable supply from 1990 to 2016 in OECD total
12%
10%
8%
6%
4%
2%
0%
Figure 11: OECD renewable primary energy supply
by product
OECD Total
OECD Asia Oceania
OECD Americas
OECD Europe
600
As a result of diversification in the use of renewables,
sectoral renewables consumption has changed compared to 1990 (Figure 13). The most significant trend
is the steep growth of biofuels used for transport. In
2015, liquid biofuels and biogases used for transport
constituted 9.8% of the consumption of renewables.
500
Mtoe
400
300
200
100
Figure 13: OECD sectoral consumption
of renewables
0
1990
Renewable municipal waste, liquid biofuels, biogases
Solar, wind, tide
Geothermal
Solid Biofuels/ Charcoal
Hydro
However, despite these significant growth rates, the
contribution of such “new” renewables to the total energy supply is still relatively small. Renewable municipal waste, biogases, liquid biofuels, wind, solar, and
tide combined still represent only 3.2% of total primary energy supply. Nevertheless, their growing contribution to the renewable energy supply should be noted as their share of total renewables in OECD countries increased from 3.1% in 1990 to 33.2% in 2016.
2015
Residential/
Commercial
& Public¹
23.6%
Transport²
0.0%
Residential/
Commercial
& Public¹
16.6%
Electricity
plants
50.9%
Industry
12.9%
Electricity
plants
50.7%
Industry
13.1%
Other
0.1%
Heat plants
0.7%
Transport
9.8%
Combined
heat &
power
plants
11.8%
Other
0.2%
Heat plants
1.2%
Combined
heat &
power
plants
8.3%
1. Includes the Agriculture/ forestry, fishing and non-specified industries.
2. Represents less than 0.05%.
Note: Totals in graphs might not add up due to rounding.
INTERNATIONAL ENERGY AGENCY
8 - RENEWABLES INFORMATION: OVERVIEW (2017 edition)
Electricity production
OECD gross electricity production from renewable
products (excluding generation from pumped storage
plants) reached 2 588.3 TWh in 2016, a 3.8% increase
from the 2015 level of 2 494.1 TWh. This represents
23.8% of total OECD electricity production in 2016
(Figure 14), which is the largest share of renewables
in gross electricity production for any year in the renewables time series beginning from 1990.
Wind
5.5%
The share of non-hydro renewable electricity in total
OECD electricity production increased from 1.8% in
1990 to 10.9% in 2016. In 1990, the majority of nonhydroelectricity was generated by solid biofuels and
geothermal energy accounting for 7.2% and 2.2% of
renewable electricity respectively, whilst solar photovoltaic, wind, biogases and liquid biofuels combined
represented less than 0.6%. However, between 1990
and 2016, these technologies grew much faster than
any other power source (Figure 15). Most notable is
wind, which grew from 0.3% in 1990 to 23.2% of renewable electricity in 2016, a 21.4% average annual
growth rate, making it now the second largest renewable source for electricity. The share of solar PV in
OECD renewable electricity production increased
from 0.0% to 8.4 % in the same time period, and biogases increased from 0.3% to 3.1%, average growth
from 1990 of 43.3% and 12.7% respectively. All of
these sources experienced higher average growth rates
than older technologies such as hydro power (0.7%),
solid biofuels (2.6%) and geothermal (2.3%). As a result, non-hydro renewable electricity production experienced an 8.5% of average annual growth rate between 1990 and 2016 (Figure 15).
Solar th.,
geoth., tide
0.6%
Figure 15: Annual growth rates of electricity
production between 1990 and 2016
in OECD countries
The increase in electricity production from renewables was mainly caused by wind and solar PV. For
wind, electricity production increased by 43.1 TWh
which is mostly coming from the US (36.3 TWh), followed by Turkey (3.8 TWh) and Italy (2.8 TWh). Solar PV increased by 35.0 TWh, again mainly driven
by the US, which had increased electricity production
from solar PV by 18.0 TWh, followed by Japan
(8.0 TWh), UK (2.7 TWh) and Chile (1.3 TWh).
Figure 14: Renewable shares in OECD electricity
production in 2016
Nuclear
18.0%
Other¹
0.7%
Natural
Gas
27.7%
Renewable
23.8%
Hydro
12.9%
Biofuels and
waste
2.8%
Solar PV
2.0%
Oil
2.0%
Coal
27.8%
power has reached its capacity limit in most OECD
countries. Hydroelectricity generated 15.4% of total
OECD electricity in 1990 but this share has decreased
to 12.9% in 2016. With growth in other types of renewables, the hydroelectricity share of electricity
from renewable energy sources declined from 89.4%
in 1990 to 54.2% in 2016.
50%
1. Other: electricity from energy sources not classified by other
categories such as non-renewable combustible wastes, peat,
chemical sources, etc.
Since 1990, electricity generation from renewable energy sources in OECD has been growing at an average
rate of 2.6% per year, almost double the rate for total
electricity generation (1.4%), mainly through the strong
growth in “new” renewable products, such as solar PV,
wind, renewable municipal waste and biogases.
Among renewables sources, hydroelectric power production has experienced the lowest average growth
rate of any renewables electricity source from 1990 to
2016, 0.7% (Figure 15). This is because hydroelectric
INTERNATIONAL ENERGY AGENCY
Average annual growth rate
Note: Totals in graphs might not add up due to rounding.
43.3%
45%
40%
35%
30%
25%
21.4%
20%
15%
12.7%
10%
5%
0%
8.5%
0.7%
1.4%
5.5%
2.3%
2.6%
RENEWABLES INFORMATION: OVERVIEW (2017 edition) - 9
Figure 16: Shares in OECD renewable electricity
production in 2016
Geothermal
2.0%
Wind
23.2%
Hydro
54.2%
Non-hydro
45.8%
Solar PV
8.4%
Solid biofuels
7.1%
Liquid
biofuels
0.3%
Solar thermal,
Tide
0.5%
Biogases
3.1%
Renewable
municipal
waste
1.3%
Note: Totals in graphs might not add up due to rounding.
Renewable electricity production in OECD Europe
grew 3.6% per annum since 1990. This growth rate is
higher than other OECD regions, 1.9% for OECD
Americas and 2.1% for OECD Asia Oceania. OECD
Europe supplied 46.0% of total OECD renewable
electricity production in 2016, up from 35.5% in
1990, slightly higher than the level of OECD
Americas of 44.3%. The shares of electricity from
renewables increased from 18.5% in 1990 to 21.4% in
2016 in OECD Americas, from 17.6% to 33.3% in
OECD Europe, and from 12.3% in 1990 to 12.7% in
OECD Asia Oceania (Figure 17). As a result of these
increases, the OECD region as a whole saw its share
of electricity from renewable sources grow to 23.8%
in 2016 from 17.3% in 1990.
Figure 17: OECD regional shares in
renewable electricity production
from 1990 to 2016
Share of renewable electricity
35%
Installed generating
capacity
In 2015, 957.3 GW, 33.1% of total OECD generating
capacity, was renewable energy and waste sources
(Figure 18). Compared to 2014, total electricity generation capacity increased by 31.5 GW with the biggest growth seen in solar PV (28.6 GW) and wind
(24.6 GW), offsetting the decreases experienced in
nuclear (-2.5 GW) and combustible fuels (-27.6 GW).
The largest increase in solar PV occurred in Japan
which added 10.8 GW, followed by the US (6.8 GW)
and the UK (3.8 GW). The sum of these three countries
account for 74.6% of total increase. Regarding wind
capacity, the largest growth was in the US, 8.3 GW,
followed by Germany with 5.5 GW increment.
Figure 18: OECD generating capacity 2015
Other²
0.1%
Hydro
16.7%
Biofuels and
waste
2.1%
Geothermal
0.2%
Combustible
fossil fuels¹
56.5%
Solar PV
5.6%
Renewables
&
waste
16.4%
Nuclear
10.4%
Wind
8.2%
Solar thermal,
Tide
0.2%
1. The capacities of plants which co-fire biofuels and waste with
fossil fuels (e.g. solid biofuels that are co-fired with coal) are included
under the dominant fuel.
2. Other: fuel cells, waste/chemical heat.
Note: Totals in graphs might not add up due to rounding.
30%
The largest share (16.7%) of total generating capacity is
hydroelectric plants, 483.4 GW, followed by 238.5 GW
from wind (8.2%), 161.7 GW from solar photovoltaic
(5.6%), and 62.1 GW from biofuels and waste (2.1%).
25%
20%
15%
10%
5%
0%
OECD Total
OECD Americas
OECD Asia Oceania
OECD Europe
Of the biofuels and waste, 31.6 GW was solid biofuel
capacity, 12.6 GW was municipal waste, 13.2 GW was
biogases and 2.4 GW was liquid biofuels. The remaining generating capacity is accounted for by geothermal (0.2%), solar thermal, tide, wave and ocean
power capacity, with less than 0.2%. Hydro pumped
storage capacity represented 70.7 GW.
INTERNATIONAL ENERGY AGENCY
10 - RENEWABLES INFORMATION: OVERVIEW (2017 edition)
This section provides more detailed analyses of individual renewable and waste energy sources in the
electricity production. The energy sources are listed in
the order of decreasing share in the renewable electricity production of OECD countries.
Hydroelectricity
As mentioned above, hydroelectric power is nearing
its potential capacity limit in most OECD countries.
Between 1990 and 2016, electricity generated from
hydroelectric plants (excluding generation from
pumped storage plants) increased from 1,183.8 TWh to
1 401.9 TWh in the OECD, yielding an average annual
increase of 0.7%. While 89.4% of electricity produced
from renewable sources came from hydroelectric plants
in 1990, this share decreased to 54.2% in 2016 due to
the rapid growth of electricity generation from other
renewable sources. Despite this decrease, hydroelectric
power is still the largest electricity producer among
renewable technologies. In 2016, the largest hydroelectric power generating countries were Canada, the
United States and Norway which represented 27.7%,
19.1% and 10.2%, respectively, of OECD hydroelectric
production. Whilst the highest share in total electricity
generated was seen in Norway (96.3%) followed by
Iceland (72.6%) and Austria (61.2%).
Wind
In 2016, wind turbines produced 23.2% of renewable
electricity in the OECD. Between 1990 and 2016,
wind power increased from 3.8 TWh to 599.4 TWh,
achieving an average annual growth rate of 21.4%.
This is the second fastest growth rate of renewable
electricity after solar photovoltaic. Among OECD regions, wind electricity production is the highest in
OECD Europe, with 51.4% of the total OECD production in 2016. Most of the growth also occurred in
OECD Europe, where wind grew by 25.9% per annum. In absolute terms, the United States, Germany
and Spain are the largest producers of electricity from
wind within the OECD, producing 229.3 TWh,
77.4 TWh and 48.9 TWh respectively.
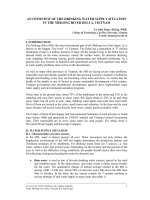
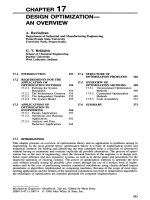
Solar photovoltaic
The OECD as a whole produced 218.3 TWh of PV
electricity in 2016, 8.4% of its total renewable electricity production. The five largest producers of solar
INTERNATIONAL ENERGY AGENCY
photovoltaic (PV) electricity in the OECD were the
United States with 50.1 TWh, Japan with 43.8 TWh,
Germany with 38.2 TWh, Italy with 22.9 TWh, and the
UK with 10.3 TWh. These five countries combined
produced 75.7% of the PV electricity in the OECD.
While being small in absolute terms, electricity from
solar PV increased from 19 GWh in 1990 to
218 283 GWh in 2016, achieving a 43.3% annual
growth rate, the fastest of all renewable electricity
technologies. US, the largest producer among OECD
countries, increased production from 183 GWh in
2000 to 50 103 GWh in 2016, achieving a 42.0%
growth rate over that time (Figure 19). Japan, the second largest producer, increased production from
347 GWh in 2000 to 43 846 GWh in 2016, with a
growth rate over those years of 35.3%.
Figure 19: Solar photovoltaic electricity
in six major OECD producing countries
from 1990 to 2016
60000
50000
40000
GWh
Detailed electricity
production by source
30000
20000
10000
0
United States
Italy
Japan
United Kingdom
Germany
France
Solid biofuels
Electricity generation from solid biofuels grew from
95.2 TWh to 184.3 TWh between 1990 and 2016, a
2.6% average annual growth. As the fourth largest renewable electricity source, solid biofuels accounted
for 7.1% of renewable electricity generation in 2016.
The United States (45.3 TWh) accounted for 24.6% of
electricity generated from solid biofuels within the
OECD, where it makes up 7.1% of the country’s renewable electricity production. The second largest
producer of electricity from solid biofuels is Japan
(29.3 TWh), where it represents 18.1% of the country’s renewable electricity supply. Other large producers of electricity from solid biofuels in the OECD in
2016 are the UK, Germany, and Finland, producing
19.6 TWh, 11.0 TWh and 10.8 TWh respectively.
RENEWABLES INFORMATION: OVERVIEW (2017 edition) - 11
Biogases
Electricity in the OECD from biogases grew from
3.7 TWh in 1990 to 81.3 TWh in 2016. With an average annual growth rate of 12.7% since 1990, biogases
are the third fastest growing source of renewable electricity in the OECD.
The driver of this growth is OECD Europe, which accounted for 79.5% of OECD production in 2016.
Much of the growth is due to Germany, where production grew by 20.9% per annum since 1990, making it the largest producer in the OECD (42.0%). The
third and fourth largest OECD producers were also
located in Europe. Italy produced 9.0 TWh or 11.0%
of OECD production, and the United Kingdom produced 7.4 TWh (9.2%).
The second largest OECD producer in 2016 is the
United States which produced 13.3 TWh, or 16.3% of
electricity from biogases in the OECD. However,
despite its large share in OECD production, the
United States growth rate (6.6% per year since 1990)
has been lower than many of the European Union
countries that use biogases, e.g. 38.2% in Italy and
20.9% in Germany.
Geothermal
Similar to hydroelectric power, geothermal electricity
production has not experienced significant growth between 1990 and 2016. It grew at an average annual
rate of 2.3%, from 28.6 TWh to 51.8 TWh.
Geothermal electricity generation remained almost
static in OECD Americas over the period 1990 to
2016, although the region remains the largest geothermal electricity producer, with a 48.8% share of
OECD production in 2016. The United States is the
largest producer with 37.2% of the OECD total in
2016, with a production of 19.2 TWh, slightly above
the 16.0 TWh level in 1990. The second largest producer is New Zealand, with 7.9 TWh in 2016, representing 15.2% of total OECD production. Other major
producers are Italy (12.0%), Mexico (11.7%), and
Iceland (9.8%).
Renewable municipal waste
Renewable municipal waste represented 1.3% of
renewable electricity generation in 2016 in OECD
countries. Renewable municipal waste has one of the
smallest portions of renewable electricity portfolio.
The highest share it represented in any one country is
the Netherlands at 13.8%, Luxembourg at 9.3% and
Hungary at 7.6%.
It should be noted that sometimes data are estimates
rather than observations because the energy classification systems of some countries do not separate renewable and non-renewable municipal waste.
In 2016, 32.8 TWh of electricity was produced from
renewable waste in the OECD. By far the largest producer of electricity from renewable municipal waste is
the United States, generating 8.4 TWh, or 25.6% of
OECD production. The second largest producer is
Germany, with a production of 6.0 TWh (18.2%).
With 2.6 TWh (7.8%), the UK is the third largest producer. Italy experienced the highest growth rate, increasing production from 37.0 GWh to 2,538 GWh (a
growth rate of 17.7% per annum).
Liquid biofuels
Liquid biofuels for electricity production is a relatively
new technology. The first country to report electricity
production of this type was Germany in 2001 with
15 GWh. Since then, an increasing number of countries have produced substantial amounts of electricity
from liquid biofuels. In 2016, ten countries reported a
total of 6 499 GWh of production. The largest producer currently is Italy with 4,818 GWh.
Solar thermal
Solar thermal power production experienced rapid
growth in the 1980’s and 90’s reaching 887 GWh in
1998, but stagnated in the following years. During the
period of 1999 to 2006, average annual growth rates
for solar thermal were essentially zero. Due to the recent renewed interest in solar thermal, the US has
increased its production from 527 GWh in 1999 to
5 533 GWh in 2016. Prior to 2007, OECD solar thermal production took place mostly in the United States
with small demonstration plants in Australia. With the
opening of a new solar thermal power plant in 2007,
Spain became the third OECD country to report electricity production from solar thermal with 5 506 GWh
in 2016. These three countries combined produced all
11 045 GWh of OECD electricity from solar thermal
in 2016.
Tide, wave, ocean
In 2016, 1 008 GWh of electricity were generated from
tide, wave and ocean motion in three OECD countries.
In 2016, France and Korea produced 500 GWh and
495 GWh respectively. The other contributor was
Canada producing 13 GWh in 2016.
INTERNATIONAL ENERGY AGENCY