Exchange rate pass through to vietnams import and domestic prises
Bạn đang xem bản rút gọn của tài liệu. Xem và tải ngay bản đầy đủ của tài liệu tại đây (2.11 MB, 89 trang )
-,;
UNIVERSITY OF ECONOMICS
INSTITUTE OF SOCIAL STUDIES
HO CHI MINH CITY
THE HAGUE
VIETNAM
THE NETHERLANDS
VIETNAM- NETHERLANDS
PROGRAMME FOR M.A IN DEVELOPMENT ECONOMICS
EXCHANGE RATE PASS-THROUGH TO VIETNAM'S
IMPORT AND DOMESTIC PRICES
BY
CAIBAOHIEU
MASTER OF ARTS IN DEVELOPMENT ECONOMICS
HO CHI MINH CITY, DECEMBER 2012
UNIVERSITY OF ECONOMICS
INSTITUTE OF SOCIAL STUDIES
HO CHI MINH CITY
THE HAGUE
VIETNAM
THE NETHERLANDS
VIETNAM- NETHERLANDS
PROGRAMME FOR M.A IN DEVELOPMENT ECONOMICS
EXCHANGE RATE PASS-THROUGH TO VIETNAM'S
IMPORT AND DOMESTIC PRICES
A thesis submitted in partial fulfilment of the requirements for the degree of
MASTER OF ARTS IN DEVELOPMENT ECONOMICS
By
CAl BAO HIEU
Academic Supervisor:
Dr. DINH CONG KHAI
HO CHI MINH CITY, DECEMBER 2012
Contents
Chapter 1: Introduction ..................................................................................................... 1
1.1
Problem statement .................................................................................................. 1
1.2
Research questions ................................................................................................. 2
1.3
Research objectives ................................................................................................ 3
Chapter 2:
Overview of Vietnam's exchange rate, import activities and inflation .......... 4
2.1
Exchange rate arrangement in Vietnam ................................................................. 4
2.2
Overview of Vietnam's import activities ............................................................... 7
2.3
Overview of Vietnam's inflation ........................................................................... 8
Chapter 3: Literature review ........................................................................................... 10
3.1
Linear approarch .................................................................................................. 10
3.2
Vector Error Correction Model approach ............................................................ 11
3.3
Vector Autoregression approach .......................................................................... 11
Chapter 4:
4.1
Research methodology ......................................................................................... 14
4.2
Empirical framework ........................................................................................... 16
4.3
Data description ................................................................................................... 17
Chapter 5:
•
Research methodology, empirical framework and data description ............. 14
Empirical results ............................................................................................ 20
5.1
ADF tests .............................................................................................................. 20
5.2
Optimal lag length ................................................................................................ 20
5.3
VAR regression .................................................................................................... 20
5.4
Impulse response function: .................................................................................. 24
5.4.1
Response to exchange rate of foreign price index ........................................ 24
5.4.2
Response to exchange rate of import price index ......................................... 25
--~
•
5.4.3
Response to exchange rate of consumer price index .................................... 26
5.4.4
Response to foreign price index of import price index ................................. 27
5.4.5
Response to foreign price index of consumer price index ............................ 28
5.4.6
Response to output gap of money supply ..................................................... 29
5.4.7
Response to output gap of consumer price index ......................................... 30
5.4.8
Response to money supply of consumer price index .................................... 31
5.4.9
Response to import price index of money supply ......................................... 32
5.4.10 Response to import price index of consumer price index ............................. 33
5.4.11
Response to consumer price index of money supply .................................... 34
5.5
Variance decomposition ....................................................................................... 35
5.6
Granger causality test ........................................................................................... 36
5.7
VARstable ........................................................................................................... 37
5.8
Lagrange multiplier test ....................................................................................... 38
Chapter 6:
Conclusion, Policy Recommendation and Future Work ............................... 39
6.1
Conclusion ........................................................................................................... 39
6.2
Policy Recommendation ...................................................................................... 40
6.3
Future Work ......................................................................................................... 41
References ......................................................................................................................... 42
Appendices ........................................................................................................................ 45
•
ii
-- ------------
List of figures
Figure 1: REER, NEER and Exchange rate 1995-2012 ...................................................... 6
Figure 2: Import by commodity group ofVietnam 1995-2010 ........................................... 7
Figure 3: Inflation ofVietnam 1996-2010 .......................................................................... 8
Figure 4: NEER, IMP and CPI of Vietnam 1999-2011 ...................................................... 9
Figure 5: Response to exchange rate of foreign price index ............................................. 25
Figure 6: Response to exchange rate of import price index .............................................. 26
Figure 7: Response to exchange rate of consumer price index ......................................... 27
Figure 8: Response to foreign price index of import price index ...................................... 28
Figure 9: Response to foreign price index of consumer price index ................................. 29
Figure 10: Response to output gap of money supply ........................................................ 30
Figure 11: Response to output gap of consumer price index ............................................ 31
Figure 12: Response to money supply of consumer price index ....................................... 32
Figure 13: Response to import price index of money supply ............................................ 33
Figure 14: Response to import price index of consumer price index ................................ 34
Figure 15: Response to consumer price index of money supply ....................................... 35
Figure 16: VAR stable ....................................................................................................... 37
iii
List of tables
Table 1: VAR regression for import price index ............................................................... 21
Table 2: V AR regression for consumer price index .......................................................... 23
Table 3: Larange multiplier test ........................................................................................ 38
Table 4: ADF test of dlneerl ............................................................................................. 46
Table 5: ADF test of dlimp ................................................................................................ 46
Table 6: ADF test of dlcpi ................................................................................................. 47
Table 7: ADF test of dlm2 ................................................................................................. 47
Table 8: ADF test ofdlopi ................................................................................................. 47
Table 9: ADF test of dlpi ................................................................................................... 47
Table 10: Optimal lag length ............................................................................................. 48
Table 11: Granger causality test ........................................................................................ 48
Table 12: Vector Autoregression results ........................................................................... 50
Table 13: Impulse- Response Function ............................................................................ 57
Table 14: Variance decomposition .................................................................................... 69
•
iv
"\
Abbreviations
ADB
Asian Development Bank
ADF
Augmented Dickey-Fuller
ARIC
Asia Regional Integration Center
CPI
Consumer Price Index
ERPT
Exchange Rate Pass-Through
FPI
Foreign Price Index
GAP
Output Gap
GSO
General Statistics Office Of Vietnam
HP
Hodrick-Prescott Filter
IFS
International Financial Statistics
IMF
International Monetary Fund
IMP
Import Price Index
M2
Broad Money Supply
NEER
Nominal Effective Exchange Rate
OPI
Oil Price Index
REER
Real Effective Exchange Rate
USD
United States dollar
VAR
Vector Autoregression
VECM
Vector Error Correction Model
VND
Vietnam Dong
v
Acknowledgement
I would like to give my sincerest thanks to my supervisor, Dr. Dinh Cong Khai, who
has provided me valuable support throughout the process of this thesis. My study
would not have been possible without his patience, encouragement, insightful
comments and correction in all time of doing the research and writing the paper.
I am also deeply grateful to Dr. LeVan Chon for his dedicated, generous, enthusiasm
and thoughtful helps about Stata technique and Econometrics model. Thank to those
important guidance and useful advice, I have overcome many obstacles to complete
the research work.
Last but not least, I would like to give a big gratitude to my dear family and friends
who always encourage and stand beside me during my difficult moments. Their love
have inspired me a lot and lifted me up; hence my mere expression of thanks does not
suffice.
vi
Abstract
This paper estimates the exchange rate pass through to Vietnam's import prices and
domestic inflation with monthly data from January 1999 to October 2011. By applying
Vector
Auto
Regression
methods,
Impulse
Response
function,
Variance
Decomposition as well as combining with Granger causality, VAR stable, Lagrange
multiplier tests, the results show that exchange rate passed through almost fully to
import price index immediately and strongly at the first month, after that it fluctuates
to go up and down next months. The transmission from exchange rate to consumer
price index is smaller than to import price index but it penetrates with longer periods
around 10 months. Expanding money supply just explains for variance of inflation
2.48%. But it is not the surprising result, because the State Bank of Vietnam conducts
monetary policy timely and appropriately.
The results of variance decomposition,
however, reveal that the most important factor affecting on both import and consumer
prices is domestic demand pressure (output gap) with 32% and 14% respectively.
Therefore the policy recommendation should focus on controlling domestic demand
pressure as a priority to cut down high inflation. Government also can be confident
with easing monetary policy due to its small effect on inflation. Nonetheless, the
economy still needs the stable exchange rate policy in order to keep the trust on
domestic currency.
vii
Chapter 1: Introduction
1.1
Problem statement
Exchange rate is one of the most important factors in macro-economic management.
It affects supply and demand of foreign currencies, exports and imports, national
debts and reverses. When a domestic currency appreciates; the country's exports
become more expensive and its imports become cheaper in foreign markets and vice
versa for the depreciation of domestic currency. Appreciation will make balance of
trade lower, while depreciation will increase it.
Vietnam is following the export-led growth strategy; therefore export activities need
to receive a priority. In recent years, import activities, however, have increased
significantly; reducing net import is also a main concern now. Exchange rate
adjustment to depreciate domestic currency will be the useful tool to achieve those
two goals.
However, when the State Bank depreciates domestic currency; this will cause
pressure on inflation through three channels: the import prices increase will directly
affect on domestic prices, export activities are pushed up thus the supplies for
domestic market decrease and export prices at domestic market increase, and
aggregate demand for non-tradable goods increases also put a burden on inflation.
Furthermore, depreciation has a common aspect like easing monetary policy; it
means the economy will encounter with inflation risk. In order to balance this
effect, the State Bank needs to manipulate tightening monetary policy such as
increasing reserve ratio or capital adequacy ratio ... Definitely, there is a close
relationship between money supply and exchange rate; and government should
consider this connection to control inflation effectively.
1
1.2
Research questions
Overall, these raise questions about the degree of exchange rate pass-through
(ERPT) to import prices and then transfer to domestic inflation. Whether it is fully
or partially transferred to prices? When the State Bank of Vietnam depreciates
Dong, how does monetary policy response? Therefore, ERPT to import and
domestic consumer prices needs to be measured quantitatively to answer above
questions and then recommend implication for inflation control as well as monetary
policy.
We have a definition of ERPT as the percentage change in local currency import
prices of importing country reacting to one percent change in exchange rate
between trade partner countries (Goldberg and Knetter 1996).
It is important to understand ERPT for several reasons: first, in order to assess
monetary policy transmission on prices and forecast inflation, we need to know the
degree and timing of pass-through. Second, knowledge of the size and speed of
exchange rate pass-through into inflations is useful for the inflation targeting
adoption (Lian, 2006).
ERPT has been studied since 1980s by Dombursh (1987), Krugman (1986), Knetter
(1989), Taylor (2000), Toh and Ho (2001), Campa and Goldberg (2002), Otani,
Shiratsuka and Shirota (2005), Ghosh and Rajan (2009). In the early stage, most of
researchers focused on examining the ERPT in United States, Euro Area and
developed countries. They also had a debate on limited pass-through of exchange
rate across countries due to deviation from the law of one price. Recently, there
have been papers studying this subject in emerging markets, new small open
economies and developing countries. The transmission of exchange rate into
disaggregate industries has been focused as well.
2
1.3
Research objectives
There have been, however, a few studies regarding ERPT in Vietnam. It is
necessary to measure ERPT to know how it affects on the economy, how it
responses to government's policies. This study aims to estimate the degree and
speed of ERPT to distribution chain from import prices to domestic inflation
(consumer prices) in Vietnam. The study also examines the relationship between
inflation and monetary policy as well as other factors.
This research approaches the issue under Vector Auto Regression (VAR) method
combining with the analysis of Impulse Response Functions (IRF) and Cholesky
Variance Decomposition. After that I will check Granger causaliy, VAR stable and
do Larange multiplier test.
The null hypothesis will follow the hypothesis of many previous researches that the
exchange rate has no effect on import and domestic prices (in other words, the
ERPT is zero).
My research also has limitations. Due to data availability, I cannot obtain Producer
Price Index to establish the systematic distribution chain from Import Prices Index
to Producer Prices Index and finally to Consumer Price Index. I also ignore the
structural change when Vietnam joined WTO in 2007. This paper does not cover
ERPT in disaggregated industries, and this will leave for researches in future.
This paper includes 6 parts. After the introduction is part 2 with the overview of
Vietnam's exchange rate, import activities and inflation. Part 3 is literature review;
part 4 is research methodology, empirical framework and data description. The
empirical results are presented in part 5. Part 6 will conclude what I found in
estimation process and then will suggest policy recommendation.
3
--------------------------------------------------------------------
Chapter 2:
Overview of Vietnam's exchange rate, import activities and
inflation
2.1
Exchange rate arrangement in Vietnam
All we know that Vietnamese economy achieved many successes thanks to the
Renovation or "Doimoi" program in 1986. The economy step by step changed from
the centrally planned to the market-oriented system. With this comprehensive
reform package, the economy became more stable, open and free. During the
procedure, the financial system also was renovated towards market-oriented;
therefore the role of exchange rate was very important. According to Vo et al.
(2000) Vietnamese authorities has considered exchange rate control as a central
macroeconomic instrument for many targets: to ensure low inflation rate, to keep
financial system stable, to support exports, to control imports, and to push economic
growth.
Before 1989 there were three-tier exchange rate systems: trading, non-trading and
internal exchange rate. The trading exchange rate was used to do payments. Nontrading exchange rate was applied for inwards remittance and intangible goods
transactions such as tourism, education, health ... among socialist countries. The rest
one, internal exchange rate, served for business transactions between domestic
banks and domestic companies using foreign exchange; internal exchange rate also
was used when there had foreign aids coming from former Soviet Union. In 1989
exchange rate was unified by a sharp devaluation of the official rate from
VND225/USD to VND4500/USD and pegged to the United State Dollar during
1990s. Commercial banks can set their own exchange rate transaction within +/-5%
around the official rate. This depreciation brought a very positive impact on exports
and economic activities during the period of 1990-1991. However according to Vo
et al. (2000) this instrument has been used with reserve and passively. During the
period of 1993-1996, the nominal exchange rate stayed relatively stable; and as
inflation cut down, there appeared concerns about an overvalued Dong. It is
4
estimated that over this period the real exchange rate and the real effective exchange
rate appreciated about 20% and 15%, respectively. This appreciation was the reason
for current account deficits at that time. Although exports grew at a high rate they
still remained lower than imports, following very high current account deficits
(peaking in 1996 at 12% ofGDP).
With the pressure of current account deficits due to the reduction of foreign direct
investment as well as the East Asian financial crisis, export goods of Vietnam were
less competitive with other countries, therefore the State Bank of Vietnam allowed
the VND to devalue modestly and gradually similar to an adjustable fixed rate
regime. Vietnam also imposed stronger controls over imports and current account
transactions. As a result, trade and current account deficits decreased to about 4-5%
ofGDP in 1997-1998 (Vo et al., page xi).
From 2000-2003, the trend of exchange rate continued depreciating to support for
export-led growth strategy of government. However, in 2004-2010 the inflation rate
started to increase at faster rate than the rate of exchange rate depreciation, thus the
nominal effective exchange rate and real effective exchange rate started to separate.
Vietnam Dong, actually, turned to appreciate and the comparativeness of
Vietnamese goods was weaker than that of other foreign exporters. The State Bank
effort to devalue Dong in 2009 and 2010 to improve situation but the Vietnam Dong
still relatively appreciated against the currencies of Vietnam's major trading
partners.
5
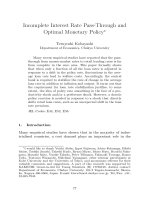
Figure 1: REER, NEER and Exchange rate 1995-2012
1.5
-REER
14
.... -NEER
1.3
.............................. ..
12
............................ .
-USDVND
. ............................................................................................................................................ .
0.9
0.8
0.7
0.6
05~~--~--~--~~--~--~--~~--~--~--~~--~--~--~~
1995
1996
1997
1998
1999
2000
2001
2002
2003
2004
2005
2006
2007
2008
2009
2010
2011
2012
Source: Le Hong Giang (2012)
During 2000-2011 when Vietnamese economy grew quickly and more integrated in
the world market. The economy of Vietnam will not only cope with unstable
domestic macro-economy but also suffer the global financial crisis. Therefore
exchange has continued the trend of depreciation through years.
According to Nguyen (2011) in the sub period 2008-2011, we have ever witnessed
the extreme fluctuation of Vietnam Dong vis-a-vis US dollar with many
depreciation adjustments together with the wide band. During this time the
economy of Vietnam was hit by the global financial crisis, the unpredictable
increase of gold prices as well as the big gap of official exchange rate and
speculation "black market" rate. By the end of 2009, VNDIUSD rate had increased
5.6% compared to that at the end of 2008 and in Feburary 2010, the State Bank of
Vietnam increased the official rate from 17,941 VND/USD to 18544 VNDIUSD,
3.3% devaluation with the band +/-3%. Next, Sate Bank declared an
6
unprecedentedly high rate of devaluation of VND 9.3% in early February 2011,
increasing the official rate to 20,693 VNDIUSD and narrowed the band to +/-1 %.
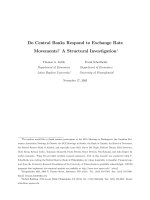
2.2
Overview of Vietnam's import activities
Vietnam has been suffering trade deficit for a long time and it still has had upward
trend. The proportion of import to GDP is increasing continuously from 50% in
2000, 84% in 2007, 93% in 2008, 79% in 2009, 88% in 2010 and 87% in 2011
(World Bank, 2012). We can see more about the proportion of disaggregated import
goods. The mean of production goods always takes the biggest proportion, hence it
will be a difficult mission of the State Bank to use exchange rate as a tool to push
export up and pull import down. It may have reverse effect when depreciation
currency, the import volume may not much reduce but the import value may
strongly increase and cause burden for inflation.
Figure 2: Import by commodity group ofVietnam 1995-2010
Imports by commodity group 1-995-2010
•
105.0
100.0
95.0
90.0
tw Non-monetary gold
111 Consumer goods
85.0
Ill Mean of production
80.0
75.0
Source: Author's calculation from GSO (2011)
7
.
2.3
Overview of Vietnam's inflation
In the period 1985-1989, the average CPI of Vietnam was 263%, the failure of the
so call "General Adjustment of Price, Wage and Money" resulting the persistent
hyper-inflation through years. In order to solve this problem, the State Bank of
Vietnam had to aggressively tighten monetary policy, raised monthly interest rate
and pegged VND strictly to USD. These policies included in the "Doi moi"
program and brought the big successes to Vietnam's economy. Inflation started to
fell significantly to below 20% in 1992 and close to 10% in 1995. (Nguyen and
Nguyen, 2010).
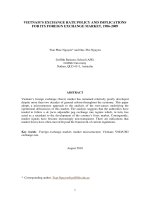
During the Asian financial crisis 1996-1998, the inflation rate was low and even
negative in 2000-2001 as reported -0.5%. The deflation in this period can be
explained by the remarkably decline of world prices as well as aggregate demand.
After that the recovery period came in 2002, the inflation was around 5% during
period 2002-2003. It started accelerating in 2004 with 9.5%, jumping to 12.7% in
2007 and hit the peak of23.1% in 2008. According to Nguyen and Nguyen (2010)
there have been many reasons explaining for this strong comeback of inflation such
as: the large increasing minimum wage, the rising of international commodity
prices, the inflexible monetary policy, the slow response of exchange rate
management or the joining of Vietnam to WTO at the of 2006.
In 2009, tightened monetary policy combined with the world economic depression,
inflation slowed down again. It came back to 11.8% in 2010 and 18.7% in 2011.
Figure 3: Inflation ofVietnam 1996-2010
8
CPI of Vietnam 1996-2011
Source: Author's calculation from World Bank (2012)
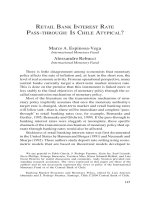
Now I combine data of exchange rate, here I use nominal effective exchange rate
(NEER), import price and consumer price in one graph so we can have a general
overview of them. Nominal effective exchange rate and inflation are rather
consistent; they have the same movement through time. Import price index,
however, likes an outlier in the graph with its own remarkably and continuously
increase year by year.
Figure 4: NEER, IMP and CPI ofVietnam 1999-2011
NEER, IMP and CPI of Vietnam
1999-2011
1999200020012002200320042005200620072008200920102011
Source: Author's calculation from Datastream
9
Chapter 3:
Literature review
Generally, there are two approaches on ERPT effect. Some economists such as
Dombursh (1987), Feinberg (1986) and Krugman (1986) analyzed ERPT basing on
microeconomics behavior of firms. Another approach is based on macro variables
to find the degree of ERPT effect on economy or group of economies, we can name
here Taylor (2000), McCarthy (2002), Campa and Goldberg (2002), Marazzi et al.
(2005).
There have been 3 methods to measure ERPT: linear, Vector Error Correction
Model (VECM) and VAR.
3.1
Linear approarch
First, using the linear econometrics model approach, Ihrig et al. (2006) conducted
the research for ERPT in G7 countries (the United States, the United Kingdom,
Japan, Italy, Germany, France, and Canada) for both import prices and consumer
prices with quarterly data from 1975Ql to 2004Q4. For each country authors
applied two versions of linear equation, one for estimating import prices and one for
consumer prices pass-though. The results showed that in the last 15 years, by 10
percent depreciation in the local currency, the import prices increased by 4 percent
and consumer prices increased by 2 percent on average. The research also stated
that ERPT declined for almost G-7 countries.
Another research of Campa and Goldberg (2005) analyzed ERPT to import prices
across countries and product categories in the Euro Area. The results showed that
ERPT to import prices was high, but not complete, and different across industries
and countries in the short run. The transmission in the long run was higher and
closed to one. The research tested for structural changes in pass-through rate when
the Euro currency was introduced; there was a decline trend for two-thirds of the
industries. However, the evidence was not statistically significant except
manufacturing industries. The authors predicted a wider decline in pass-through
may be happening but it was too early to conclude the structural change explaining
10
------.
for such declines. Because the research conducted in 2005, at that time, the history
of Euro currency was still very short; the small sample is one of disadvantage for
testing structural.
3.2
Vector Error Correction Model approach
Second, the VECM approach, there are many researchers choosing this method to
measure ERPT in case of cointegration in model. VECM has an advantage to
measure long-term ERPT based on stable cointegration among variables;
conditions, however, to apply this method is stronger than VAR approach. We can
name here many researchers applied VECM to measure EPRT such as Kim (1998),
Beiner & Bijsterbosch (2009), Dahl & Lo (2005), etc.
Beiner and Bijesterbosch (2009) applied the cointegrated VAR and impulse
response from the VECM for a research about ERPT in Central and Eastern
European member states. Their results showed that ERPTs for domestic consumer
prices were 0.6 and 0.5 for the cointegrated VAR and impulse response,
respectively. The paper found that ERPT in countries adopting fixed exchange rate
regime is higher than in countries adopting floated exchange rate regime.
There also has a combination between linear and VECM methods, Hanshilin (2006)
conducted his research for New Zealand, he recognized that pass-through elasticity
was incomplete in the short run and it varied across 8 disaggregated industries; in
the long run, the pass-through elasticity was higher than short run and half of the
sample of industries experienced complete exchange rate pass-through. Finally, he
concluded that the exchange rate pass-through rate was endogenous to inflation
performance at disaggregate level under New Zealand's economy.
3.3
Vector Autoregression approach
Final, the VAR approach is the most popular method which has been used by many
researchers all over the world. There are a wide range of papers concerning about
ERPT in Euro Area, emerging countries, Latin countries, comparing those together
11
or just ERPT of a specific country such as United States, United Kingdom,
Switzerland, China, etc.
Faruquee (2006) estimated ERPT in Euro Area with monthly data from 1990 to
2002. The proportion of exchange rate shock in his research included: import prices,
producer prices, consumer prices, wages and term of trade. Based on the estimation
of VAR, impulse response functions and the Cholesky decomposition he concluded
that the effect of ERPT to prices was small. Prices were very sticky in local
currency in response to depreciation in the euro exchange rate. Over time, the
degree of ERPT generally raise with the greatest response to import prices. The
wholesale producer prices had tendency to rise more than retail consumer prices.
Twelve to eighteen months after the shock, ERPT to export and import prices are
about one-half and one, respectively. Finally, the terms of trade for the euro area
declined in response to exchange rate depreciation.
Zori et al. (2007) measured ERPT in emerging markets based on 12 countries in
Latin America, Asia and Central and Eastern Europe. Their results confirmed that
ERPT declined across the pricing chain. The analysis also demonstrated that ERPT
was higher in emerging than in developed countries. For emerging economies with
one-digit level of inflation, ERPT was low and similar levels in the developed
economies. Doing more research, the paper found that there was a positive
correlation between the degree of the ERPT and inflation. Finally, the research
pointed that although level of inflation was controlled, the relationship between
import openness and ERPT is weaker than that between inflation and ERPT.
One study of Marazzi et al. (2005) focused on ERPT in US; the study pointed out
that the ERPT to import prices in US declined from 0.5 in 1980s to somewhere
neighborhood of 0.2 and it explained for this decline by "the composition of imports
has shifted toward goods whose prices are less sensitive to exchange rate
movements" (p. 3) together with "China's increasing presence in the U.S. market"
(p. 4).
12
Jin (20 10), with ERPT in China study, explored that nominal effective exchange
rate appreciated 1% will decline 0.132% of domestic consumer prices and 0.495%
of producer prices, respectively. Jin also illustrated that exchange rate regime
affected on inflation, particularly; CPI pass through in fix exchange rate regime was
higher than in flexible exchange rate regime. Combining above results, he suggested
Chinese government should pursue more
flexible
exchange rate policy.
Furthermore, the research also examined the aspect of price control, basket and
weight of Chinese price indices, distribution cost, non-tradable share and imported
input in order to find the reason for low EPRT to consumer price inflation.
Vo (2009) in his study about ERPT to inflation in Vietnam figured out the degree of
ERPT to inflation in Vietnam is 0.61. He also compared with ERPT level of other
countries such as Indonesia (0.53), Korea (1.59), Thailand (1.27), Singapore (0.59),
23 OECD countries (0.46) and 10 euro area economies (0.47) and concluded that
ERPT to inflation in Vietnam is moderate. In his study, however, he did not count
exporters' cost (foreign price index) in the model. My study will compute this
variable and expand the sample size from M1:1999 to M10:2011 comparing to
M1:2001 to M2:2007. The nominal exchange rate and import prices in his study are
weighted of 9 main trading countries, but in my paper I generate these variables
from weighted trade of 20 countries. I also apply more V AR stable and Larange
multiplier tests for regression model. Therefore the result is rather different with
Vo' s result.
13
•
Chapter 4:
Research methodology, empirical framework and data
description
4.1
Research methodology
The purpose of this study is to measure ERPT to import prices then impulse to
domestic prices; therefore we need to establish the relationship between exchange
rate and import prices first. The theoretical framework which we base to conduct
empirical framework is from purchasing power parity (PPP) theory.
Under perfect competition market with no trade barriers, the PPP states that the
home price of goods in home currency should be equal to the foreign price of goods
in foreign currency multiplied by the exchange rate between those two currencies.
We have an equation as follow:
Pf:l = EPf
(1)
Where h denotes the home country, f is foreign country. Pf:l is the import price
measured in home country currency. Pf is the export price measured in foreign
currency, E is the nominal exchange rate between home currency vis-a-vis foreign
currency (home currency/foreign currency).
According to Hooper and Man ( 1989), Goldberg and Koetter ( 1997) and Campa and
Goldberg (2002), the exporting firms set the prices depended on the markup
(Markup x) on marginal cost of production of foreign exporting firms (CJ).
Pf
= Markupx Cf
(2)
Hooper and Man ( 1989) argue that an exporting firms set up their markup basing on
the market demand pressure in both foreign and home markets ( Y ), and competitive
pressure in the home country market. On the other hand, the competitive pressure in
the importing market is measured by the profit margin, i.e. price over production
costs. Therefore, the markup is presented as follows (Vo, 2009):
14
Markupx
= [:;;]" yP
(3)
Where [ Phx]a represents competitive pressure in the home market and yP represents
ECf
demand pressure in both home and foreign market and 0
~
> 0.
From (1 ), (2) and (3) we have the import price as follows:
(4)
P,;" = E [:;;]" yPCf
Simplify equation (4) we get:
(5)
We take logarithm equation (5):
lnPJ:"
= (1- a)lnE + (1 -
a)lnCf
+ alnPh + {JlnY
(6)
We can rewrite equation (6) as simple linear equation by generating variables as
follows:
pr = (1- a)e + (1- a)c[ + aph + {Jy
(7)
Equation (7) shows that import price is affected by the exchange rate e, marginal
cost of production of foreign firms c[ , the home country price level Ph and market
demand for both home and foreign country y.
From equation (7) we can know the elasticity of import price with respect to the
change of exchange rate (ERPT) of home country is (1- a). If a = 0, we have
complete pass-through effects. If a
=
1, we have zero pass-through and 0 < a < 1,
we have limited or incomplete pass-through.
15
We will arrange equation (7) to obtain a, and then we can analyze the movement of
;
ERPT. Because ERPT is measured by coefficient (1 - a), ERPT has an inverse
relationship with a.
p~ -
e - c[ - {Jy
(8)
a=--------~----~
Ph-
e- c[
From equation (8) we have the movement of ERPT as follows:
If demand in both home and foreign markets (y) increase, a decreases and hence
ERPT increases and vice versa for case of a decreases.
If Ph increases, raising inflation in the home market, a decreases and ERPT
increases and vice versa;
If p~ increases, a increases and ERPT decreases and vice versa;
If home currency depreciates (ore increases), a will decrease and ERPT increases
and vice versa.
If c[ increases,
4.2
a will increase leading to the decrease of ERPT and vice versa.
Empirical framework
This study will apply the Vector Auto Regression (V AR) approach to measure the
level of ERPT. According to Faruquee (2006), using the V AR approach to examine
exchange rate pass-through has several advantages compared with single-equation
methods. First, the single equation method estimates pass-through into a single price
import or consumer prices separately. It does not further distinguish between the
types of underlying exchange rate shocks that may be arriving. By investigating
exchange rate pass-through into a set of prices along the pricing chain, the V AR
analysis characterizes not only absolute but relative pass-through in upstream and
downstream prices (p.64, 65). Second, after running V AR model, we can apply
Cholesky variance decomposition to identify specific structural shocks affecting the
16