PRODUCTION OF MICROBIAL BIOMASS AND BEER PRODUCTION
Bạn đang xem bản rút gọn của tài liệu. Xem và tải ngay bản đầy đủ của tài liệu tại đây (808.31 KB, 12 trang )
Laboratory experiment title: PRODUCTION OF MICROBIAL BIOMASS AND BEER
PRODUCTION
Date due: 23/11/2015
Lab Report
I.
Introduction
Brewing yeast Saccharmyces cerevisiae :
Morphology: it is a globular-shaped, yellow-green
Physiology:
Energy and Carbon Source Requirements
Glucose is considered the preferred carbon source of yeast, because the presence of this hexose
inhibits the utilization of other carbon sources. Yeast exercises this preference in part by repressing
the transcription of genes required for the utilization of the alternative carbon sources
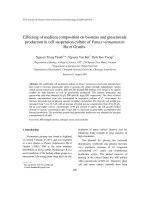
Cell Composition
1
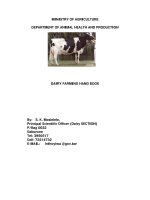
Nutritional Requirements
2
©2012 Phibro Animal Health Corporation
Growth Factors
Effect of Temperature:
the temperature effect on an enzyme-catalysed reaction, the rate of reaction is increased when it’s
maximum in a specific temperature. This is called optimum temperature. The optimum temperature
of Saccharomyces cerevisiae is 30oC- 32oC [1].
Effect of pH
When pH values get an optimum pH value , the enzyme activity is the highest. The optimum pH of
Saccharomyces cerevisiae is 5.5. Acids and alkalis cause denaturation of the structure of the enzyme
, its breaking mainly hydrogen and ionic bonds lead to the substrate can't fit the active site.
Moreover, the charges of the amino acids within the active site are influented by pH changes, so the
enzyme can not to form an enzyme-substrate complex. If the ph is to high or too low compare with
3
the optimum pH, the enzymatic activity hence the rate is reduced considerably.[2]
Metabolism: Saccharmuces cerevisiae ferment sugars via the glycolytic pathway to pyruvate.
Glucose → 2 pyruvate → ethanol + CO2
( no oxygen)
S. cerevisiae has an intact C.A.C and a functional electron transport system to produce ATP,
however,when the enviroment lack of oxygen, they can readily grow and respire under aerobic
conditions. Glucose is the main source of carbon and energy, glucose concentrations are high
enough, lead to gene expression of enzymes used in respiration are repressed and fermentation takes
over respiration .
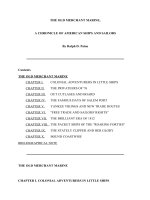
Beer fermentation :
Mechanism:
Microbiology and Technology of Fermented Foods p. 309
4
Before yeast is added, the wort is first aerated with sterile air. Even though the beer fermentation
eventually becomes an anaerobic process because oxygen is necessary element for biosynthesis of
cell membrane lipids which are essential for growth of yeast in wort.
Influence of technology factors on the fermentation performance and beer quality
II.
III.
Objective
Study fermentation condition effect on the quality of green beer
Meterial and method
A.
Meterial
Medium composition
How was they use
Germinated malt
200g
Distilled water
Microorganism
1000g
The malt -source of the starch
(becomes the sugar required in
fermentation).
Use for extraction
Saccharomuces
1*10^7
cerevisiae
cell/ml
B.
Method
Malt medium preparation
Combine 200g germinated malt and 500ml water in one blender and then grind
the mixed well. 500ml water is poured before they are filtered into a 1000 ml
5
beaker (3 times). The beaker is put in water balt at 52oC for 20 min, then 63oC
for 30 min, next its put at 73oC , and at last 100o
C for 15 min.
Testing the sucrose concentration and pH value
To enough duger for yeast to grow , the suger content of aquaous solution is
around 7 0 Brix (with one degree Brix is one gram surcrose in 100 gram of
solution ).
pH is set value at least 4.5
Calculation of spore suspension
Using a haemocytometer to count cell, the purpose in order to reach 1*10^7
(cell/ml).
Special pieces of equipment and the general theory of the analyses or assays
used
Haemocytometer is a specialized microscope slide and has an etched glass
chamber which use to count cell concentration.It has a thick base and uses a
special coverslip which is thick enough to stay flat under the pull of surface
tension from the solution in the counting chamber.Under microscope,
observation through haemocytometer can see the central area of the grid is triple
ruled line.
Count a high density cell population
Number of cell = 225 cell at ten time dilution.
Cell concerntration per ml = 225/5 *25*10^4 *10^2=1.13*10^9(cell/ml)
Spore suspension C Counted (C) * Volume of spore suspension=Require (C) *
volume of media
1.13*10^9(cell /ml)*V1(ml)=1*107(cell/ml)*200(ml)=>V1=1.78 ml
Inoculate yeast
3 erlens are prepared contain 200ml solution malt then inoculate yeast cell by
adding 1.78 ml solution of spore suspension .
Fermentation
Sample 1a
Sample 1b
Sample 2a Sample 2b
o
Temperature (t C)
RT
RT
RT
RT
Cover at the top of
no
No
yes
yes
the flask
Inocubation time
2 week
2 week
2 week
2 week
RT room temperture
6
Determination of reducing suger
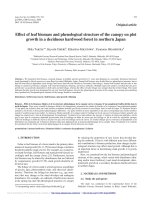
1. The standard curve
Using the standard curve to find equation to fine suger concentration.
Preparing 6 tubes contain :
Tube number
1
2
3
4
5
6
Standard glucose 0.02% (ml)
0
1
2
3
4
5
Water
5
4
3
2
1
0
The concentration in each tube 0
20 40 60 80 100
Pipette 1ml of solution in new 6 tubes (*)from old 6 tubes .
Spectrophotometry is used to measure how much a chemical
substance absorbs light by measuring the intensity of light as a beam of
light passes through sample solution.
The basic principle is that each compound absorbs or transmits light
over a certain range of wavelength.
2. Sample dilution
Dilute the beer culture from 4 flasks, each flask dilute to 10, 100 and
1000 times. Preparing 2 tubes for each diferentt concentration and
pipette 1ml from each concentration in tubes,
Totally, we have
Each flask -3 tube with 3 different concentrations-2 tube contain 1 ml
from each concentraion.
So, 4 flask will be prepared 24 tubes with each tubes contain 1ml
solution (**).
For 30 (* and**)tubes :
Add 1ml DNS solution.
Put the all tube in water bath at 100 oC for 5mins .
Let them cool at room temperature.
Add 10 ml distilled water and mix well.
Use spectrophotometer absorbance at 540 nm.
IV.
Results and discussion
Group 1
OD
Reducing
suger
concentration
(ppm)
1
0
0
2
0.109
40
3
0.229
80
4
0.369
120
5
0.507
160
6
0.648
200
7
OD
0.7
y = 0.0033x - 0.0164
R² = 0.9976
0.6
0.5
OD
0.4
OD
0.3
Linear (OD)
0.2
0.1
0
0
-0.1
50
100
150
200
250
Reducing suger concentration (ppm)
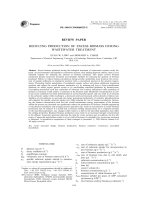
The x-axis stand for reducing suger concentration and y-axis stand for ∆OD. After all, the
equation of ∆OD line
y = 0,0033x - 0,0164
R² = 0,9976
Using the equation to calculate reducing suger concentration of 24 diluted tubes
The table 1.1 show the number of reducing suger concentration and OD
OD
OD
average
Reducing
suger
concentration
A1
A1
A1
A1
A1
A1
A2
A2
A2
A2
A2
A2
10-1
10-1
10-2
10-2
10-3
10-3
10-1
10-1
10-2
10-2
10-3
10-3
0.386 0.475 0.056 0.035 0.020 0.034 0.181 0.254 0.026 0.034 0.022 0.021
0.431
0.046
0.027
0.218
0.030
0.021
135.58
18.91
13.15
71.03
14.06
11.33
8
(ppm=mg/l)
OD
OD
average
Reducing
suger
concentration
(ppm=mg/l)
B1
B1
B1
B1
B1
B1
B2
B2
B2
B2
B2
B2
-1
-1
-2
-2
-3
-3
-1
-1
-2
-2
-3
10
10
10
10
10
10
10
10
10
10
10
10-3
0.365 0.377 0.030 0.033 0.021 0.028 0.322 0.324 0.027 0.032 0.020 0.021
0.371
0.032
0.025
0.323
0.030
0.020
117.40
14.67
12.55
102.85
14.06
11.03
A: aerobic
B: anaerobic
The table 1.2 show reducing suger concentration (g/l)
Reducing suger
concentration (g/l)
Aerobic 10-1
Aerobic 10-2
Aerobic 10-3
Anaerobic 10-1
Anaerobic 10-2
Anaerobic 10-3
103.31× 10⁻³
16.49× 10⁻³
12.24× 10⁻³
110.125× 10⁻³
14.37× 10⁻³
11.80× 10⁻³
The table 2.0 show the yeast cell concentration in beer production.
A1
A2
B1
B2
Yeast cells at
41
13
5
4
diluted
at 10 times
Yeast cell
2.05 × 10⁷
6.5 × 10⁶
2.5 × 10⁶
2 × 10⁶
(cell / ml)
Average of
1.35 × 10⁷
2.25 × 10⁶
yeast cell
(cell / ml)
Comparing between aerobic and anaerobic
The beer culture flasks without cover at the top have less ethanol than ones covered
and the flask without have more cells than the flask cover at the top.
9
Before inoculate yeast celL
The sucrose concentration (o Brix) =7.67
pH= 5.94
After inoculate yeast cell
The table 3.0 show the sucrose concentration after yeast were inoculated
The sucrose
concentration (o Brix)
A1
A2
B1
B1
3.09
3.32
3.18
3.69
Average of sucrose
concentration (o Brix)
3.21
3.44
The sucrose concentration (o Brix) before fermentation is higher than after fermentation.
Data og group 2
The table 3.1 show the sucrose concentration after yeast were inoculated
Sucrose concentration (oBrix) Aerobic
Anaerobic
Group 1
2.92
2.21
Group 2
3.24
2.87
Group 3
3.13
3.04
Group 4
2.89
2.65
Average
3.05
2.70
The table 1.3 show the number of reducing suger concentration and OD
OD
ODaverage
Reducing sugar concentration (ppm)
Aerobic
1
0.228
0.224
0.226
39.8
Aerobic
2
0.204
0.194
0.200
35.5
Anaerobic 1
Anaerobic 2
0.261
0.267
0.264
46.2
0.283
0.265
0.274
47.8
The table 2.1 show The sucrose concentration of group 2
A1
A2
o
The sucrose concentration ( Brix)
8
9
B1
15
B1
18
10
The table compare aerobic and anaerobic flasks.
Aerobic
Anaerobic
Present of alcohol
Small number of smell
Large number of smell
Present of buble
Yes, CO2 is created
How Oxygen Affects Fermentation
Oxygen affect on the amount of unsaturated fatty acids present in the fermentation.
They was decreased production of esters, the flavour compounds.
Compare the shape and concentration of yeast cell ( cells/ml) before and after the
fermentation.
Shape of cell did not change, concentration of cell increase from
cells
1 × 10⁷
to 1.35 × 10⁷ in aerobic enviroment and decease to 2.25 × 10⁶ in anaerobic
ml
Because the yeast growth well in aerobic .
The culture does not need to supply oxygen because it could affect on the beer quality.
The optimization of temperature is nescessary to the control of the production of
flavour-active compouns as esters and higher alcohols. An increase in temperature
leads to a shorter fermentation time.In lager beers it sees an increase in higher
alcohols. Ethyl hexanoate is produced at an increased rate during higher temperature
fermentations, however acetate esters is decreased in amount. For ale strains,its
increased only phenyl ethyl acetate production. Most aroma-active compounds are
volatile, and the increase of temperature will evaporate them, removing them
effectively from the beer.
11
V.
VI.
Conclusion
This experiment will look at the mechanism of yeast, and how it converts the sugars
into ethanol. The concentration of reducing suger and the number of yeast will show
the best optimal condition for beer performing and that lead to the apllication in
industry , help reduce cost and achieve the best quality .
References
[1] ,[2] : />
Hutkins, R. W. (2006). Beer Fermentation. In R. W. Hutkins, Microbiology and Technology
of Fermented Foods (pp. 301- 349). Oxford: Blackwell Publishing Ltd.
J. Richard Dickinson, Michael Schweizer , The Metabolism and Molecular Physiology of
Saccharomyces cerevisiae .Second edition published 2004 by Taylor & Francis Ltd 11 New
Fetter Lane, London EC4P 4EE
12