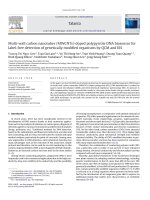
Detection of vibrio cholerae o1 by using cerium oxide nanowires based immunosensor with different antibody immobilization methods
Bạn đang xem bản rút gọn của tài liệu. Xem và tải ngay bản đầy đủ của tài liệu tại đây (2.06 MB, 11 trang )
Journal of the Korean Physical Society, Vol. 68, No. 10, May 2016, pp. 1235∼1245
Detection of Vibrio cholerae O1 by Using Cerium Oxide Nanowires - Based
Immunosensor with Different Antibody Immobilization Methods
Phuong Dinh Tam,∗ Nguyen Luong Hoang, Hoang Lan and Pham Hung Vuong
Advanced Institute for Science and Technology (AIST),
Hanoi University of Science and Technology (HUST), No. 1 Dai Co Viet St., Hanoi, Viet Nam
Ta Thi Nhat Anh
Vinhphuc Technology Economic Colleges, No. 10 Hung Vuong St., Vinhphuc, Viet Nam
Tran Quang Huy and Nguyen Thanh Thuy
National Institute of Hygiene and Epidemiology (NIHE), No.1 Yersin St., Hanoi, Viet Nam
(Received 18 March 2016, in final form 18 April 2016)
In this work, we evaluated the effects of different antibody immobilization strategies on the
response of a CeO2 -nanowires (NWs)-based immunosensor for V ibrio cholerae O1 detection. Accordingly, the changes in the electron-transfer resistance (Ret ) from before to after cells bind to an
antibody-modified electrode prepared by using three different methods of antibody immobilization
were determined. The values were 16.2%, 8.3%, and 6.65% for the method that utilized protein A,
antibodies activated by 1-ethyl-3-(3-dimethylaminopropyl) carbodiimide hydrochloride (EDC)/Nhydroxysuccinimide (NHS), and absorption, respectively. Cyclic voltammetry confirmed that the
change in the current was highest for the immunosensors prepared using protein A (11%), followed
by those prepared with EDC/NHS-activated antibodies (9%), and finally, those prepared through
absorption (7.5%). The order of the antibody immobilization strategies in terms of resulting immunosensor detection limit and sensitivity was as follows order: absorption (3.2 × 10³ CFU/mL;
45.1 Ω/CFU·mL−1 ) < EDC/NHS-activated antibody (1.0 × 10³ CFU/mL; 50.6 Ω/CFU·mL−1 ) <
protein A (1.0 × 10² CFU/mL; 65.8 Ω/CFU·mL−1 ). Thus, we confirmed that the protein A mediated method showed significantly high cell binding efficiencies compared to the random immobilization method.
PACS numbers: 81.05.Cy, 82.45.Tv, 81.16.-c
Keywords: Antibody, Protein A, Immunosensor, Nanowire, CeO2
DOI: 10.3938/jkps.68.1235
I. INTRODUCTION
Immunosensors are currently attracting much attention because of their promising applications, particularly,
in clinical diagnostics [1–5], the food industry [6–8], and
environmental monitoring [9–12]. Many kinds of immunosensors, such as electrochemical, optical, and mechanical immunosensors, are used for various purposes.
However, lectures report that immunosensor performance is significantly affected by antibody immobilization approaches. Therefore, the selectivity of the immobilization methods used to improve immunosensor performance is very important. To date, several techniques
for antibody immobilization have been reported, including physicochemical absorption [13], covalent attachment
∗ E-mail: , phuongdinhtam@gmail.
com; Fax: +84-4-3623-0293
[14, 15] or Langmuir Blodgett method [16], and other
methods. The physicochemical adsorption strategy relies
on weak binding, such as van der Waals, hydrophobic, or
electrostatic interactions, to attach antibody molecules.
For example, Buijs and coworkers [13] studied the effect
of adsorption on antigen binding by IgG and its F(ab )2
fragments. The group performed antibody absorption
on hydrophilic silica and hydrophobic methylated silica surfaces. The electrostatic interactions were studied
by varying pH values and ionic strength. Experimental results showed that the orientation of the adsorbed
antibodies could be strongly influenced by electrostatic
interactions. Similar results were attained by Chen et
al. [17]. An ultrasensitive microcantilever immunosensor based on antibody chemical adsorption was developed by Sungkanak et al. [18]. In the study, linkers, including 1-ethyl-3-(3-dimethylaminopropyl) carbodiimide
hydrochloride (EDC) and sulfo-N-hydroxysuccinimide
-1235-
-1236-
Journal of the Korean Physical Society, Vol. 68, No. 10, May 2016
(sulfo-NHS), were used to activate carboxylic groups to
form peptide bonds with the primary amines of the antibodies. Monoclonal antibodies in the PBS solution were
spread onto the sensor surface, and were achieved a detection limit of 1.0 × 10³ CFU/mL and a mass sensitivity of 146.5 pg/Hz. As demonstrated, the adsorption
approach was used to attach antibodies onto the transducer surface. This method is simple, easy to perform,
and cost effective.
However, fabricating high-performance immunosensors is difficult because of the random antibody orientations achieved from this method, leading to a low density
of antigen-binding sites [19]. To address this issue, sensor performance was improved by using the covalent attachment methods developed by various research groups
[14, 15, 20]. These techniques rely on linker materials
to fasten antibodies onto electrode surfaces. Wang et
al. [20] reported an orientation-controlled immobilization method based on protein A for immunosensor design. Their study showed the good binding ability of protein A with gold nanoparticles. The inclusion of amineterminated plasma polymerization also led to enhanced
antibody binding capabilities, which improved sensor
performance. In another study, Franco and coworkers
[21] implemented an oriented immobilization of antibodies on gold surfaces by using protein A to fabricate a
surface plasmon resonance immunosensor. The protein
A-gold binding domain consist of a gold-binding peptide coupled with the immunoglobulin-binding domains
of staphylococcal protein A. This coupling facilitated the
oriented immobilization of antibodies. The fabricated
immunosensor achieved a detection limit of 90 ng/mL,
with an interchip variability of lower than 7%.
Many other studies used different linkers, such
as (3-glycidyloxypropyl)trimethoxysilane (GPS) [14],
graphene paper [15], carboxylmethyl dextran [22], and
semiconductor metal oxide [23–30], to immobilize antibodies on electrode surfaces.
To date, studies comparing antibody immobilization techniques have been conducted. Babacan et al.
[31] evaluated different antibody immobilization methods for piezoelectric immunosensor application. In
the study, two linkers (protein A and polyethylenimine/glutaraldehyde, PEI/GA) were assessed. In the
PEI/GA method, the antibodies were immobilized in
random orientations through the surface aldehyde group
of GA on a PEI-coated quartz crystal. Otherwise,
antibodies were bound to protein A, which was directly immobilized on the quartz crystal’s surface by
van der Waals interactions. The group showed that
antibody immobilization onto piezoelectric quartz crystals through protein A showed better results than immobilization through PEI/GA. Meanwhile, Danczyk et
al. [32] investigated three different antibody immobilization methods: adsorption, aminosilance, and Ngamma-maleimidobutyryloxy-succinimide ester (GMBS)
linkers. They demonstrated that the presence of protein A improved the antigen capture ability of the ad-
sorbed antibodies and the GMBS surface. However,
protein A did not increase the antigenic capture of the
aminophase surfaces. Additionally, the aminosilance surface exhibited the highest level of nonspecific binding.
Vashist et al. [33] investigated antibody immobilization by using EDC, EDC/N-hydroxysuccinimide (NHS),
and EDC/sulfo-NHS for immunosensor applications. At
pH 7.4, EDC crosslinks antibodies to the 3-aminopropyl
triethoxy-silane (APTS)-modified surface of SPR more
efficiently than EDC/NHS and EDC/sulfo-NHS. Recently, Lee and co-workers [34] compared two antibodyoriented immobilization methods that adopted thiolconjugated secondary antibodies and thiolated-protein
A/G linkers. The secondary antibody-mediated attachment method provided better antigen-binding efficiency
compared with the other strategy.
As discussed, studies of various antibody immobilization approaches have been extensively reported in the
literature. However, no consensus has been achieved on
recommendations for antibody attachment approaches.
Furthermore, the use of antibody immobilization to improve immunosensor performance continues to challenge
the immunosensor fabrication process. Therefore, a suitable immobilization method for each immunosensor application needs to be found. In this paper, we report
three different approaches for immobilizing antibodies
on the surface of electrode modified by using CeO2
nanowires to detect V ibrio cholerae O1. These methods include adsorption, the use of EDC/NHS-activated
antibodies, and the use of protein A. Our main aim was
to evaluate the effects of the different antibody immobilization strategies on the response of the CeO2 NWsbased immunosensor. The results of this study would
provide insight into the best immobilization method for
the design of CeO2 NWs-based immunosensors, as well
as immunosensors in general.
II. EXPERIMENTS
CeO(NO3 )3 ·6H2 O, H2 O2 , toluene, and antibodies
against V . cholerae O1 (anti-V . cholerae O1) were
provided by Invitrogen Co. Phosphate buffered saline
PBS (0.01 M, pH 7.4), EDC, NHS, bovine serum albumin (BSA), 98% H2 SO4 , KCr2 O7 , protein A, and were
purchased from Sigma-Aldrich. Potassium ferrocyanide
and potassium derricyanide were acquired from Beijing
Chemical Reagent (China). All solutions were prepared
with de-ionized (DI) water (18.2 MΩ·cm).
In this work, a microelectrode was utilized as a sensor for electrochemical measurements. Briefly, the sensor
was fabricated by sputtering 10 nm Cr and 200 nm Pt
onto a ∼150 nm thick silicon-dioxide (SiO2 ) layer thermally grown on top of a silicon wafer. The sensor surface was initially cleaned with KCr2 O7 in 98% H2 SO4 ,
followed by cyclic voltammograms sweep from −1 V to
+2.1 V, at a scan rate of 25 mV/s in 0.5 M H2 SO4
Detection of Vibrio cholerae O1 by Using Cerium Oxide Nanowires · · · – Phuong Dinh Tam et al.
Fig. 1. (Color online) (a) schematic of an electrode structure with a photograph of the electrodes, (b) fingers of the
electrode image with higher magnification, (c) the FE-SEM
image of CeO2 nanowires deposited on the electrode, and (d)
the FE-SEM image of CeO2 nanowires with higher magnification.
to activate the sensor’s surface. CeO2 NWs were prepared by a reaction with 1% (v/v) APTS solution in
ethanol for 36 h at room temperature. Afterward, a mixture of APTS/CeO2 NWs was centrifuged for 60 min at
3500 rpm and washed thrice with ethanol. Subsequently,
APTS/CeO2 NWs were sprayed onto the activated electrode’s surface (Fig. 1).
The APTS/CeO2 -modified electrode was incubated in
PBS solution (PBS 0.01 M, pH 7.4) containing 12 μg/mL
of anti-V . cholerae O1 and then stored at 4 ◦ C overnight.
Continuously, the electrode’s surface was rinsed with
double-distilled water and dried under nitrogen flow. To
block nonspecific sites, we immersed the immunosensor
in PBS solution containing 1% BSA for 30 min, washed
it with DI water, and dried under nitrogen flow. Figure 2(a) shows a schematic illustration of antibody immobilization on the surface of the CeO2 NWs-deposited
electrode by absorption.
For the EDC/NHS - activated antibody method, first
12 μg/mL of anti-V . cholerae O1 was incubated in 50 μL
of solution containing 5 mg/mL of EDC and 10 mg/mL
of NHS in 0.01 M PBS buffer for 20 min at pH 7.4 and
room temperature. The EDC binds carboxyl groups to
primary amines, forming an O-acylisourea intermediate.
This product is unstable in aqueous solutions. Thus,
NHS is required for stabilization by converting the intermediate to an amine-reactive NHS ester [33,35]. Second,
the electrode modified with APTS/CeO2 NWs was immersed in a solution of EDC/NHS-activated antibodies
for 24 h at room temperature. In this step, the activated
antibodies crosslinked with the free amino groups on the
surface of the electrode modified with APTS/CeO2 NWs.
Afterward, the immunosensor was rinsed with doubledistilled water and dried under nitrogen flow. Finally,
-1237-
1% BSA was added to the modified nanowire’s surface
to block nonspecific sites as previously described. The
immunosensor was rinsed with DI water and dried under
nitrogen flow. When not in use, the immunosensors were
stored at 4 ◦ C in a refrigerator. Figure 2(b) displays a
schematic illustration of the antibody immobilization on
the surface of the APTS/CeO2 NWs-deposited electrode
using EDC/NHS-activated antibodies.
Similarly, protein A was activated with EDC/NHS
as mentioned in Ref. [22]. Then, an electrode modified with APTS/CeO2 NWs was dipped in a solution of
EDC/NHS-activated protein A for 24 h at room temperature. Subsequently, 50 μL of anti-V . cholerae O1
(12 μg/mL) was dropped on the electrode modified with
protein A/APTS/CeO2 NWs. Finally, the electrode was
treated with 1% BSA for 30 min to prevent nonspecific
binding, as previously described. In each step, the electrode was rinsed with double-distilled water and dried
under nitrogen flow. Figure 2(c) shows a schematic of the
antibody immobilization on the surface of APTS/CeO2
NWs-deposited electrode using protein A.
For the electrochemical impedance spectroscopy (EIS)
measurements, an IM6-impedance analyzer with IM6THALES software was used to detect the cell concentrations of V . cholerae O1. In this work, the electrode
modified with anti-V . cholerae O1 was immersed in a
measuring cell that was filled with 5 mL of 0.01 M PBS
solution (pH 7.4) containing a defined cell concentration
of V . cholerae O1 for 90 min at room temperature to
form an antibody-antigen complexes. The immunosensor was rinsed with buffer solution to remove the nonspecifically adsorbed cells. The immunosensor responses
were monitored by dipping the modified sensor in 2 mL of
0.01 M PBS solution containing 20 mM [Fe(CN)6 ]3−/4−
as an indicator probe. The detected immunosensor was
connected to the test and sense probes, and the Pt electrode was connected to the counter electrode on the IM6impedance analyzer. An Ag/AgCl electrode was used
as a reference electrode. All tests were conducted in an
open circuit. The tested frequency range was 1 Hz to 100
kHz, with an amplitude of ±5 mV. The Nyquist plots
were recorded. The differences in the electron-transfer
resistance (Ret ) were considered as the signal produced
by the interaction between the antibodies and the cells.
For cyclic voltammetry (C-V) measurements, an IM6impedance analyzer with IM6-THALES software was
used under the C-V program. The electrode modified
with anti-V . cholerae O1 was immersed in a measuring
cell that was filled with 5 mL of 0.01 M PBS solution (pH
7.4) containing a defined concentration of V . cholerae O1
cells for 90 min at room temperature to form antibodyantigen complexes. The immunosensor was rinsed with
buffer solution to remove nonspecifically adsorbed cells.
Immunosensor responses were monitored by dipping the
modified sensor in 2 mL of 0.01 M PBS solution containing 20 mM [Fe(CN)6 ]3−/4− as an indicator probe.
The detected immunosensor was connected to the test
and sense probes, and the Pt electrode was connected to
-1238-
Journal of the Korean Physical Society, Vol. 68, No. 10, May 2016
Fig. 2. (Color online) Schematic illustration of antibody immobilization on the surface of a CeO2 - nanowire - modified
electrode: (a) antibody absorption immobilization, (b) EDC/NHS-activated antibody method and (c) antibody immobilization
via protein A.
the counter electrode on the IM6-impedance analyzer.
An Ag/AgCl electrode was used as a reference electrode.
The potential was scanned from −0.2 V to 0.67 V at
a scan rate of 100 mV·s−1 . The differences in the current peak were regarded as the signal produced by the
interaction between the antibodies and the cells.
III. RESULTS
In this work, Fourier transforms infrared (FTIR)
spectroscopy was used to verify the existence of CeO2
nanowires and anti-V . cholerae O1 on the sensor’s surface. Figure 3 shows the FTIR spectra of (a) the
Detection of Vibrio cholerae O1 by Using Cerium Oxide Nanowires · · · – Phuong Dinh Tam et al.
-1239-
Fig. 4. (Color online) Fluorescence images of antibody immobilized electrode: (a) ATPS/CeO2 NWSs modified electrode, (b) absorption, (c) EDC/NHS - activated antibody,
and (d) protein A-mediated immobilization methods.
Fig. 3. (Color online) FTIR spectra of antibody immobilized electrode’s surface: (a) ATPS/CeO2 NWSs modified
electrode, (b) absorption, (c) EDC/NHS - activated antibody,
and (d) protein A-mediated immobilization method.
ATPS/CeO2 nanowires, (b) immobilization via absorption antibody, (c) immobilization via EDC/NHS activated antibody and (d) protein A-mediated immobilization. The FTIR spectral features of the CeO2 nanowires
sample displays in Fig. 3(a). The intense band observed
round 825 cm−1 is due to the Ce−O−C stretching vibration. The peak at 3410 cm−1 is related to hydrogen
bond of − OH groups of water molecules or surface −
OH groups. The peak around 542 cm−1 is assigned to the
Ce−O stretching band. The presence of APTS was confirmed by the aliphatic C-N character around 1230 cm−1 ,
and the peak at 1589 cm−1 confirmed primary N-H bending. When the antibody is absorbed on the electrode’s
surface, peaks corresponding to C=O stretching and NH bending of amin I form at 1671 cm−1 , 1695 cm−1 ,
respectively. The band at 1548 − 1586 cm−1 is assigned
to the N-H bending of amin II vibration. Meanwhile, the
peak around 467 cm−1 is assigned to the Ce−O stretching band, and the peak at 1430 cm−1 is assigned to the
bending vibration of C-H stretching of CeO2 (Fig. 3(b)).
Figure 3(c) shows the FTIR spectrum for antiboby immobilization via EDC/NHS-activated antibody. It can
be seen that the peak at 1673 cm−1 corresponding to the
C=O stretching of amin I. The peak around 610 cm−1 is
assigned to the Ce−O stretching band, the intense band
round 825 cm−1 is due to the Ce−O−C stretching vibration. In the case of protein A-mediated immobilization
(Fig. 3(d)), the presence of a 825 cm−1 peak, which is
clearly seen in the spectrum corresponds to Ce−O−C
stretching vibration, the peak at 695 cm−1 is assigned to
the Ce−O stretching band, and peak at 556 cm−1 is assigned to the Ce−O stretching band. The peak at 1675
cm−1 corresponds to the C=O stretching of amin I, confirming the immobilization of antibodies. Additionally,
the peak at 3435 cm−1 is related to the O-H stretching
vibration of H2 O in sample.
The density of antibodies on an APTS-CeO2 NWs
modified electrode was studied by using fluorescence
microscopy, and the results are shown in Fig. 4.
APTS/CeO2 NWs deposited electrode’s surface was
clearly black (Fig. 4(a)) while the surface of the electrode with antibodies immobilized by using absorption
(Fig. 4(b)), EDC/NHS activated antibody (Fig. 4(c)),
and protein A-mediated immobilization (Fig. 4(d))
clearly shown green fluorescence spots. This could confirm that antibodies were immobilized on the electrode’s
surface.
In this work, we used EIS to determine the immunosensor response defined by the interaction between
the antibodies and the V . cholerae O1 cells. The responses of the immunosensors prepared by using the
three-immobilization methods were compared and evaluated to determine the best immobilization method for
the CeO2 NWs-based immunosensor. As mentioned in a
previous study [36], EIS is an effective technique for developing biosensors that detect bacteria. The principle
underlying the function of the EIS-based immunosensor
depends on measurements of electrochemical Faradaic
impedance with [Fe(CN)6 ]3−/4− as the indicator probe.
The electrode was immersed in PBS solution containing
[Fe(CN)6 ]3−/4− , and an alternating current potential of
5 V was applied to the electrode. Consequently, oxidation and reduction of the [Fe(CN)6 ]3−/4− occurred.
The electrons were transferred between the two fingers
of the electrode array. When linkers modified the elec-
-1240-
Journal of the Korean Physical Society, Vol. 68, No. 10, May 2016
Fig. 5. (Color online) Nyquist diagrams for impedance measurements of immunosensors in the presence of 20 mM
[Fe(CN)6 ]3−/4− in a 1 mM PBS solution: (A) Antibody absorption method: (a) bare electrode, (b) APTS-CeO2 nanowiremodified electrode, (c) antibodies/APTS-CeO2 NWs-modified electrode, (d) BSA/antibodies/APTS-CeO2 NWs-modified electrode, and (e) cells/BSA/antibodies/APTS-CeO2 NWs-modified electrode. (B) Immobilization method via EDC/NHS activated antibody: (a) bare electrode, (b) APTS-CeO2 NWs-modified electrode, (c) antibodies-EDC-NHS/APTS-CeO2 NWsmodified electrode, (d) BSA/antibodies-EDC-NHS/APTS-CeO2 NWs-modified electrode, and (e) cells/ BSA/antibodies-EDCNHS/APTS-CeO2 NWs-modified electrode. (C) Immobilization method via protein A: (a) bare electrode, (b) APTS-CeO2
NWs-modified electrode, (c) protein A/APTS-CeO2 NWs-modified electrode, (d) antibodies/protein A/APTS-CeO2 NWsmodified electrode, (e) BSA/antibodies/protein A/APTS-CeO2 NWs-modified electrode, and (f) cells/BSA/antibodies/Protein
A/APTS-CeO2 NWs-modified electrode. (D) Comparison of the immunosensor responses for the three different antibody
immobilization methods.
trode’s surface, a thin film layer was formed, leading to
the inhibition of electron transfer between the fingers.
Thereby, an increase in electron-transfer resistance was
detected. Figure 5 presents the Nyquist plots for bacterial cell detection by immunosensors prepared by using
the three different immobilization methods: (A) absorption, (B) EDC/NHS-activated antibody, and (C) protein
A-mediated methods. Meanwhile, Fig. 5(D) compares
the immunosensor output signals for the three different immobilization methods. As observed in Fig. 5(A),
when the bare electrode was immersed in PBS solution containing the redox probe, the reduction process
of the redox probe was initiated, and electrons were
transferred between the two electrodes through the redox probe [Fe(CN)6 ]3−/4− . The electron transfer was
not blocked by any monolayer on the electrode’s surface.
Thus, the electron-transfer resistance (Ret) was determined to be 745 Ω, as shown in Fig. 5A(a), thereby indi-
cating high electron-transfer kinetics of the redox probe
at the electrode interface. After the APTS/CeO2 NWs
modified electrode surface, a thin film layer that could
have hindered electron transfer from [Fe(CN)6 ]3−/4− to
the conductive electrode’s surface was formed. However,
the positively-charged APTS/CeO2 nanowire promoted
transfer of the negative redox probe to the electrode’s
surface by electrostatic attraction. Thus, the value of
Ret decreased to 695 Ω, as shown in Fig. 5A(b).
When the antibodies were absorbed directly onto
the electrode’s surface modified with APTS/CeO2
nanowires, a layer of antibodies was formed on the electrode surface. This layer inhibited the electron transfer between the fingers of the electrode. An increase
in the electron-transfer resistance of 812 Ω was noted,
as shown in Fig. 5A(c). To block the unreacted and
nonspecific sites, the electrode surface modified with
antibodies/APTS/CeO2 nanowires was treated with 1%
Detection of Vibrio cholerae O1 by Using Cerium Oxide Nanowires · · · – Phuong Dinh Tam et al.
-1241-
Table 1. Comparison of the analytical parameters of the developed immunosensors for V . cholera O1 detection by using the
three different immobilization methods.
Methods
Absorption
EDC/NHS
Protein A
Detection limit
CFU/mL
3.2 × 10³
1.0 × 10³
1.0 × 10²
Sensitivity
Ω/CFUmL−1
45.1
50.6
65.8
BSA for 30 min. A Ret of 858 Ω was obtained, as shown
in Fig. 5A(d). When the cells are bound to the modified electrode’s surface, a reaction between the antibodies
and the cells potentially occurs. Consequently, immunocomplexes would then attach to the electrode’s surface,
forming an additional barrier that would further increase
the electron-transfer resistance. The Ret was 915 Ω, as
shown in Fig. 5A(e).
The changes in electron-transfer resistance before and
after cell detection were calculated by the following equation:
%ΔRet = 100(Ret
cell/antibody −Ret antibody )/Ret antibody
(1)
Where Ret antibody and Ret cells/antibody are the Ret values before and after the cells bind to the antibodymodified electrode’s surface, respectively. A 6.65% increase in the electron-transfer resistance was observed
after cell binding. Antibodies were confirmed to be immobilized successfully on the electrode’s surface by using the adsorption method. Figure 5B illustrates the
Nyquist plots for the immunosensors prepared by using
the EDC/NHS-activated antibody approach. As previously mentioned, the value of Ret for the bare electrode
and the electrode surface modified with APTS/CeO2
NWs were 745 and 695 Ω, respectively. The Ret increased to 847 Ω when EDC/NHS-activated antibodies
were immobilized on the surface of the electrode modified with APTS/CeO2 NWs, as shown in Fig. 2B(c).
When the modified electrode’s surface was blocked with
1% BSA for 30 min, the value of Ret increased to 892 Ω,
as shown in Fig. 5B(d). The value of Ret increased significantly (965 Ω) when cells were bound to the antibodymodified surface of the electrode, as shown in Fig. 5B(e).
By using Eq. (1), we calculated the change in Ret to be
about 8.3%.
Figure 5C shows the response of the immunosensor
prepared by antibody immobilization through protein A.
In this work, protein A was immobilized on the electrode
modified with APTS/CeO2 nanowires, as described in a
previous study [22]. The terminal carboxyl groups of
protein A were activated by incubation in EDC/NHS
solution for 20 min to produce an active intermediate of
the NHS ester (Fig. 2(c)). Afterward, the electrode modified with APTS/CeO2 NWs was immersed in a solution
Linearity range
CFU/mL
3.2 × 10³ − 1.0 × 10⁷
1.0 × 10³ − 1.0 × 10⁷
1.0 × 10² − 1.0 × 10⁷
of EDC/NHS-activated protein A for 24 h at room temperature. This step led to a crosslinking of the activated
protein A with the free amino groups on the electrode’s
surface modified with APTS/CeO2 nanowires. A Ret of
870 Ω was obtained for protein A immobilization on the
modified electrode (Fig. 5C(c)). When anti-V . cholerae
O1 was dropped on the protein A/APTS/CeO2 -NWmodified electrode, the value of Ret increased to 910 Ω,
as shown in Fig. 5C(d).
To avoid the binding of other proteins to the unreacted
NHS ester, the electrode was blocked with 1% BSA for
30 min, which resulted in an increase in the value of Ret
to 955 Ω, as shown in Fig. 5C(e). When the cells interacted with the antibodies immobilized on the electrode
surface, a Ret of 1110 Ω was noted. By using Eq. (1), we
calculated the change in Ret to be 16.2%. A comparison
among the responses of the immunosensors prepared by
using the three different antibody immobilization methods is shown in Fig. 5D. The highest and the lowest responses were achieved by the immunosensors prepared by
antibody immobilization with protein A (16.2% according to Eq. (1)) and with adsorption (6.65%). The response of the immunosensor prepared using EDC/NHSactivated antibodies was 8.3%. The analytical parameters of the developed immunosensors for V . cholera
O1 detection were also compared (Table 1). As shown in
Table 1, the order of the antibody immobilization strategies in terms of resultant immunosensor detection limit
and sensitivity is as follows: adsorption immobilization
< immobilization using EDC/NHS-activated antibodies
< protein A-mediated immobilization. Meanwhile, the
linearity range changed insignificantly.
C-V studies on the immunosensor detection of bacterial cells were performed in PBS solution containing 20
mM [Fe(CN)6 ]3−/4− at a scan rate of 100 mV·s−1 versus
a Ag/AgCl reference electrode. Figure 6 presents the
C-V characterizations of the immunosensors prepared
by antibody immobilization through (A) absorption, (B)
the use of EDC/NHS-activated antibodies, and (C) the
use of protein A. Meanwhile, Fig. 6D displays a comparison of the responses of the immunosensors prepared
by using the three different methods. As presented in
Fig. 6A(a, b), the C-V response of the APTS/CeO2
NWs-modified electrode is shifted relative to that of the
bare electrode. The peak current obviously increased
up to 84 μA because the APTS/CeO2 NWs film could
-1242-
Journal of the Korean Physical Society, Vol. 68, No. 10, May 2016
Fig. 6. (Color online) Cyclic voltammetry of the sensor in the presence of 20 mM [Fe(CN)6 ]3−/4− in a 1mM PBS solution, at a scan rate 100 mV/s. (A) Antibody absorption method: (a) bare electrode, (b) APTS-CeO2 NWs-modified electrode, (c) antibodies/APTS-CeO2 NWs-modified electrode, (d) BSA/antibodies/APTS-CeO2 NWs-modified electrode, and (e)
cells/BSA/antibodies/APTS-CeO2 NWs-modified electrode. (B) Immobilization method via EDC/NHS - activated antibody:
(a) bare electrode, (b) APTS-CeO2 NWs-modified electrode, (c) antibodies-EDC-NHS/APTS-CeO2 NWs-modified electrode,
(d) BSA/antibodies-EDC-NHS/APTS-CeO2 NWs-modified electrode, and (e) cells/BSA/antibodies-EDC-NHS/APTS-CeO2
NWs-modified electrode. (C) Immobilization method via protein A: (a) bare electrode, (b) APTS-CeO2 NWs-modified electrode, (c) protein A/APTS-CeO2 NWs-modified electrode, (d) antibodies/protein A/APTS-CeO2 NWs-modified electrode, (e)
BSA/antibodies/protein A/APTS-CeO2 NWs-modified electrode, and (f) cells/BSA/antibodies/Protein A/APTS-CeO2 NWsmodified electrode. (D) Comparison of the immunosensor responses for the three different antibody immobilization methods.
promote electron transfer of [Fe(CN)6 ]3−/4− . A slight
decrease in the peak current (77 μA) and a separation of
the peak potential (0.38 V) were observed for antibody
absorption on the APTS/CeO2 NWs-modified electrode
surface, as shown in Fig. 6A(c).
When the antibody-modified electrode’s surface was
blocked with 1% BSA for 30 min, the current value decreased continuously by 75 ΩA. An insignificant separation of the peak potential (0.36 V) was observed, as
shown in Fig. 6A(d). When the cells interacted with
the modified electrode’s surface, a decrease in the peak
current of 70 μA was observed, and this decrease corresponded to a signal variation of about 7.5% compared with that of the modified electrode, as shown in
Fig. 6A(e).
In the case of EDC/NHS activated antibody immobilization method, a decrease in the peak current of 76.5
μA was observed when EDC/NHS-activated antibodies were bound to the APTS/CeO2 -NW-modified electrode’s surface, as shown in Fig. 6B(c). A change of 69
μA was observed continuously after blocking with 1%
BSA for 30 min (Fig. 6B(d)). When cells were bound
on the electrode’s surface, a further decrease in the peak
current was found at 63 μA, as shown in Fig. 6B(e).
Therefore, the current value varied by about 9% compared with the signal for the antibody-modified electrode.
For the immunosensors prepared using protein A,
a slight decrease in the peak current (70 μA) was
observed under protein A immobilization on the
APTS/CeO2 -NWs-modified electrode surface, as shown
in Fig. 6C(c). When antibodies attached onto the protein A/APTS/CeO2 -NWs-modified electrode, a further
decrease of 68 μA in peak current was noted, as shown
Detection of Vibrio cholerae O1 by Using Cerium Oxide Nanowires · · · – Phuong Dinh Tam et al.
in Fig. 6C(d). A drop in the peak current of 66.7 μA
was obtained continuously when the sensor’s surface was
blocked with 1% BSA for 30 min, as shown in Fig. 6C(e).
When cells bound to the electrode surface, a decrease in
the peak current (11%) was clearly observed (Fig. 6C(f)).
Thus, the voltammetric behavior of the redox probe
was demonstrated to be affected by electrode’s surface
modification. Changes in the current peak were observed
because of electrode’s surface modification, which created another barrier layer that blocked access of the redox probe to the electrode’s surface within the applied
potential. The change in current was highest for the immunosensors with antibodies immobilized using protein
A (11%), followed by those prepared using EDC/NHSactivated antibodies (9%), and finally, by those prepared
by direct adsorption (7.5%), as shown in Fig. 6D.
The stability of the immunosensors prepared by using
different immobilization methods was studied and evaluated. The nine immunosensors that utilized different
antibody immobilization methods were stored in 0.1 M
PBS (pH 7.4) at 4 ◦ C for 135 days and subsequently
analyzed at different times (45 day/times), as shown in
Fig. 7(a). Repeatable signals were observed for up to
45 days for all the immunosensors. At day 90, the signal response of the stored immunosensors was changed
by approximately 11.4% for those prepared by using direct antibody absorption, 6.1% for those prepared by
using EDC/NHS-activated antibodies, and 5.6% for protein A-mediated immobilization. No response signal was
detected for all of the immunosensors after they had been
stored for 135 days, indicating a loss of biological activity
of the anti-V . cholerae O1, which could have been denatured by that time; thus, no binding with the bacterial
cells was exhibited. By these results, we can conclude
that the immunosensors exhibited acceptable stability
and that the immunosensor using protein A showed the
greatest stability.
The specificity of the immunosensors was also studied by using Salmonella and Escherichia coli O157:H7
bacteria as control samples. No response signals of the
immunosensors were detected for either bacterial species.
Shifts in the value of Ret of 900, 975, and 1010 Ω corresponding to 5.9%, 14.7%, and 18.8%, respectively, after
V . cholerae O1 detection were noted after antibody immobilization by adsorption, EDC/NHS activation, and
protein A, respectively (Fig. 7(b)). These results show
that the specificities of the immunosensors prepared under the three approaches were all high.
Regeneration is a significant aspect in the development of immunosensors for in-field/on-site detection. To
study the regeneration of the immunosensors, antibodyimmobilized electrodes were immersed in a buffer solution containing V . cholerae O1 for 90 min. Then, the immunosensors were washed with PBS buffer solution and
DI water and dried with nitrogen gas. The V . cholerae
O1 cell concentration was determined from the change
in the measure value of Ret. After detection of cells of
V . cholerae O1, the immunosensor was dipped into a
-1243-
Fig. 7. (Color online) (a) Stability of the immunosensor at
different times for 135 day, (b) specificity of the immunosensor toward E. coli O157: H7, salmonella, and V. cholerae
O1 bacterium, and (c) the regeneration performance of the
immunosensor.
glycine-HCl buffer (pH 2.8) for about 10 min to remove
cells. Subsequently, the immunosensor was washed with
PBS buffer solution, DI water and dried with nitrogen
gas. The immunosensor was again measured with cells
of V . cholerae O1 under the same conditions. The obtained results indicate that the signal responses had decreased by approximately 25%, 18%, and 11% for the immunosensors prepared by using adsorption, EDC/NHS-
-1244-
Journal of the Korean Physical Society, Vol. 68, No. 10, May 2016
activated antibodies, and protein A-mediated immobilization, respectively (Fig. 7(c)).
among those of all methods tested. Thus, CeO2 -NWsbased immunosensors should be prepared by using the
protein A-mediated immobilization method to enhance
immunosensor performance.
IV. DISCUSSION
The three-immobilization methods were compared to
determine the best immobilization method to prepare
CeO2 -NWs-based immunosensors for V . cholerae O1
detection. As mentioned above, the changes in the
immunosensor’s response after the use of the three
different immobilization methods were approximately
6.65%, 8.3%, and 16.2% for the antibody adsorption,
the EDC/NHS-activated antibody, and the protein Amediated immobilization methods, respectively. The
variation in the immunosensor’s signal was also determined by using cyclic voltammetry. The peak current
changed by about 7.5% for antibody adsorption, 9% for
EDC/NHS-activated antibody immobilization, and 11%
for antibody immobilization via protein A. Antibody adsorption exerted no significant effect on the immunosensor’s response. In contrast, the immunosensor’s response
increased significantly when antibodies were immobilized
by using EDC/NHS activation and protein A. As previously discussed, the change in the immunosensor’s response could be attributed to several factors including
the following: 1) the random orientation of antibodies
and steric hindrance caused by improper antibody orientation with respect to the electrode’s surface, 2) denaturation of immobilized antibodies by the environmental pH and temperature, and 3) biocompatibility. Several researchers [31, 37–39] have reported that protein
A could specifically bind with the Fc fragment of antibodies and control antibody orientation. This attribute
does not block the antibody’s active sites for antigen
binding, resulting in high cell-binding capacities. Additionally, protein A’s biocompatibility conferred the immunosensor with enhanced detection performance. In
the immunosensors prepared with EDC/NHS-activated
antibodies, the antibodies could be crosslinked to the
amino groups on the surface of the APTS/CeO2 -NWsmodified electrode. This occurrence would remove some
biological activity and prevent some of the random orientations of the antibodies. Several binding sites of antibodies could be blocked because of steric hindrance of
the antigen-binding domains. For this reason, the immunosensor’s response was lower than that of the immunosensors prepared via immobilization using protein
A.
For direct antibody absorption, antibodies were absorbed on the sensor’s surface by weak binding, such as
van der Waals or electrostatic interactions. However,
these interactions can be denatured by thermal and acidbase environmental or analytical chemistry conditions.
Furthermore, antibody orientation was random, leading to low cell-binding capacity and low cell detection.
Therefore, the immunosensor response was the lowest
V. CONCLUSION
Our study mainly aims to evaluate the effects of different antibody immobilization strategies on the response
of CeO2 -NWs-based immunosensors. We determined the
best immobilization method to apply for the design of
CeO2 -NWs-based immunosensors and immunosensors in
general. In this study, we compared the performances of
immunosensors prepared by using three antibody immobilization methods: adsorption, the use of EDC/NHSactivated antibodies, and the use of protein A-mediated
antibodies. Both the adsorption and the EDC/NHSactivated antibody methods are simple, cost effective,
and appropriate for large-scale production. However, improving sensor performance using these approaches was
difficult because of low cell-binding capacity from random antibody orientations and denaturation under environmental conditions. In contrast, protein A-mediated
immobilization yielded the best orientation and antigenbinding efficiency among the tested methods. This approach was then confirmed as the most suitable strategy for preparing CeO2 -NWs-based immunosensors for
V . cholerae O1 detection.
ACKNOWLEDGMENTS
This work was supported by the Ministry of Education and Training under the research project code
B2014.01.78.
REFERENCES
[1] S. Weng, M. Chen, C. Zhao, A. Liu, L. Lin, Q. Liu, J.
Lin and X. Lin, Sensors and Actuators B 184, 1 (2013).
[2] C. Song, G. Xie, L. Wang, L. Liu, G. Tian and H. Xiang,
Biosensors and Bioelectronics 58, 68 (2014).
[3] X. Wang, J. Miao, Q. Xia, K. Yang, X. Huang, W. Zhao
and J. Shen, Electrochimica Acta 112, 473 (2013).
[4] M.-J. Song and S. W. Hwang, J. Korean Phys. Soc. 54,
1612 (2009).
[5] H.-K. Seo, D. J. Park and J. Y. Park, J. Korean Phys.
Soc. 51, S284 (2007).
[6] R. C. Alves, F. B. Pimentel, H. P. A. Nouws, R. C.
B. Marques, M. B. Gonz´
alez-Garc´ıa, M. Beatriz, P.
P. Oliveira and Cristina Delerue-Matos, Biosensors and
Bioelectronics 64, 19 (2015).
[7] G. Yang, W. Jin, L. Wu, Q. Wang, H. Shao, A. Qin, B.
Yu, D. Li and B. Cai, Analytica Chimica Acta 706, 120
(2011).
Detection of Vibrio cholerae O1 by Using Cerium Oxide Nanowires · · · – Phuong Dinh Tam et al.
[8] W. Jin, G. Yang, H. Shao and A. Qin, Food Control 39,
185 (2014).
[9] Q. Wei, Y. Zhao, B. Du, D. Wua, H. Li and M. Yang,
Food Chemistry 134, 1601 (2012).
[10] F. Long, M. He, H. C. Shi and A.N. Zhu, Biosensors and
Bioelectronics 23, 952 (2008).
[11] I. M. Ciumasu, P. M. Kr¨
amer, C. M. Weber, G. Kolb,
D. Tiemann, S. Windisch, I. Frese and A. A. Kettrup,
Biosensors and Bioelectronics 21, 354 (2005).
[12] E. Mauriz, A. Calle, A. Montoy and L. M. Lechug, Talanta 69, 359 (2006).
[13] J. Buijs, D. D. White and W. Norde, Colloids and Surfaces B:Biointerfaces 8, 239 (1997).
[14] C. D. Corso, A. Dickherber and W. D. Hunt, Biosensors
and Bioelectronics 24, 805 (2008).
[15] Y. Wang, J. Ping, Z. Ye, J. Wu, and Y. Ying, Biosensors
and Bioelectronics 49, 492(2013).
[16] A. Ahluwalia, D. De Rossi, C. Ristori, A. Schiron and
G. Serra, Biosensors & Bioelectronics 7, 207 (1991).
[17] S. Chen, L. Liu, J. Zhou and S. Jiang, Langmuir 19,
2859 (2003).
[18] U. Sungkanak, A. Sappat, A. Wisitsoraat, C. Promptmasa and A. Tuantranont, Biosensors and Bioelectronics
26, 784 (2010).
[19] E. de Juan-Franco, A. Caruz, J. R. Pedrajas and Laura
M. Lechuga, Analyst 138, 2023 (2013).
[20] H. Wang, Y. Liu, Y. Yang, T. Deng, G. Shen and R. Yu,
Analytical Biochemistry 324, 219 (2004).
[21] E. de Juan-Franco, A. Caruz, J. R. Pedrajas and Laura
M. Lechuga, Analyst 138, 2023 (2013).
[22] A. Kausaite-Minkstimiene, A. Ramanaviciene, J. Kirlyte
and A. Ramanavicius, Anal. Chem. 82, 6401 (2010).
[23] R. Wang, C. Ruan, D. Kanayeva, K. Lassiter and Y. Li,
Nano Letters 8, 2625 (2008).
[24] C.-C. Lin, Y.-M. Chu and H.-C. Chang, Sensors and Ac-
-1245-
tuators B 187, 533 (2013).
[25] P. I. Reyes, C.-J. Ku, Z. Duan, Y. Lu, A. Solanki and
K.-B. Lee, Applied Physics Letters 98, 173702 (2011).
[26] A. A. Ansari, A. Kaushik, P. R. Solanki and B. D. Malhotra, Bioelectrochemistry 77, 75 (2010).
[27] M. S. Wilson and R. D. Rauh, Biosensors and Bioelectronics 19, 693 (2004).
[28] A. Kaushik, P. R. Solanki, M. K. Pandey, S. Ahmad and
Bansi D. Malhotra, Appl. Phys. lett. 95, 173703 (2009).
[29] P. R. Solanki, Md. AzaharAli, A. Kaushik and B. D.
Malhotra, Advanced Electrochemistry 1, 1 (2014).
[30] J. Peng, Y.-D. Zhu, X.-H. Li, L.-P. Jiang, E. S. AbdelHalim and J.-J. Zhu, Microchim Acta 181, 1505 (2014).
[31] S. Babacan, P. Pivarnik, S. Letcher and A. G. Rand,
Biosensors & Bioelectronics 15, 615 (2000).
[32] R. Danczyk, B. Krieder, A. North, T. Webster, H. HogenEsch and A. Rundell, Biotechnology and Bioengineering 84, 215 (2003).
[33] S. K. Vashist, Diagnostics 2, 23 (2012).
[34] J. E. Lee, J. H. Seo, C. S. Kim, Y. Kwon, J. H. Ha, S.
S. Choi and H. J. Cha, Korean J. Chem. Eng. 30, 1934
(2013).
[35] J. Conde, J. T. Dias, V. Graz´
u, Maria Moros, P. V. Baptista and Jesus M. de la Fuente, Frontiers in Chemistry
2, 1 (2014).
[36] L. Yang, Y. Li and G. F. Erf, Anal. Chem. 76, 1107
(2004).
[37] B. Lu, M. R. Smyth and R. O’Kennedy, Analyst 121,
29R (1996).
[38] G. P. Anderson, M. A. Jacoby, F. S. Ligler and K. D.
King, Biosensors & Bioelectronics 12, 329 (1997).
[39] B. Derkus, K. C. Emregul, H. Mazi, E. Emregul, T.
Yumak and A. Sinag, Bioprocess Biosyst Eng, DOI
10.1007/s00449-013-1068-2.