Chapter 8 stock valuation
Bạn đang xem bản rút gọn của tài liệu. Xem và tải ngay bản đầy đủ của tài liệu tại đây (1.48 MB, 30 trang )
234
PA RT 3
Valuation of Future Cash Flows P A R T 3
8
Valuation of Future Cash Flows
STOCK VALUATION
When the stock market closed on May 10, 2006, the
be offering similar dividends to their stockholders,
common stock of McGraw-Hill, publisher of fine-
but you would be wrong. In fact, Wachovia’s annual
quality college textbooks, was going for $53.55 per
dividend was $2.04 per share, McGraw-Hill’s was
share. On that same day, stock in Wachovia, one
$0.73 per share, and Lexmark International was pay-
of the largest banks in the United States, closed at
ing no dividends at all!
$55.20, while stock in Lexmark International, the
As we will see in this chapter, the dividends currently
printer manufacturer, closed at $52.59. Because
being paid are one of the primary factors we look at when
the stock prices of these three companies were
attempting to value common stocks. However, it is obvi-
so similar, you
ous from looking at Lexmark that current dividends are
Visit us at www.mhhe.com/rwj
might expect
not the end of the story. This chapter explores dividends,
DIGITAL STUDY TOOLS
that they would
stock values, and the connection between the two.
• Self-Study Software
• Multiple-Choice Quizzes
• Flashcards for Testing and
Key Terms
In our previous chapter, we introduced you to bonds and bond valuation. In
this chapter, we turn to the other major source of financing for corporations:
common and preferred stock. We first describe the cash flows associated
with a share of stock and then go on to develop a famous result, the dividend growth model.
From there, we move on to examine various important features of common and preferred
stock, focusing on shareholder rights. We close the chapter with a discussion of how shares
of stock are traded and how stock prices and other important information are reported in
the financial press.
234
ros3062x_Ch08.indd 234
2/23/07 8:36:42 PM
CHAPTER 8
235
Stock Valuation
Common Stock Valuation
8.1
A share of common stock is more difficult to value in practice than a bond for at least
three reasons. First, with common stock, not even the promised cash flows are known
in advance. Second, the life of the investment is essentially forever because common
stock has no maturity. Third, there is no way to easily observe the rate of return that the
market requires. Nonetheless, as we will see, there are cases in which we can come up
with the present value of the future cash flows for a share of stock and thus determine
its value.
CASH FLOWS
Imagine that you are considering buying a share of stock today. You plan to sell the stock
in one year. You somehow know that the stock will be worth $70 at that time. You predict
that the stock will also pay a $10 per share dividend at the end of the year. If you require
a 25 percent return on your investment, what is the most you would pay for the stock? In
other words, what is the present value of the $10 dividend along with the $70 ending value
at 25 percent?
If you buy the stock today and sell it at the end of the year, you will have a total of $80
in cash. At 25 percent:
Present value ϭ ($10 ϩ 70)͞1.25 ϭ $64
Therefore, $64 is the value you would assign to the stock today.
More generally, let P0 be the current price of the stock, and assign P1 to be the price in
one period. If D1 is the cash dividend paid at the end of the period, then:
P0 ϭ (D1 ϩ P1)͞(1 ϩ R)
[8.1]
where R is the required return in the market on this investment.
Notice that we really haven’t said much so far. If we wanted to determine the value of
a share of stock today (P0), we would first have to come up with the value in one year (P1).
This is even harder to do, so we’ve only made the problem more complicated.
What is the price in one period, P1? We don’t know in general. Instead, suppose we
somehow knew the price in two periods, P2. Given a predicted dividend in two periods, D2,
the stock price in one period would be:
P1 ϭ (D2 ϩ P2)͞(1 ϩ R)
If we were to substitute this expression for P1 into our expression for P0, we would have:
D2 ϩ P2
D1 ϩ _______
ϩ
P
D
1
1
1ϩR
P0 ϭ _______
ϭ ____________
1ϩR
1ϩR
D1
D2
P2
ϭ _______
ϩ _______
ϩ _______
1
2
(1 ϩ R)
(1 ϩ R)
(1 ϩ R)2
Now we need to get a price in two periods. We don’t know this either, so we can procrastinate again and write:
P2 ϭ (D3 ϩ P3)͞(1 ϩ R)
ros3062x_Ch08.indd 235
2/9/07 11:18:32 AM
236
PA RT 3
Valuation of Future Cash Flows
If we substitute this back in for P2, we have:
D1
D2
P2
P0 ϭ _______
ϩ _______
ϩ _______
1
2
(1 ϩ R)
(1 ϩ R)
(1 ϩ R)2
D3 ϩ P3
_______
D
D
1
2
1ϩR
ϭ _______1 ϩ _______2 ϭ _______
(1 ϩ R)
(1 ϩ R)
(1 ϩ R)2
D3
P3
D1
D2
ϭ _______
ϩ _______
ϩ _______
ϩ _______
(1 ϩ R)1 (1 ϩ R)2 (1 ϩ R)3 (1 ϩ R)3
You should start to notice that we can push the problem of coming up with the stock
price off into the future forever. Note that no matter what the stock price is, the present
value is essentially zero if we push the sale of the stock far enough away.1 What we are
eventually left with is the result that the current price of the stock can be written as the
present value of the dividends beginning in one period and extending out forever:
D3
D5
D1
D2
D4
P0 ϭ _______
ϩ _______
ϩ _______
ϩ _______
ϩ _______
ϩ…
(1 ϩ R)1 (1 ϩ R)2 (1 ϩ R)3 (1 ϩ R)4 (1 ϩ R)5
We have illustrated here that the price of the stock today is equal to the present value
of all of the future dividends. How many future dividends are there? In principle, there
can be an infinite number. This means that we still can’t compute a value for the stock
because we would have to forecast an infinite number of dividends and then discount them
all. In the next section, we consider some special cases in which we can get around this
problem.
EXAMPLE 8.1
Growth Stocks
You might be wondering about shares of stock in companies such as Yahoo! that currently
pay no dividends. Small, growing companies frequently plow back everything and thus
pay no dividends. Are such shares worth nothing? It depends. When we say that the value
of the stock is equal to the present value of the future dividends, we don’t rule out the
possibility that some number of those dividends are zero. They just can’t all be zero.
Imagine a company that has a provision in its corporate charter that prohibits the paying
of dividends now or ever. The corporation never borrows any money, never pays out any
money to stockholders in any form whatsoever, and never sells any assets. Such a corporation couldn’t really exist because the IRS wouldn’t like it; and the stockholders could
always vote to amend the charter if they wanted to. If it did exist, however, what would the
stock be worth?
The stock is worth absolutely nothing. Such a company is a financial “black hole.”
Money goes in, but nothing valuable ever comes out. Because nobody would ever get any
return on this investment, the investment has no value. This example is a little absurd, but it
illustrates that when we speak of companies that don’t pay dividends, what we really mean
is that they are not currently paying dividends.
1
The only assumption we make about the stock price is that it is a finite number no matter how far away we
push it. It can be extremely large, just not infinitely so. Because no one has ever observed an infinite stock price,
this assumption is plausible.
ros3062x_Ch08.indd 236
2/9/07 11:18:32 AM
CHAPTER 8
Stock Valuation
237
SOME SPECIAL CASES
In a few useful special circumstances, we can come up with a value for the stock. What we
have to do is make some simplifying assumptions about the pattern of future dividends.
The three cases we consider are the following: (1) The dividend has a zero growth rate,
(2) the dividend grows at a constant rate, and (3) the dividend grows at a constant rate after
some length of time. We consider each of these separately.
Zero Growth The case of zero growth is one we’ve already seen. A share of common
stock in a company with a constant dividend is much like a share of preferred stock. From
Chapter 6 (Example 6.7), we know that the dividend on a share of preferred stock has zero
growth and thus is constant through time. For a zero-growth share of common stock, this
implies that:
D1 ϭ D2 ϭ D3 ϭ D ϭ constant
So, the value of the stock is:
D
D
D
D
D
P0 ϭ _______
ϩ _______
ϩ _______
ϩ _______
ϩ _______
ϩ...
(1 ϩ R)1 (1 ϩ R)2 (1 ϩ R)3 (1 ϩ R)4 (1 ϩ R)5
Because the dividend is always the same, the stock can be viewed as an ordinary perpetuity
with a cash flow equal to D every period. The per-share value is thus given by:
P0 ϭ D͞R
[8.2]
where R is the required return.
For example, suppose the Paradise Prototyping Company has a policy of paying a
$10 per share dividend every year. If this policy is to be continued indefinitely, what is the
value of a share of stock if the required return is 20 percent? The stock in this case amounts
to an ordinary perpetuity, so the stock is worth $10͞.20 ϭ $50 per share.
Constant Growth Suppose we know that the dividend for some company always grows
at a steady rate. Call this growth rate g. If we let D0 be the dividend just paid, then the next
dividend, D1, is:
D1 ϭ D0 ϫ (1 ϩ g)
The dividend in two periods is:
D2 ϭ D1 ϫ (1 ϩ g)
ϭ [D0 ϫ (1 ϩ g)] ϫ (1 ϩ g)
ϭ D0 ϫ (1 ϩ g)2
We could repeat this process to come up with the dividend at any point in the future. In
general, from our discussion of compound growth in Chapter 6, we know that the dividend
t periods into the future, Dt, is given by:
Dt ϭ D0 ϫ (1 ϩ g)t
As we have previously seen, an asset with cash flows that grow at a constant rate forever
is called a growing perpetuity.
The assumption of steady dividend growth might strike you as peculiar. Why would the
dividend grow at a constant rate? The reason is that, for many companies, steady growth in
dividends is an explicit goal. For example, in 2006, Procter & Gamble, the Cincinnati-based
maker of personal care and household products, increased its dividend by 10.7 percent to
ros3062x_Ch08.indd 237
2/9/07 11:18:33 AM
238
PA RT 3
Valuation of Future Cash Flows
$1.00 per share; this increase was notable because it was the 50th in a row. The subject of
dividend growth falls under the general heading of dividend policy, so we will defer further
discussion of it to a later chapter.
EXAMPLE 8.2
Dividend Growth
The Hedless Corporation has just paid a dividend of $3 per share. The dividend of this
company grows at a steady rate of 8 percent per year. Based on this information, what will
the dividend be in five years?
Here we have a $3 current amount that grows at 8 percent per year for five years. The
future amount is thus:
$3 ؋ 1.085 ؍$3 ؋ 1.4693 ؍$4.41
The dividend will therefore increase by $1.41 over the coming five years.
See the
dividend discount model
in action at
www.dividenddiscount
model.com.
If the dividend grows at a steady rate, then we have replaced the problem of forecasting
an infinite number of future dividends with the problem of coming up with a single growth
rate, a considerable simplification. In this case, if we take D0 to be the dividend just paid
and g to be the constant growth rate, the value of a share of stock can be written as:
D3
D1
D2
ϩ...
P0 ϭ _______
ϩ _______
ϩ _______
(1 ϩ R)1 (1 ϩ R)2 (1 ϩ R)3
D0(1 ϩ g)1 _________
D0(1 ϩ g)2 _________
D0(1 ϩ g)3
ϭ _________
ϩ
ϩ
ϩ...
(1 ϩ R)1
(1 ϩ R)2
(1 ϩ R)3
dividend growth model
A model that determines
the current price of a stock
as its dividend next period
divided by the discount rate
less the dividend growth
rate.
As long as the growth rate, g, is less than the discount rate, r, the present value of this series
of cash flows can be written simply as:
D0 ϫ (1 ϩ g) ______
D1
P0 ϭ ___________
ϭ
[8.3]
RϪg
RϪg
This elegant result goes by a lot of different names. We will call it the dividend growth
model. By any name, it is easy to use. To illustrate, suppose D0 is $2.30, R is 13 percent,
and g is 5 percent. The price per share in this case is:
P0 ϭ D0 ϫ (1 ϩ g)͞(R Ϫ g)
ϭ $2.30 ϫ 1.05͞(.13 Ϫ .05)
ϭ $2.415͞.08
ϭ $30.19
We can actually use the dividend growth model to get the stock price at any point in
time, not just today. In general, the price of the stock as of time t is:
Dt ϫ (1 ϩ g) ______
D
Pt ϭ ___________
ϭ tϩ1
[8.4]
RϪg
RϪg
In our example, suppose we are interested in the price of the stock in five years, P5. We first
need the dividend at time 5, D5. Because the dividend just paid is $2.30 and the growth rate
is 5 percent per year, D5 is:
D5 ϭ $2.30 ϫ 1.055 ϭ $2.30 ϫ 1.2763 ϭ $2.935
From the dividend growth model, we get the price of the stock in five years:
D5 ϫ (1 ϩ g) ____________
$3.0822
$2.935 ϫ 1.05 _______
P5 ϭ ___________
ϭ
ϭ $38.53
ϭ
RϪg
.08
.13 Ϫ .05
ros3062x_Ch08.indd 238
2/9/07 11:18:34 AM
CHAPTER 8
239
Stock Valuation
Gordon Growth Company
EXAMPLE 8.3
The next dividend for the Gordon Growth Company will be $4 per share. Investors require
a 16 percent return on companies such as Gordon. Gordon’s dividend increases by 6 percent every year. Based on the dividend growth model, what is the value of Gordon’s stock
today? What is the value in four years?
The only tricky thing here is that the next dividend, D1, is given as $4, so we won’t multiply this by (1 ϩ g). With this in mind, the price per share is given by:
P0 ؍D1͞(R ؊ g)
؍$4͞(.16 ؊ .06)
؍$4͞.10
؍$40
Because we already have the dividend in one year, we know that the dividend in four
years is equal to D1 ؋ (1 ؉ g)3 ؍$4 ؋ 1.063 ؍$4.764. The price in four years is therefore:
P4 ؍D4 ؋ (1 ؉ g)͞(R ؊ g)
؍$4.764 ؋ 1.06͞(.16 ؊ .06)
؍$5.05͞.10
؍$50.50
Notice in this example that P4 is equal to P0 ؋ (1 ؉ g)4.
P4 ؍$50.50 ؍$40 ؋ 1.064 ؍P0 ؋ (1 ؉ g)4
To see why this is so, notice first that:
P4 ؍D5͞(R ؊ g)
However, D5 is just equal to D1 ؋ (1 ؉ g)4, so we can write P4 as:
P4 ؍D1 ؋ (1 ؉ g)4͞(R ؊ g)
[ ؍D1͞(R ؊ g)] ؋ (1 ؉ g)4
؍P0 ؋ (1 ؉ g)4
This last example illustrates that the dividend growth model makes the implicit
assumption that the stock price will grow at the same constant rate as the dividend. This
really isn’t too surprising. What it tells us is that if the cash flows on an investment grow at
a constant rate through time, so does the value of that investment.
You might wonder what would happen with the dividend growth model if the growth
rate, g, were greater than the discount rate, R. It looks like we would get a negative stock
price because R Ϫ g would be less than zero. This is not what would happen.
Instead, if the constant growth rate exceeds the discount rate, then the stock price is infinitely
large. Why? If the growth rate is bigger than the discount rate, the present value of the dividends keeps getting bigger. Essentially the same is true if the growth rate and the discount rate
are equal. In both cases, the simplification that allows us to replace the infinite stream of dividends with the dividend growth model is “illegal,” so the answers we get from the dividend
growth model are nonsense unless the growth rate is less than the discount rate.
Finally, the expression we came up with for the constant growth case will work for any
growing perpetuity, not just dividends on common stock. As we saw in Chapter 6, if C1 is the
next cash flow on a growing perpetuity, then the present value of the cash flows is given by:
Present value ϭ C1͞(R Ϫ g) ϭ C0(1 ϩ g)͞(R Ϫ g)
ros3062x_Ch08.indd 239
2/9/07 11:18:35 AM
240
PA RT 3
Valuation of Future Cash Flows
Notice that this expression looks like the result for an ordinary perpetuity except that we
have R Ϫ g on the bottom instead of just R.
Nonconstant Growth The next case we consider is nonconstant growth. The main
reason to consider this case is to allow for “supernormal” growth rates over some finite
length of time. As we discussed earlier, the growth rate cannot exceed the required return
indefinitely, but it certainly could do so for some number of years. To avoid the problem
of having to forecast and discount an infinite number of dividends, we will require that the
dividends start growing at a constant rate sometime in the future.
For a simple example of nonconstant growth, consider the case of a company that is
currently not paying dividends. You predict that, in five years, the company will pay a
dividend for the first time. The dividend will be $.50 per share. You expect that this dividend will then grow at a rate of 10 percent per year indefinitely. The required return on
companies such as this one is 20 percent. What is the price of the stock today?
To see what the stock is worth today, we first find out what it will be worth once dividends are paid. We can then calculate the present value of that future price to get today’s
price. The first dividend will be paid in five years, and the dividend will grow steadily
from then on. Using the dividend growth model, we can say that the price in four years
will be:
P4 ϭ D4 ϫ (1 ϩ g)͞(R Ϫ g)
ϭ D5͞(R Ϫ g)
ϭ $.50͞(.20 Ϫ .10)
ϭ $5
If the stock will be worth $5 in four years, then we can get the current value by discounting this price back four years at 20 percent:
P0 ϭ $5͞1.204 ϭ $5͞2.0736 ϭ $2.41
The stock is therefore worth $2.41 today.
The problem of nonconstant growth is only slightly more complicated if the dividends
are not zero for the first several years. For example, suppose you have come up with the
following dividend forecasts for the next three years:
Year
Expected Dividend
1
2
3
$1.00
$2.00
$2.50
After the third year, the dividend will grow at a constant rate of 5 percent per year. The
required return is 10 percent. What is the value of the stock today?
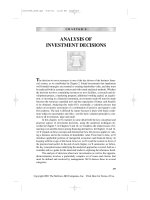
In dealing with nonconstant growth, a time line can be helpful. Figure 8.1 illustrates
one for this problem. The important thing to notice is when constant growth starts. As
we’ve shown, for this problem, constant growth starts at time 3. This means we can use our
constant growth model to determine the stock price at time 3, P3. By far the most common
mistake in this situation is to incorrectly identify the start of the constant growth phase and,
as a result, calculate the future stock price at the wrong time.
As always, the value of the stock is the present value of all the future dividends. To
calculate this present value, we first have to compute the present value of the stock price
three years down the road, just as we did before. We then have to add in the present value
ros3062x_Ch08.indd 240
2/9/07 11:18:35 AM
CHAPTER 8
Constant growth @ 5%
Nonconstant growth
Time
Dividends
0
1
2
3
$1
$2
$2.50
4
$2.50
ϫ 1.05
241
Stock Valuation
FIGURE 8.1
Nonconstant Growth
5
$2.50
ϫ 1.052
of the dividends that will be paid between now and then. So, the price in three years is:
P3 ϭ D3 ϫ (1 ϩ g)͞(R Ϫ g)
ϭ $2.50 ϫ 1.05͞(.10 Ϫ .05)
ϭ $52.50
We can now calculate the total value of the stock as the present value of the first three
dividends plus the present value of the price at time 3, P3:
D3
P3
D1
D2
P0 ϭ _______
ϩ _______
ϩ _______
ϩ _______
1
2
3
(1 ϩ R)
(1 ϩ R)
(1 ϩ R)
(1 ϩ R)3
$1
2.50 ϩ _____
52.50
2 ϩ _____
ϭ ____ ϩ _____
1.10 1.102 1.103 1.103
ϭ $.91 ϩ 1.65 ϩ 1.88 ϩ 39.44
ϭ $43.88
The value of the stock today is thus $43.88.
Supernormal Growth
EXAMPLE 8.4
Chain Reaction, Inc., has been growing at a phenomenal rate of 30 percent per year
because of its rapid expansion and explosive sales. You believe this growth rate will last for
three more years and will then drop to 10 percent per year. If the growth rate then remains
at 10 percent indefinitely, what is the total value of the stock? Total dividends just paid were
$5 million, and the required return is 20 percent.
Chain Reaction’s situation is an example of supernormal growth. It is unlikely that a
30 percent growth rate can be sustained for any extended time. To value the equity in this
company, we first need to calculate the total dividends over the supernormal growth period:
Year
Total Dividends (in millions)
1
2
3
$5.00 ϫ 1.3 ϭ $ 6.500
6.50 ϫ 1.3 ϭ 8.450
8.45 ϫ 1.3 ϭ 10.985
The price at time 3 can be calculated as:
P3 ؍D3 ؋ (1 ؉ g)͞(R ؊ g)
where g is the long-run growth rate. So, we have:
P3 ؍$10.985 ؋ 1.10͞(.20 ؊ .10) ؍$120.835
(continued)
ros3062x_Ch08.indd 241
2/9/07 11:18:36 AM
242
PA RT 3
Valuation of Future Cash Flows
To determine the value today, we need the present value of this amount plus the present
value of the total dividends:
D3
P3
D1
D2
P0 ________ ؍
؉ ________
؉ ________
؉ ________
(1 ؉ R)1 (1 ؉ R)2 (1 ؉ R)3 (1 ؉ R)3
$6.50
10.985 ؉ ________
120.835
8.45 ؉ _______
______ ؍؉ _____
1.20
1.202
1.203
1.203
؍$5.42 ؉ 5.87 ؉ 6.36 ؉ 69.93
؍$87.58
The total value of the stock today is thus $87.58 million. If there were, for example,
20 million shares, then the stock would be worth $87.58͞20 ؍$4.38 per share.
Two-Stage Growth The last case we consider is a special case of nonconstant growth: twostage growth. Here, the idea is that the dividend will grow at a rate of g1 for t years and then
grow at a rate of g2 thereafter forever. In this case, the value of the stock can be written as:
Pt
D1
1ϩg t
P0 ϭ ______
ϫ 1 Ϫ ______1 ϩ _______
R Ϫ g1
1ϩR
(1 ϩ R)t
[ (
)]
[8.5]
Notice that the first term in our expression is the present value of a growing annuity, which
we discussed in Chapter 6. In this first stage, g1 can be greater than R. The second part is
the present value of the stock price once the second stage begins at time t.
We can calculate Pt as follows:
D0 ϫ ( 1 ϩ g1 ) t ϫ ( 1 ϩ g2 )
Dt ϩ1
Pt ϭ ______
ϭ _____________________
R Ϫ g2
R Ϫ g2
[8.6]
In this calculation, we need the dividend at time t ϩ 1, Dtϩ1, to get the stock price at time t,
Pt. Notice that to get it, we grew the current dividend, D0, at rate g1 for t periods and then
grew it one period at rate g2. Also, in this second stage, g2 must be less than R.
EXAMPLE 8.5
Two-Stage Growth
The Highfield Company’s dividend is expected to grow at 20 percent for the next five
years. After that, the growth is expected to be 4 percent forever. If the required return is
10 percent, what’s the value of the stock? The dividend just paid was $2.
There is a fair amount of computation here, but it is mostly just “plug and chug” with a
calculator. We can start by calculating the stock price five years from now, P5:
D0 ؋ ( 1 ؉ g1 )5 ؋ ( 1 ؉ g2 )
D6
P5 _______ ؍
______________________ ؍
R ؊ g2
R ؊ g2
$2 ؋ (1 ؉ .20)5 ؋ (1 ؉ .04) $5.18
______ ؍ ________________________ ؍
.10 ؊ .04
.06
؍$86.26
We then plug into our two-stage growth formula to get the price today:
Pt
D1
1؉g t
؋ 1 ؊ ______1 ؉ _______
P0 _______ ؍
R ؊ g1
1؉R
(1 ؉ R)t
΄
)΅
(
5
$2 ؋ (1 ؉ .20)
$86.26
1 ؉ .20 ؉ _________
_____________ ؍؋ 1 ؊ _______
.10 ؊ .20
1 ؉ .10
(1 ؉ .10)5
΄
(
)΅
؍$66.64
(continued)
ros3062x_Ch08.indd 242
2/9/07 11:18:37 AM
CHAPTER 8
243
Stock Valuation
Notice that we were given D0 ؍$2 here, so we had to grow it by 20 percent for one period
to get D1. Notice also that g1 is bigger than R in this problem, but that fact does not cause
a problem.
COMPONENTS OF THE REQUIRED RETURN
Thus far, we have taken the required return, or discount rate, R, as given. We will have
quite a bit to say about this subject in Chapters 12 and 13. For now, we want to examine the
implications of the dividend growth model for this required return. Earlier, we calculated
P0 as:
P0 ϭ D1͞(R Ϫ g)
If we rearrange this to solve for R, we get:
R Ϫ g ϭ D1͞P0
R ϭ D1͞P0 ϩ g
[8.7]
This tells us that the total return, R, has two components. The first of these, D1͞P0, is called
the dividend yield. Because this is calculated as the expected cash dividend divided by the
current price, it is conceptually similar to the current yield on a bond.
The second part of the total return is the growth rate, g. We know that the dividend
growth rate is also the rate at which the stock price grows (see Example 8.3). Thus, this
growth rate can be interpreted as the capital gains yield—that is, the rate at which the
value of the investment grows.2
To illustrate the components of the required return, suppose we observe a stock selling
for $20 per share. The next dividend will be $1 per share. You think that the dividend will
grow by 10 percent per year more or less indefinitely. What return does this stock offer if
this is correct?
The dividend growth model calculates total return as:
R ϭ Dividend yield ϩ Capital gains yield
Rϭ
D1͞P0
ϩ
g
dividend yield
A stock’s expected cash
dividend divided by its
current price.
capital gains yield
The dividend growth rate,
or the rate at which the
value of an investment
grows.
In this case, total return works out to be:
R ϭ $1͞20 ϩ 10%
ϭ 5% ϩ 10%
ϭ 15%
This stock, therefore, has an expected return of 15 percent.
We can verify this answer by calculating the price in one year, P1, using 15 percent as
the required return. Based on the dividend growth model, this price is:
P1 ϭ D1 ϫ (1 ϩ g)͞(R Ϫ g)
ϭ $1 ϫ 1.10͞(.15 Ϫ .10)
ϭ $1.10͞.05
ϭ $22
2
Here and elsewhere, we use the term capital gains a little loosely. For the record, a capital gain (or loss) is,
strictly speaking, something defined by the IRS. For our purposes, it would be more accurate (but less common)
to use the term price appreciation instead of capital gain.
ros3062x_Ch08.indd 243
2/9/07 11:18:38 AM
244
PA RT 3
Valuation of Future Cash Flows
Notice that this $22 is $20 ϫ 1.1, so the stock price has grown by 10 percent as it
should. If you pay $20 for the stock today, you will get a $1 dividend at the end of
the year, and you will have a $22 Ϫ 20 ϭ $2 gain. Your dividend yield is thus $1͞20 ϭ
5%. Your capital gains yield is $2͞20 ϭ 10%, so your total return would be 5% ϩ
10% ϭ 15%.
To get a feel for actual numbers in this context, consider that, according to the 2006
Value Line Investment Survey, Procter & Gamble’s dividends were expected to grow by
9 percent over the next 5 or so years, compared to a historical growth rate of 10 percent
over the preceding 5 years and 11.5 percent over the preceding 10 years. In 2006, the
projected dividend for the coming year was given as $1.35. The stock price at that time
was about $56 per share. What is the return investors require on P&G? Here, the dividend
yield is 2.4 percent and the capital gains yield is 9 percent, giving a total required return of
11.4 percent on P&G stock.
Our discussion of stock valuation is summarized in Table 8.1.
TABLE 8.1
I.
Summary of Stock
Valuation
The General Case
In general, the price today of a share of stock, P0, is the present value of all of its future dividends, D1, D2, D3, . . . :
D3
D1
D2
P0 ϭ ________
ϩ ________
ϩ ________
ϩ...
(1 ϩ R)1 (1 ϩ R)2 (1 ϩ R)3
where R is the required return.
II.
Constant Growth Case
If the dividend grows at a steady rate, g, then the price can be written as:
D1
P0 ϭ ______
RϪg
This result is called the dividend growth model.
III.
Nonconstant Growth
If the dividend grows steadily after t periods, then the price can be written as:
Dt
Pt
D1
D2
ϩ ________
ϩ . . . ϩ _______
ϩ _______
P0 ϭ ________
(1 ϩ R)t (1 ϩ R)t
(1 ϩ R)1 (1 ϩ R)2
where
Dt ϫ (1 ϩ g)
Pt ϭ ___________
(R Ϫ g)
IV.
Two-Stage Growth
If the dividend grows at rate g1 for t periods and then grows at rate g2 thereafter, then the price
can be written as:
΄
)΅
Pt
D1
1ϩg t
P0 ϭ _______
ϫ 1 Ϫ ______1 ϩ _______
R Ϫ g1
1ϩR
(1 ϩ R)t
(
where
D0 ϫ ( 1 ϩ g1 )t ϫ ( 1 ϩ g2 )
Dtϩ1
ϭ ______________________
Pt ϭ _______
R Ϫ g2
R Ϫ g2
V.
The Required Return
The required return, R, can be written as the sum of two things:
R ϭ D1͞P0 ϩ g
where D1͞P0 is the dividend yield and g is the capital gains yield (which is the same thing as
the growth rate in dividends for the steady growth case).
ros3062x_Ch08.indd 244
2/9/07 11:18:38 AM
CHAPTER 8
245
Stock Valuation
Concept Questions
8.1a What are the relevant cash flows for valuing a share of common stock?
8.1b Does the value of a share of stock depend on how long you expect to keep it?
8.1c What is the value of a share of stock when the dividend grows at a constant
rate?
Some Features of Common
and Preferred Stocks
8.2
In discussing common stock features, we focus on shareholder rights and dividend payments. For preferred stock, we explain what preferred means, and we also debate whether
preferred stock is really debt or equity.
COMMON STOCK FEATURES
The term common stock means different things to different people, but it is usually applied
to stock that has no special preference either in receiving dividends or in bankruptcy.
Shareholder Rights The conceptual structure of the corporation assumes that shareholders elect directors who, in turn, hire managers to carry out their directives. Shareholders, therefore, control the corporation through the right to elect the directors. Generally,
only shareholders have this right.
Directors are elected each year at an annual meeting. Although there are exceptions
(discussed next), the general idea is “one share, one vote” (not one shareholder, one vote).
Corporate democracy is thus very different from our political democracy. With corporate
democracy, the “golden rule” prevails absolutely.3
Directors are elected at an annual shareholders’ meeting by a vote of the holders of a
majority of shares who are present and entitled to vote. However, the exact mechanism
for electing directors differs across companies. The most important difference is whether
shares must be voted cumulatively or voted straight.
To illustrate the two different voting procedures, imagine that a corporation has two
shareholders: Smith with 20 shares and Jones with 80 shares. Both want to be a director.
Jones does not want Smith, however. We assume there are a total of four directors to be
elected.
The effect of cumulative voting is to permit minority participation.4 If cumulative voting is permitted, the total number of votes that each shareholder may cast is determined
first. This is usually calculated as the number of shares (owned or controlled) multiplied by
the number of directors to be elected.
With cumulative voting, the directors are elected all at once. In our example, this means
that the top four vote getters will be the new directors. A shareholder can distribute votes
however he or she wishes.
common stock
Equity without priority for
dividends or in bankruptcy.
cumulative voting
A procedure in which a
shareholder may cast all
votes for one member of
the board of directors.
3
The golden rule: Whosoever has the gold makes the rules.
4
By minority participation, we mean participation by shareholders with relatively small amounts of stock.
ros3062x_Ch08.indd 245
2/9/07 11:18:40 AM
246
PA RT 3
straight voting
A procedure in which a
shareholder may cast all
votes for each member of
the board of directors.
EXAMPLE 8.6
Valuation of Future Cash Flows
Will Smith get a seat on the board? If we ignore the possibility of a five-way tie, then
the answer is yes. Smith will cast 20 ϫ 4 ϭ 80 votes, and Jones will cast 80 ϫ 4 ϭ 320
votes. If Smith gives all his votes to himself, he is assured of a directorship. The reason is
that Jones can’t divide 320 votes among four candidates in such a way as to give all of them
more than 80 votes, so Smith will finish fourth at worst.
In general, if there are N directors up for election, then 1͞(N ϩ 1) percent of the stock
plus one share will guarantee you a seat. In our current example, this is 1͞(4 ϩ 1) ϭ 20%.
So the more seats that are up for election at one time, the easier (and cheaper) it is to
win one.
With straight voting, the directors are elected one at a time. Each time, Smith can cast
20 votes and Jones can cast 80. As a consequence, Jones will elect all of the candidates.
The only way to guarantee a seat is to own 50 percent plus one share. This also guarantees
that you will win every seat, so it’s really all or nothing.
Buying the Election
Stock in JRJ Corporation sells for $20 per share and features cumulative voting. There are
10,000 shares outstanding. If three directors are up for election, how much does it cost to
ensure yourself a seat on the board?
The question here is how many shares of stock it will take to get a seat. The answer
is 2,501, so the cost is 2,501 ؋ $20 ؍$50,020. Why 2,501? Because there is no way the
remaining 7,499 votes can be divided among three people to give all of them more than
2,501 votes. For example, suppose two people receive 2,502 votes and the first two seats.
A third person can receive at most 10,000 ؊ 2,502 ؊ 2,502 ؊ 2,501 ؍2,495, so the third
seat is yours.
As we’ve illustrated, straight voting can “freeze out” minority shareholders; that is why
many states have mandatory cumulative voting. In states where cumulative voting is mandatory, devices have been worked out to minimize its impact.
One such device is to stagger the voting for the board of directors. With staggered elections, only a fraction of the directorships are up for election at a particular time. Thus if
only two directors are up for election at any one time, it will take 1ր(2 ϩ 1) ϭ 33.33% of
the stock plus one share to guarantee a seat.
Overall, staggering has two basic effects:
1. Staggering makes it more difficult for a minority to elect a director when there is
cumulative voting because there are fewer directors to be elected at one time.
2. Staggering makes takeover attempts less likely to be successful because it makes it
more difficult to vote in a majority of new directors.
We should note that staggering may serve a beneficial purpose. It provides “institutional
memory”—that is, continuity on the board of directors. This may be important for corporations with significant long-range plans and projects.
proxy
A grant of authority by
a shareholder allowing
another individual to vote
his or her shares.
ros3062x_Ch08.indd 246
Proxy Voting A proxy is the grant of authority by a shareholder to someone else to vote
his or her shares. For convenience, much of the voting in large public corporations is actually done by proxy.
2/9/07 11:18:41 AM
CHAPTER 8
Stock Valuation
247
As we have seen, with straight voting, each share of stock has one vote. The owner of
10,000 shares has 10,000 votes. Large companies have hundreds of thousands or even millions of shareholders. Shareholders can come to the annual meeting and vote in person, or
they can transfer their right to vote to another party.
Obviously, management always tries to get as many proxies as possible transferred to it.
However, if shareholders are not satisfied with management, an “outside” group of shareholders can try to obtain votes via proxy. They can vote by proxy in an attempt to replace
management by electing enough directors. The resulting battle is called a proxy fight.
Classes of Stock Some firms have more than one class of common stock. Often the
classes are created with unequal voting rights. The Ford Motor Company, for example, has
Class B common stock, which is not publicly traded (it is held by Ford family interests and
trusts). This class has 40 percent of the voting power, even though it represents less than
10 percent of the total number of shares outstanding.
There are many other cases of corporations with different classes of stock. For example,
at one time, General Motors had its “GM Classic” shares (the original) and two additional
classes, Class E (“GME”) and Class H (“GMH”). These classes were created to help pay
for two large acquisitions, Electronic Data Systems and Hughes Aircraft. Another good
example is Google, the Web search company, which only recently became publicly owned.
Google has two classes of common stock, A and B. The Class A shares are held by the
public, and each share has one vote. The Class B shares are held by company insiders, and
each Class B share has 10 votes. As a result, Google’s founders and managers control the
company.
Historically, the New York Stock Exchange did not allow companies to create classes
of publicly traded common stock with unequal voting rights. Exceptions (like Ford) appear
to have been made. In addition, many non-NYSE companies have dual classes of common
stock.
A primary reason for creating dual or multiple classes of stock has to do with control
of the firm. If such stock exists, management of a firm can raise equity capital by issuing
nonvoting or limited-voting stock while maintaining control.
The subject of unequal voting rights is controversial in the United States, and the idea
of one share, one vote has a strong following and a long history. Interestingly, however,
shares with unequal voting rights are quite common in the United Kingdom and elsewhere
around the world.
Other Rights The value of a share of common stock in a corporation is directly related
to the general rights of shareholders. In addition to the right to vote for directors, shareholders usually have the following rights:
1. The right to share proportionally in dividends paid.
2. The right to share proportionally in assets remaining after liabilities have been paid in
a liquidation.
3. The right to vote on stockholder matters of great importance, such as a merger. Voting
is usually done at the annual meeting or a special meeting.
In addition, stockholders sometimes have the right to share proportionally in any new stock
sold. This is called the preemptive right.
Essentially, a preemptive right means that a company that wishes to sell stock must
first offer it to the existing stockholders before offering it to the general public. The purpose is to give stockholders the opportunity to protect their proportionate ownership in the
corporation.
ros3062x_Ch08.indd 247
2/9/07 11:18:42 AM
248
PA RT 3
dividends
Dividends A distinctive feature of corporations is that they have shares of stock on
which they are authorized by law to pay dividends to their shareholders. Dividends paid
to shareholders represent a return on the capital directly or indirectly contributed to the
corporation by the shareholders. The payment of dividends is at the discretion of the board
of directors.
Some important characteristics of dividends include the following:
Payments by a
corporation to
shareholders, made in
either cash or stock.
Valuation of Future Cash Flows
1. Unless a dividend is declared by the board of directors of a corporation, it is not a
liability of the corporation. A corporation cannot default on an undeclared dividend.
As a consequence, corporations cannot become bankrupt because of nonpayment of
dividends. The amount of the dividend and even whether it is paid are decisions based
on the business judgment of the board of directors.
2. The payment of dividends by the corporation is not a business expense. Dividends
are not deductible for corporate tax purposes. In short, dividends are paid out of the
corporation’s aftertax profits.
3. Dividends received by individual shareholders are for the most part considered ordinary income by the IRS and are fully taxable. However, corporations that own stock
in other corporations are permitted to exclude 70 percent of the dividend amounts they
receive and are taxed on only the remaining 30 percent.5
PREFERRED STOCK FEATURES
preferred stock
Stock with dividend priority
over common stock, normally with a fixed dividend
rate, sometimes without
voting rights.
Preferred stock differs from common stock because it has preference over common stock
in the payment of dividends and in the distribution of corporation assets in the event of
liquidation. Preference means only that the holders of the preferred shares must receive a
dividend (in the case of an ongoing firm) before holders of common shares are entitled to
anything.
Preferred stock is a form of equity from a legal and tax standpoint. It is important to
note, however, that holders of preferred stock sometimes have no voting privileges.
Stated Value Preferred shares have a stated liquidating value, usually $100 per share.
The cash dividend is described in terms of dollars per share. For example, General Motors
“$5 preferred” easily translates into a dividend yield of 5 percent of stated value.
Cumulative and Noncumulative Dividends A preferred dividend is not like interest
on a bond. The board of directors may decide not to pay the dividends on preferred shares,
and their decision may have nothing to do with the current net income of the corporation.
Dividends payable on preferred stock are either cumulative or noncumulative; most are
cumulative. If preferred dividends are cumulative and are not paid in a particular year, they
will be carried forward as an arrearage. Usually, both the accumulated (past) preferred
dividends and the current preferred dividends must be paid before the common shareholders can receive anything.
Unpaid preferred dividends are not debts of the firm. Directors elected by the common
shareholders can defer preferred dividends indefinitely. However, in such cases, common
shareholders must also forgo dividends. In addition, holders of preferred shares are often
5
For the record, the 70 percent exclusion applies when the recipient owns less than 20 percent of the outstanding stock in a corporation. If a corporation owns more than 20 percent but less than 80 percent, the exclusion
is 80 percent. If more than 80 percent is owned, the corporation can file a single “consolidated” return and the
exclusion is effectively 100 percent.
ros3062x_Ch08.indd 248
2/9/07 11:18:42 AM
CHAPTER 8
249
Stock Valuation
granted voting and other rights if preferred dividends have not been paid for some time.
For example, as of summer 1996, USAir had failed to pay dividends on one of its preferred
stock issues for six quarters. As a consequence, the holders of the shares were allowed to
nominate two people to represent their interests on the airline’s board. Because preferred
stockholders receive no interest on the accumulated dividends, some have argued that firms
have an incentive to delay paying preferred dividends; but, as we have seen, this may mean
sharing control with preferred stockholders.
Is Preferred Stock Really Debt? A good case can be made that preferred stock is really
debt in disguise, a kind of equity bond. Preferred shareholders receive a stated dividend
only; and if the corporation is liquidated, preferred shareholders get a stated value. Often,
preferred stocks carry credit ratings much like those of bonds. Furthermore, preferred stock
is sometimes convertible into common stock, and preferred stocks are often callable.
In addition, many issues of preferred stock have obligatory sinking funds. The existence of such a sinking fund effectively creates a final maturity because it means that the
entire issue will ultimately be retired. For these reasons, preferred stock seems to be a lot
like debt. However, for tax purposes, preferred dividends are treated like common stock
dividends.
In the 1990s, firms began to sell securities that looked a lot like preferred stocks but are
treated as debt for tax purposes. The new securities were given interesting acronyms like
TOPrS (trust-originated preferred securities, or toppers), MIPS (monthly income preferred
securities), and QUIPS (quarterly income preferred securities), among others. Because of
various specific features, these instruments can be counted as debt for tax purposes, making
the interest payments tax deductible. Payments made to investors in these instruments are
treated as interest for personal income taxes. Until 2003, interest payments and dividends
were taxed at the same marginal tax rate. When the tax rate on dividend payments was
reduced, these instruments were not included, so individuals must still pay their higher
income tax rate on dividend payments received from these instruments.
Concept Questions
8.2a What is a proxy?
8.2b What rights do stockholders have?
8.2c Why is preferred stock called preferred?
The Stock Markets
Back in Chapter 1, we briefly mentioned that shares of stock are bought and sold on various stock exchanges, the two most important of which are the New York Stock Exchange
and the NASDAQ. From our earlier discussion, recall that the stock market consists of a
primary market and a secondary market. In the primary, or new issue, market, shares of
stock are first brought to the market and sold to investors. In the secondary market, existing
shares are traded among investors.
In the primary market, companies sell securities to raise money. We will discuss this
process in detail in a later chapter. We therefore focus mainly on secondary market activity
in this section. We conclude with a discussion of how stock prices are quoted in the financial press.
ros3062x_Ch08.indd 249
8.3
primary market
The market in which new
securities are originally sold
to investors.
secondary market
The market in which previously issued securities are
traded among investors.
2/9/07 11:18:43 AM
250
PA RT 3
Valuation of Future Cash Flows
DEALERS AND BROKERS
dealer
An agent who buys and
sells securities from
inventory.
broker
An agent who arranges
security transactions
among investors.
How big is the
bid–ask spread on your
favorite stock? Check
out the latest quotes at
www.bloomberg.com.
Because most securities transactions involve dealers and brokers, it is important to
understand exactly what is meant by the terms dealer and broker. A dealer maintains an
inventory and stands ready to buy and sell at any time. In contrast, a broker brings buyers
and sellers together but does not maintain an inventory. Thus, when we speak of used car
dealers and real estate brokers, we recognize that the used car dealer maintains an inventory, whereas the real estate broker does not.
In the securities markets, a dealer stands ready to buy securities from investors wishing
to sell them and sell securities to investors wishing to buy them. Recall from our previous
chapter that the price the dealer is willing to pay is called the bid price. The price at which
the dealer will sell is called the ask price (sometimes called the asked, offered, or offering
price). The difference between the bid and ask prices is called the spread, and it is the basic
source of dealer profits.
Dealers exist in all areas of the economy, not just the stock markets. For example, your
local college bookstore is probably both a primary and a secondary market textbook dealer.
If you buy a new book, this is a primary market transaction. If you buy a used book, this is
a secondary market transaction, and you pay the store’s ask price. If you sell the book back,
you receive the store’s bid price (often half of the ask price). The bookstore’s spread is the
difference between the two prices.
In contrast, a securities broker arranges transactions between investors, matching investors wishing to buy securities with investors wishing to sell securities. The distinctive characteristic of security brokers is that they do not buy or sell securities for their own accounts.
Facilitating trades by others is their business.
ORGANIZATION OF THE NYSE
The New York Stock Exchange, or NYSE, popularly known as the Big Board, celebrated
its bicentennial a few years ago. It has occupied its current location on Wall Street since the
turn of the twentieth century. Measured in terms of dollar volume of activity and the total
value of shares listed, it is the largest stock market in the world.
member
As of 2006, a member
is the owner of a trading
license on the NYSE.
commission brokers
NYSE members who
execute customer orders to
buy and sell stock transmitted to the exchange floor.
specialist
A NYSE member acting as a dealer in a small
number of securities on the
exchange floor; often called
a market maker.
ros3062x_Ch08.indd 250
Members The NYSE has 1,366 exchange members. Prior to 2006, the exchange
members were said to own “seats” on the exchange, and collectively the members of the
exchange were also the owners. For this and other reasons, seats were valuable and were
bought and sold fairly regularly. Seat prices reached a record $4 million in 2005.
In 2006, all of this changed when the NYSE became a publicly owned corporation
called NYSE Group, Inc. Naturally, its stock is listed on the NYSE. Now, instead of purchasing seats, exchange members must purchase trading licenses, the number of which
is still limited to 1,366. In 2006, a license would set you back a cool $54,000—per year.
Having a license entitles you to buy and sell securities on the floor of the exchange.
Different members play different roles in this regard.
The largest number of NYSE members are registered as commission brokers. The
business of a commission broker is to execute customer orders to buy and sell stocks. A
commission broker’s primary responsibility to customers is to get the best possible prices
for their orders. The exact number varies, but, usually about 500 NYSE members are commission brokers. NYSE commission brokers typically are employees of brokerage companies such as Merrill Lynch.
Second in number of NYSE members are specialists, so named because each of them
acts as an assigned dealer for a small set of securities. With a few exceptions, each security
listed for trading on the NYSE is assigned to a single specialist. Specialists are also called
2/9/07 11:18:44 AM
CHAPTER 8
market makers because they are obligated to maintain a fair, orderly market for the securities assigned to them.
Specialists post bid prices and ask prices for securities assigned to them. Specialists
make a market by standing ready to buy at bid prices and sell at asked prices when there is
a temporary disparity between the flow of buy orders and that of sell orders for a security.
In this capacity, they act as dealers for their own accounts.
Third in number of exchange members are floor brokers. Floor brokers are used by
commission brokers who are too busy to handle certain orders themselves. Such commission brokers will delegate some orders to floor brokers for execution. Floor brokers are
sometimes called $2 brokers, a name earned when the standard fee for their service was
only $2.
In recent years, floor brokers have become less important on the exchange floor because
of the efficient SuperDOT system (the DOT stands for Designated Order Turnaround),
which allows orders to be transmitted electronically directly to the specialist. SuperDOT
trading now accounts for a substantial percentage of all trading on the NYSE, particularly
on smaller orders.
Finally, a small number of NYSE members are floor traders who independently trade
for their own accounts. Floor traders try to anticipate temporary price fluctuations and
profit from them by buying low and selling high. In recent decades, the number of floor
traders has declined substantially, suggesting that it has become increasingly difficult to
profit from short-term trading on the exchange floor.
Operations Now that we have a basic idea of how the NYSE is organized and who the
major players are, we turn to the question of how trading actually takes place. Fundamentally, the business of the NYSE is to attract and process order flow. The term order flow
means the flow of customer orders to buy and sell stocks. The customers of the NYSE are
the millions of individual investors and tens of thousands of institutional investors who
place their orders to buy and sell shares in NYSE-listed companies. The NYSE has been
quite successful in attracting order flow. Currently, it is not unusual for well over a billion
shares to change hands in a single day.
Floor Activity It is quite likely that you have seen footage of the NYSE trading floor on
television, or you may have visited the NYSE and viewed exchange floor activity from the
visitors’ gallery (it’s worth the trip). Either way, you would have seen a big room, about the
size of a basketball gym. This big room is called, technically, “the Big Room.” There are a
few other, smaller rooms that you normally don’t see, one of which is called “the Garage”
because that is what it was before it was taken over for trading.
On the floor of the exchange are a number of stations, each with a roughly figure-eight
shape. These stations have multiple counters with numerous terminal screens above and on the
sides. People operate behind and in front of the counters in relatively stationary positions.
Other people move around on the exchange floor, frequently returning to the many
telephones positioned along the exchange walls. In all, you may be reminded of worker
ants moving around an ant colony. It is natural to wonder, “What are all those people doing
down there (and why are so many wearing funny-looking coats)?”
As an overview of exchange floor activity, here is a quick look at what goes on. Each
of the counters at a figure-eight–shaped station is a specialist’s post. Specialists normally
operate in front of their posts to monitor and manage trading in the stocks assigned to them.
Clerical employees working for the specialists operate behind the counter. Moving from
the many telephones lining the walls of the exchange out to the exchange floor and back
again are swarms of commission brokers, receiving telephoned customer orders, walking
ros3062x_Ch08.indd 251
251
Stock Valuation
floor brokers
NYSE members who
execute orders for commission brokers on a fee
basis; sometimes called
$2 brokers.
SuperDOT system
An electronic NYSE system
allowing orders to be
transmitted directly to the
specialist.
floor traders
NYSE members who trade
for their own accounts, trying to anticipate temporary
price fluctuations.
order flow
The flow of customer
orders to buy and sell securities.
Take a virtual
field trip to the New
York Stock Exchange at
www.nyse.com.
specialist’s post
A fixed place on the
exchange floor where the
specialist operates.
2/9/07 11:18:44 AM
252
PA RT 3
Valuation of Future Cash Flows
out to specialists’ posts where the orders can be executed, and returning to confirm order
executions and receive new customer orders.
To better understand activity on the NYSE trading floor, imagine yourself as a commission broker. Your phone clerk has just handed you an order to sell 20,000 shares of WalMart for a customer of the brokerage company that employs you. The customer wants to
sell the stock at the best possible price as soon as possible. You immediately walk (running
violates exchange rules) to the specialist’s post where Wal-Mart stock is traded.
As you approach the specialist’s post where Wal-Mart is traded, you check the terminal
screen for information on the current market price. The screen reveals that the last executed
trade was at 60.10 and that the specialist is bidding 60 per share. You could immediately
sell to the specialist at 60, but that would be too easy.
Instead, as the customer’s representative, you are obligated to get the best possible price.
It is your job to “work” the order, and your job depends on providing satisfactory order
execution service. So, you look around for another broker who represents a customer who
wants to buy Wal-Mart stock. Luckily, you quickly find another broker at the specialist’s
post with an order to buy 20,000 shares. Noticing that the specialist is asking 60.10 per
share, you both agree to execute your orders with each other at a price of 60.05. This price
is exactly halfway between the specialist’s bid and ask prices, and it saves each of your
customers .05 ϫ 20,000 ϭ $1,000 as compared to dealing at the posted prices.
For a very actively traded stock, there may be many buyers and sellers around the specialist’s post, and most of the trading will be done directly between brokers. This is called
trading in the “crowd.” In such cases, the specialist’s responsibility is to maintain order and
to make sure that all buyers and sellers receive a fair price. In other words, the specialist
essentially functions as a referee.
More often, however, there will be no crowd at the specialist’s post. Going back to our
Wal-Mart example, suppose you are unable to quickly find another broker with an order to
buy 20,000 shares. Because you have an order to sell immediately, you may have no choice
but to sell to the specialist at the bid price of 60. In this case, the need to execute an order
quickly takes priority, and the specialist provides the liquidity necessary to allow immediate order execution.
Finally, note that colored coats are worn by many of the people on the floor of the
exchange. The color of the coat indicates the person’s job or position. Clerks, runners,
visitors, exchange officials, and so on wear particular colors to identify themselves. Also,
things can get a little hectic on a busy day, with the result that good clothing doesn’t last
long; the cheap coats offer some protection.
NASDAQ OPERATIONS
In terms of total dollar volume of trading, the second largest stock market in the United
States is NASDAQ (say “Naz-dak”). The somewhat odd name originally was an acronym for the National Association of Securities Dealers Automated Quotations system, but
NASDAQ is now a name in its own right.
Introduced in 1971, the NASDAQ market is a computer network of securities dealers
and others that disseminates timely security price quotes to computer screens worldwide.
NASDAQ dealers act as market makers for securities listed on NASDAQ. As market makers, NASDAQ dealers post bid and ask prices at which they accept sell and buy orders,
respectively. With each price quote, they also post the number of stock shares that they
obligate themselves to trade at their quoted prices.
Like NYSE specialists, NASDAQ market makers trade on an inventory basis—that is,
using their inventory as a buffer to absorb buy and sell order imbalances. Unlike the NYSE
ros3062x_Ch08.indd 252
2/9/07 11:18:45 AM
CHAPTER 8
253
Stock Valuation
specialist system, NASDAQ features multiple market makers for actively traded stocks.
Thus, there are two key differences between the NYSE and NASDAQ:
1. NASDAQ is a computer network and has no physical location where trading takes place.
2. NASDAQ has a multiple market maker system rather than a specialist system.
Traditionally, a securities market largely characterized by dealers who buy and sell
securities for their own inventories is called an over-the-counter (OTC) market. Consequently, NASDAQ is often referred to as an OTC market. However, in their efforts to
promote a distinct image, NASDAQ officials prefer that the term OTC not be used when
referring to the NASDAQ market. Nevertheless, old habits die hard, and many people still
refer to NASDAQ as an OTC market.
By 2006, the NASDAQ had grown to the point that it was, by some measures, bigger than the NYSE. For example, on May 10, 2006, 2.0 billion shares were traded on the
NASDAQ versus 1.6 billion on the NYSE. In dollars, NASDAQ trading volume for the
day was $48.8 billion compared to $64.5 billion for the NYSE.
The NASDAQ is actually made up of two separate markets: the NASDAQ National
Market (NNM) and the NASDAQ Capital Market. As the market for NASDAQ’s larger and
more actively traded securities, the NASDAQ National Market lists about 3,200 companies,
including some of the best-known companies in the world. The NASDAQ Capital Market
is for small companies and lists about 700 individual companies. As you might guess, an
important difference between the two markets is that the National Market has more stringent listing requirements. Of course, as Capital Market companies become more established, they may move up to the National Market.
NASDAQ Participants As we mentioned previously, the NASDAQ has historically
been a dealer market, characterized by competing market makers. Typically there have
been about a dozen or so per stock. The biggest market makers cover thousands of stocks.
In a very important development, in the late 1990s, the NASDAQ system was opened
to so-called electronic communications networks (ECNs). ECNs are basically Web sites
that allow investors to trade directly with one another. Our nearby Work the Web box
describes one of the biggest ECNs, INET (www.island.com), and contains important information about ECN “order books.” Be sure to read it.
Investor buy and sell orders placed on ECNs are transmitted to the NASDAQ and displayed along with market maker bid and ask prices. As a result, the ECNs open up the
NASDAQ by essentially allowing individual investors to enter orders, not just market
makers. Thus, the ECNs increase liquidity and competition.
If you check prices on the Web for both NASDAQ- and NYSE-listed stocks, you’ll
notice an interesting difference. For NASDAQ issues, you can actually see the bid and ask
prices as well as recent transaction information. The bid and ask prices for the NASDAQ
listings represent the inside quotes: the highest bid and the lowest ask prices. For a relatively small fee (or possibly free from your broker), you can even have access to “Level II”
quotes, which show all of the posted bid and ask prices and frequently the identity of the
market maker. Of course, NYSE specialists post bid and ask prices as well; they are just
not disclosed to the general public (they are available by subscription at a cost substantially
higher than that for Level II NASDAQ quotes).
The success of the NASDAQ National Market as a competitor to the NYSE and other
organized exchanges can be judged by its ability to attract stock listings by companies that
traditionally might have chosen to be listed on the NYSE. Such well-known companies
as Microsoft, Apple Computer, Intel, Dell, Yahoo!, and Starbucks list their securities on
NASDAQ.
ros3062x_Ch08.indd 253
over-the-counter
(OTC) market
Securities market in which
trading is almost exclusively
done through dealers who
buy and sell for their own
inventories.
NASDAQ (www.
nasdaq.com) has a great
Web site; check it out!
electronic
communications
network (ECN)
A Web site that allows
investors to trade directly
with each other.
inside quotes
The highest bid quotes and
lowest ask quotes offered
by dealers for a security.
2/9/07 11:18:45 AM
254
PA RT 3
Valuation of Future Cash Flows
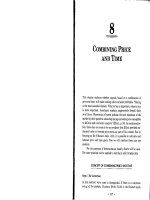
WORK THE WEB
You can actually watch trading take place on the Web by
visiting one of the biggest ECNs, INE T (www.island.com),
formerly called Island. INE T is somewhat unique in that the
“order book,” meaning the list of buy and sell orders, is
public in real time.
As shown, we have captured a sample order book for
Johnson & Johnson. On the left are the buy orders (bids);
sell orders (asks) are on the right. All orders are “limit”
orders, which means the customer has specified the most
she will pay (for buy orders) or the least she will accept
(for sell orders). The inside quotes (the highest bid, or buy,
and the lowest ask, or sell) in this market are the ones at
the top, so we sometimes hear the expression “top of the
book” quotes.
If you visit this site, you can see trading take place
as orders are entered and executed. Notice that on this
particular day, by about 2:00 PM, INE T had traded about
480,000 shares of Johnson & Johnson. At that time, the
inside quotes for Johnson & Johnson were 2,800 shares
bid at $58.90 and a total of 576 shares offered at $58.92.
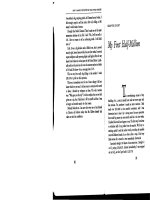
STOCK MARKET REPORTING
If you look through the pages of The Wall Street Journal (or another financial newspaper), you will find information on a large number of stocks in several different markets.
Figure 8.2 reproduces a small section of the stock page for the New York Stock Exchange
from June 30, 2006. Information on most NASDAQ issues is reported in the same way. In
Figure 8.2, locate the line for motorcycle maker Harley-Davidson (HarleyDav). With the
column headings, the line reads:
52 WEEK
HI
LO
55.93
44.40
STOCK (DIV)
YLD
%
PE
VOL
100s
CLOSE
NET
CHG
HarleyDav .84f
1.5
16
24726
54.25
1.18
The first two numbers, 55.93 and 44.40, are the highest and lowest prices for the stock
over the past 52 weeks. The .84 is the annual dividend in dollars. Because Harley, like most
ros3062x_Ch08.indd 254
2/9/07 11:18:46 AM
CHAPTER 8
255
Stock Valuation
FIGURE 8.2
NEW YORK STOCK EXCHANGE COMPOSITE TRANSACTIONS
Sample Stock Quotation
from The Wall Street
Journal
SOURCE: Reprinted by permission of The Wall Street Jour nal, June 30, 2006. Reprinted by permission of Dow Jones
& Company, Inc. via Copyright Clearance Center, Inc. © 2006 Dow Jones & Company, Inc. All Rights Reserved
Worldwide.
companies, pays dividends quarterly, this $.84 is actually the latest quarterly dividend multiplied by 4. So, the cash dividend paid was $.84ր4 ϭ $.21, or 21 cents per share. The small f following the .84 indicates a footnote, which in this case tells us the dividend was just increased.
Jumping ahead just a bit, “CLOSE” is the closing price of the day (the last price at which
a trade took place before the NYSE closed for the day). The “NET CHG” of 1.18 tells us
that the closing price of $54.25 is $1.18 higher than it was the day before; so, we say that
Harley was up 1.18 for the day.
ros3062x_Ch08.indd 255
You can get
real-time stock quotes
on the Web. See finance.
yahoo.com for details.
2/9/07 3:22:39 PM
256
PA RT 3
Valuation of Future Cash Flows
The column marked “YLD %” gives the dividend yield based on the current dividend
and the closing price. For Harley, this is $.84͞54.25 ϭ .015, or about 1.5 percent, the
number shown. The next column, labeled “PE,” is the price–earnings ratio we discussed in
Chapter 3. It is calculated as the closing price divided by annual earnings per share (based
on the most recent four quarters). In the jargon of Wall Street, we might say that Harley
“sells for 16 times earnings.”
Finally, the column marked “VOL 100s” tells us how many shares traded during the day (in
hundreds). For example, the 24726 for Harley tells us that 2,472,600, or close to 2.5 million
shares, changed hands on this day alone. If the average price during the day was $55 or so, then
the dollar volume of transactions was on the order of $55 ϫ 2.5 million ϭ $135 million worth
for Harley alone. This was a fairly routine day of trading in Harley shares, so this amount is
not unusual and serves to illustrate how active the market can be for well-known companies.
If you look over Figure 8.2, you will notice quite a few other footnote indicators (small
letters) and special symbols. To learn more about these, pick up any Wall Street Journal
and consult the stock pages.
Visit us at www.mhhe.com/rwj
Concept Questions
8.3a What is the difference between a securities broker and a securities dealer?
8.3b Which is bigger, the bid price or the ask price? Why?
8.3c What are the four types of members of the New York Stock Exchange (NYSE)?
8.3d How does NASDAQ differ from the NYSE?
8.4
Summary and Conclusions
This chapter has covered the basics of stocks and stock valuation:
1. The cash flows from owning a share of stock come in the form of future dividends. We
saw that in certain special cases it is possible to calculate the present value of all the
future dividends and thus come up with a value for the stock.
2. As the owner of shares of common stock in a corporation, you have various rights, including the right to vote to elect corporate directors. Voting in corporate elections can be either
cumulative or straight. Most voting is actually done by proxy, and a proxy battle breaks
out when competing sides try to gain enough votes to elect their candidates for the board.
3. In addition to common stock, some corporations have issued preferred stock. The
name stems from the fact that preferred stockholders must be paid first, before
common stockholders can receive anything. Preferred stock has a fixed dividend.
4. The two biggest stock markets in the United States are the NYSE and NASDAQ. We
discussed the organization and operation of these two markets, and we saw how stock
price information is reported in the financial press.
This chapter completes Part 3 of our book. By now, you should have a good grasp of what
we mean by present value. You should also be familiar with how to calculate present values, loan payments, and so on. In Part 4, we cover capital budgeting decisions. As you will
see, the techniques you learned in Chapters 5–8 form the basis for our approach to evaluating business investment decisions.
ros3062x_Ch08.indd 256
2/9/07 11:18:56 AM
CHAPTER 8
Stock Valuation
257
CHAPTER REVIEW AND SELF-TEST PROBLEMS
8.1
8.2
Dividend Growth and Stock Valuation The Brigapenski Co. has just paid a cash
dividend of $2 per share. Investors require a 16 percent return from investments
such as this. If the dividend is expected to grow at a steady 8 percent per year, what
is the current value of the stock? What will the stock be worth in five years?
More Dividend Growth and Stock Valuation In Self-Test Problem 8.1, what
would the stock sell for today if the dividend was expected to grow at 20 percent
per year for the next three years and then settle down to 8 percent per year,
indefinitely?
ANSWERS TO CHAPTER REVIEW AND SELF-TEST PROBLEMS
The last dividend, D0, was $2. The dividend is expected to grow steadily at
8 percent. The required return is 16 percent. Based on the dividend growth model,
we can say that the current price is:
P0 ϭ D1͞(R Ϫ g) ϭ D0 ϫ (1 ϩ g)͞(R Ϫ g)
ϭ $2 ϫ 1.08͞(.16 Ϫ .08)
ϭ $2.16͞.08
ϭ $27
We could calculate the price in five years by calculating the dividend in five
years and then using the growth model again. Alternatively, we could recognize
that the stock price will increase by 8 percent per year and calculate the future price
directly. We’ll do both. First, the dividend in five years will be:
D5 ϭ D0 ϫ (1 ϩ g)5
ϭ $2 ϫ 1.085
ϭ $2.9387
The price in five years would therefore be:
P5 ϭ D5 ϫ (1 ϩ g)͞(R Ϫ g)
ϭ $2.9387 ϫ 1.08͞.08
ϭ $3.1738ր.08
ϭ $39.67
Visit us at www.mhhe.com/rwj
8.1
Once we understand the dividend model, however, it’s easier to notice that:
P5 ϭ P0 ϫ (1 ϩ g)5
ϭ $27 ϫ 1.085
ϭ $27 ϫ 1.4693
ϭ $39.67
8.2
ros3062x_Ch08.indd 257
Notice that both approaches yield the same price in five years.
In this scenario, we have supernormal growth for the next three years. We’ll need
to calculate the dividends during the rapid growth period and the stock price in
three years. The dividends are:
D1 ϭ $2.00 ϫ 1.20 ϭ $2.400
D2 ϭ $2.40 ϫ 1.20 ϭ $2.880
D3 ϭ $2.88 ϫ 1.20 ϭ $3.456
2/9/07 11:18:57 AM
258
PA RT 3
Valuation of Future Case
Cash Flows
After three years, the growth rate falls to 8 percent indefinitely. The price at that
time, P3, is thus:
P3 ϭ D3 ϫ (1 ϩ g)͞(R Ϫ g)
ϭ $3.456 ϫ 1.08͞(.16 Ϫ .08)
ϭ $3.7325͞.08
ϭ $46.656
Visit us at www.mhhe.com/rwj
To complete the calculation of the stock’s present value, we have to determine the
present value of the three dividends and the future price:
D3
P3
D1
D2
P0 ϭ _______
ϩ _______
ϩ _______
ϩ _______
1
2
3
(1 ϩ R)
(1 ϩ R)
(1 ϩ R)
(1 ϩ R)3
$2.40
3.456 ϩ ______
46.656
2.88 ϩ _____
ϭ _____ ϩ _____
1.16
1.162 1.163
1.163
ϭ $2.07 ϩ 2.14 ϩ 2.21 ϩ 29.89
ϭ $36.31
CONCEPTS REVIEW AND CRITICAL THINKING QUESTIONS
1.
2.
3.
4.
5.
6.
7.
8.
9.
10.
11.
12.
ros3062x_Ch08.indd 258
Stock Valuation Why does the value of a share of stock depend on dividends?
Stock Valuation A substantial percentage of the companies listed on the NYSE
and NASDAQ don’t pay dividends, but investors are nonetheless willing to buy
shares in them. How is this possible given your answer to the previous question?
Dividend Policy Referring to the previous questions, under what circumstances
might a company choose not to pay dividends?
Dividend Growth Model Under what two assumptions can we use the dividend
growth model presented in the chapter to determine the value of a share of stock?
Comment on the reasonableness of these assumptions.
Common versus Preferred Stock Suppose a company has a preferred stock issue
and a common stock issue. Both have just paid a $2 dividend. Which do you think
will have a higher price, a share of the preferred or a share of the common?
Dividend Growth Model Based on the dividend growth model, what are the two components of the total return on a share of stock? Which do you think is typically larger?
Growth Rate In the context of the dividend growth model, is it true that the
growth rate in dividends and the growth rate in the price of the stock are identical?
Voting Rights When it comes to voting in elections, what are the differences
between U.S. political democracy and U.S. corporate democracy?
Corporate Ethics Is it unfair or unethical for corporations to create classes of
stock with unequal voting rights?
Voting Rights Some companies, such as Reader’s Digest, have created classes of
stock with no voting rights at all. Why would investors buy such stock?
Stock Valuation Evaluate the following statement: Managers should not focus on
the current stock value because doing so will lead to an overemphasis on short-term
profits at the expense of long-term profits.
Two-Stage Dividend Growth Model One of the assumptions of the two-stage
growth model is that the dividends drop immediately from the high growth rate to
the perpetual growth rate. What do you think about this assumption? What happens
if this assumption is violated?
2/9/07 11:18:58 AM