Beginners Guide to SAS STATA software
Bạn đang xem bản rút gọn của tài liệu. Xem và tải ngay bản đầy đủ của tài liệu tại đây (431.23 KB, 42 trang )
Department of Agricultural & Applied Economics
Beginners Guide to
SAS & STATA software
Developed by Vahé Heboyan
Supervised by Dr. Tim Park
Introduction
The purpose of this Guide is to assist new students in MS and PhD programs at the
Department of Agricultural & Applied Economics at UGA to get started with SAS and
STATA software. The guide will help beginning users to quickly get started with their
econometrics and statistics classes.
This guide is not designed to be a substitute to any other official guide or tutorial, but
serve as a starting point in using SAS and STATA software. At the end of this guide,
several links to the official and unofficial sources for advanced use and more information
will be provided.
This guide is based on the so-called pre-programmed canned procedures.
Using built-in help
Both SAS and STATA have build-in help features that provide comprehensive coverage
of how to use the software and syntaxes (command codes).
•
In SAS: go to HELP
•
In STATA: go to HELP and use first three options for contents, keyword search
and STATA command search, respectively.
Books and Training
SAS Online Tutor
1
SAS Tutorial
1. Working with data
a. Reading data into SAS
The most convenient way to read data into SAS for further analysis is to
convert your original data file into Excel 97 or 2000. Make sure there are
no multiple sheets in the file. Usually default Excel has three sheets, make
sure you remove the last two. To read excel file (or other format) into SAS
library, follow the path below. For your own convenience, include the
names of the variables in the first row of your excel file. SAS will
automatically read those as variables names, which you can use to
construct command codes. For example if one of the variables if the price
of a commodity, then you may chose to name it as P or price.
File Import Data choose data format (default is Excel) Next
browse for the file Next create a name for your new file under
Member (make sure to keep the same WORK folder unchanged) Next
you may skip this step and click on Finish.
On the left hand side of the SAS window there is a vertical sub-window
called Explorer and the default shows two directories: Libraries and File
Shortcuts. Double click on the Libraries, then Work folder and locate your
data file. Double click on it to view your loaded data. It should open in a
new window and have the following name – VIEWTABLE: WORK.name
of your file .
Remember that when you activate the SAS program. It opens there
additional sub-windows that have the following function/use:
•
•
•
EDITOR – for inputting your command codes;
LOG
– to see the errors if any in your code after execution;
OUTPUT – to view the output after successful execution of your
code.
After you load your data into SAS you can use the following command to
read it into the Editor window. Throughout this manual, the data file will
have the name test unless otherwise specified.
data test;
Reminder! Do not forget to put semicolons at the end! Now you may
move on with your analysis!
Warning: Some users have encountered problems when they close
VIEWTABLE window, i.e. the data file disappears. You may load it
again, or simply leave the window open.
2
b. Creating the so-called ‘do-files’
You input your program in the default sub-window called EDITOR. You
may choose to save it for future use or editing. After you type the
commands or the first line of it, simply go to File Save As… give a
new name and choose the directory. Anytime you need to use the
command, just call it from the same directory and it will open with the
information you saved the last. Remember to save your program before
you close the SAS or that particular editing sub-window.
Note: after you save it, the EDITOR sub-window will take a new name
based on the name you choose.
c. Examining the data
In SAS you can view your data as well as its summary statistics. For the
beginners, this is a good point to start with, as it gives you the opportunity
to see how SAS reads your data and also examine them.
To print your data on the Output menu, type the following:
data test;
proc print;
run;
* indicates the data file to be used ;
* prints data found in the “test” file ;
* runs and executes the program ;
After you type these commands, click on the “running man” icon
to
execute your commands (located on the top row of the SAS window). You
can view the results in the Output window.
Hints: Always finish your command program with “run;” and place the
cursor after it before you execute the command. You can always comment
the command lines by placing the text between star(*) and a semicolon(;)
as seen in the command above (in SAS the comments are automatically
turned into green and the executable command codes into blue).
To view summary statistics, use the command below. It will display the
mean, standard deviation, min and maxima of your data.
data test;
proc means;
run;
You may customize data examination by using descriptive
statistics options that are specified after the PROC MEANS
statement. An example is provided below:
data test;
proc means max min;
* generates max and min values of ;
* the dataset ;
run;
3
The table below lists descriptive statistics options available in SAS.
Option
CLM
CSS
CV
KURTOSIS
LCLM
MAX
MEAN
MIN
N
NMISS
RANGE
SKEWNESS
STDDEV / STD
STDERR
SUM
SUMWGT
UCLM
USS
VAR
Description
Two-sided confidence limit for the mean
Corrected sum of squares
Coefficient of variation
Kurtosis
One-sided confidence limit below the mean
Maximum value
Average
Minimun value
Number of observations with nonmissing
values
Number of observations with missing values
Range
Skewness
Standard Deviation
Standard error of the mean
Sum
Sum of the Weight variable values.
One-sided confidence limit above the mean
Uncorrected sum of squares
Variance
The following PROC statements in SAS assist in further exploration of
your data. They are used in the same manner as the PROC statements
discussed above (i.e. PROC PRINT and PROC MEANS).
Statements
Description
proc contents
proc print
proc means
proc univariate
proc boxplot
proc freq
proc chart
proc corr
Contents of a SAS dataset
Displays the data
Descriptive statistics
More descriptive statistics
Boxplots
Frequency tables and crosstabs
ASCII histogram
Correlation matrix
d. Sorting data
One can easily sort raw data in SAS using the PROC SORT statement.
The default sorts in ascending order. You may also customize such that it
sorts in descending order. The command below will sort your data by the
values of the variable p.
4
proc sort data=test;
by descending p;
run;
* starts PROC SORT statement ;
* specifies the order & variable ;
* executes the code ;
e. Creating new variables
Using your initial data set you can create new variables in SAS. For
example if you want to transform your original data into logarithmical
form, the code below may be used. Assume that in your original data set
you had three variables (variable names in the file are provided in the
parenthesis):
a) Quantity (q);
b) Price (p); and
c) Exchange rate (ex);
data test2;
*
*
set test;
*
lnq=log(q); *
lnp=log(p); *
lnex=log(ex); *
proc print; *
run;
indicates the new file to be created...;
with the new variable(s);
indicates the file where original data are ;
specifies the new variable lnq ;
specifies the new variable lnp ;
specifies the new variable lnex ;
prints the new data file ;
The code above prints the original variables as well as the newly created
ones. If you want to print only the new ones and delete the old ones, use
the command below.
data test2;
*
*
set test;
*
lnq=log(q); *
lnp=log(p); *
lnex=log(ex); *
drop q p ex; *
proc print; *
*
run;
indicates the new file to be created...;
with the new variable(s);
indicates the file where original data are ;
specifies the new variable lnq ;
specifies the new variable lnp ;
specifies the new variable lnex ;
drops (deletes the old data)
prints the new data file with new variables;
only;
When creating new variables you can use the basic mathematical
expressions, such as multiplying (*), dividing (/), subtracting (-), adding
(+), exponentiation (**), etc.
Remember: the name of the new data file cannot be the same as the
original one.
f. Creating dummies
Dummy variables are commonly used to specify qualitative characteristics
of some variables such as gender, race, and geographical location. For
example, when gender of the consumer/respondent is introduced into a
5
model, one may assign female consumers value of 1 (one) and 0 (zero) to
the male consumers. Dummies may also be used to separate a variables in
the original dataset based on a pre-defined formula. See more on dummy
variables in your Econometrics textbook.
Assume we have a data set called consumer.xls which contains data on
respondents’ consumption of cheese (q), cheese price (p), household
annual income (inc), respondent’s age (age), and gender (sex). In the
original data set gender is coded as ‘m’ for male and ‘f’ for female. Age is
coded according to the actual age.
In order to incorporate the gender variable (sex) into the model we need to
assign it a numeric value. SAS will not be able to use original gander data
for analysis (i.e. it will not accept ‘m’ and ‘f’ as values for gender
variable).
Now we need to create a dummy variable for gender variable.
Additionally, we may want to group the respondents in 2 groups according
to their age; i.e. one group will include young consumers (up to 25 years
of age) and older consumers (25 and above). The code below will helps to
make the changes and prepare data for further analysis.
data consumer;
proc print;
* read original data ;
* print on screen to view data;
data consumer_2;
set consumer;
* name the new data-file ;
* indicates the file with original data ;
if sex = "m" then d1 = 1;
ELSE d1 = 0;
* define gender dummy ;
if age > 25 then d2 = 1;
ELSE d2 = 0;
* define age group dummy ;
proc print;
run;
* print on screen to view data ;
* execute the program ;
Note: d1 and d2 are the news for newly created dummy variables. You
may name them as you wish.
2. Estimation
This section introduces to the Ordinary Least Squares (OLS) estimation, model
diagnostics, hypothesis testing, confidence intervals, etc.
a. Linear regression
SAS PROC procedure lets to do OLS estimation using a simple command
instead of writing down the entire program. The PROC REG procedure
incorporates the entire command that is necessary for OLS estimation.
6
To estimate a regression model using OLS procedure, use the following
command below.
proc reg data=test;
* starts OLS & specifies the data;
model q = p t;
* specifies the model to be estimated;
run;
When specifying the model, after the keyword MODEL, the dependent
variable is specified, followed by an equal sign and the regressor
variables. Variables specified here must be only numeric. If you want to
specify a quadratic term for variable p in the model, you cannot use p*p in
the MODEL statement but must create new variable (for example,
psq=p*p) in the DATA step discussed above.
The PROC REG and MODEL statements do the basic OLS regression.
One may use various options available in SAS to customize the regression.
For example, if one needs to display residual values after the regression is
complete, one may use the option commands to do so. A sample list of
options available in SAS are listed in the table below. Check the SAS
online help for more options. Options are specified in the following way:
proc reg data=test;
model q = p t / option ;
run;
NOTE: The default level of significance in SAS is set at 95%. To change it
use the appropriate option that is listed in the table below.
Option
Description
These options are set after the PROC REG statement with just a space
between them. For example proc reg option;
ALPHA = number Sets the significance level used for construction of
confidence intervals. The value must be between 0
and 1. The default value of 0.05 results in 95%
intervals.
CORR
Displays the correlation matrix for all variables
listed in the MODEL statement.
DATA=datafile
Names the SAS data set to be used by PROC REG.
SIMPLE
Displays the sum, mean, variance, standard
deviation, and uncorrelated sum of squares for
each variable used in PROC REG.
NOTE: this option is used with the PROC REG
statement only. Will not work with the MODEL
statement. Example:
data test;
proc reg simple;
model q = p t;
run;
7
The table below lists the options available for MODEL statement.
Option
Description
These options are specified in the MODEL statement after a slash ( / ).
For example, model q = p t / option;
NOINT
Fits a model without the intercept term
ADJRSQ
Computes adjusted R2
ACOV
Displays asymptotic covariance matrix of
estimates assuming heteroscedasticity
COLLIN
Produces collinearity analysis
COLLINOINT
Produces collinearity analysis with intercept
adjusted out
COVB
Displays covariance matrix of estimates
CORRB
Displays correlation matrix of estimates
CLB
Computes 100(1- )% confidence limits for
the parameter estimates
CLI
Computes 100(1- )% confidence limits for an
individual predicted value
CLM
Computes 100(1- )% confidence limits for
expected value of the dependent variable
DW
Computes a Durbin-Watson statistic
P
Computes predicted values
ALL
Requests the following options: ACOV, CLB,
CLI, CLM, CORRB, COVB, I, P, PCORR1,
PCORR2, R, SCORR1, SCORR2, SEQB,
SPEC, SS1, SS@, STB, TOL, VIF, XPX. For
the options not discussed here, see SAS online
help.
ALPHA = number
Sets the significance level used for
construction of confidence and prediction
intervals and tests. The value must be
between 0 and 1. The default value of 0.05
results in 95% intervals.
NOPRINT
Suppresses display of results
SINGULAR=
Sets criterion for checking for singularity
b. Testing for Collinearity
The COLLIN option performs collinearity diagnostics among regressors.
This includes eigenvalues, condition indices, and decomposition of the
variance of the estimates with respect to each eigenvalue. This option can
be specified in a MODEL statement.
data test;
proc reg;
model q = p t / collin;
run;
8
NOTE: if you use the collin option, the intercept will be included in the
calculation of the collinearity statistics, which is not usually what you
want. You may also use collinoint to exclude the intercept from the
calculations, but it still includes it in the calculation of the regression.
c. Testing for Heteroskedasticity
The SPEC option performs a model specification test. The null hypothesis
for this test maintains that the errors are homoskedastic, independent of
the regressors and that several technical assumptions about the model
specification are valid. It performs the White test. If the null hypothesis is
rejected (small p-value), then there is an evidence of heteroskedasticity.
This option can be specified in a MODEL statement.
data test;
proc reg;
model q = p t / spec;
run;
d. Testing for Autocorrelation
DW option performs autocorrelation test. It provides the Durbin-Watson d
statistics to test that the autocorrelation is zero.
data test;
proc reg;
model q = p t / dw;
run;
e. Hypothesis testing
In SAS you can easily test single or joint hypothesis after you successfully
complete the estimation. For example, if we want to test the null
hypothesis that the coefficient of the p variable is 1.5 (i.e. p=1.5), then the
following command will be used.
proc reg data=test;
model q = p t;
test p = 1.5;
run;
* sets up the hull hypothesis ;
NOTE: remember that you can always look at the t-values and p-values in
the Parameter Estimation section of SAS output for the null hypothesis of
coefficient is zero (β i = 0 ) .
To test the joint hypothesis of
be used.
proc reg data=test;
model q = p t;
test p = 1.5, t = 0.8;
run;
p=1.5
and t=0.8 the command below may
* sets up the hull hypothesis ;
9
Use the command below to test the hypothesis of
proc reg data=test;
model q = p t;
test p + t = 2.3;
run;
p
+
t
= 2.3.
* sets up the hull hypothesis ;
NOTE: in the TEST statement the names of the variables are specified.
SAS will automatically associate those with their coefficients.
3. Creating plots
The PLOT statement in SAS enables to create scatter plots on Y-X axis
(vertical-horizontal). Use the command below to create the basic plot.
proc reg data=test;
model q = p t;
plot q*p;
run;
* starts OLS regression ;
* specifies the Y and X ;
* executes the command ;
After executing this command, a new window will open with your q
variable on vertical axis (Y) and p variable on horizontal axis (X).
You may also create multiple plots using the same command line. The
code below will create various combinations of plots using the same sets
of variables.
proc reg data=test;
plot p*q p*t q*t;
run;
The command above will create three separate scatter plots. One may use
the code below for identical plotting. Both codes will create the same sets
of scatter plots.
proc reg data=test;
plot (p q)*(q t);
run;
In many applications you will required to plot model residuals against a
particular variable. Use the command below to do so.
proc reg data=test;
model q = p t;
plot r.*q;
run;
* r. in SAS stands for residual ;
The table below shows a number of other keywords that can be used with
the PLOT statement and the statistics they display. Note that the
10
keywords should be used in the PLOT statement line and be constructed as
the one in the case with the residual above. For example,
plot residual.*COOKD.;
Keyword *
Statistics
COOKD.
COVRATIO.
Cook's D influence statistics
standard influence of observation on
covariance of betas
DFFITS.
standard influence of observation on
predicted value
H.
leverage
LCL.
lower bound of 100(1- )% confidence
interval for individual prediction
LCLM.
lower bound of 100(1- )% confidence
interval for the mean of the dependent
variable
PREDICTED. (PRED. ; P.) predicted values
PRESS.
residuals from refitting the model with
current observation deleted
RESIDUAL. ( R. )
residuals
RSTUDENT.
studentized residuals with the current
observation deleted
STDI.
standard error of the individual predicted
value
STDP.
standard error of the mean predicted value
STDR.
standard error of the residual
STUDENT.
residuals divided by their standard errors
UCL.
upper bound of 100(1- )% confidence
interval for individual prediction
UCLM.
upper bound of 100(1- )% confidence
interval for the mean of the dependent
variables
* The keywords in the parenthesis are the alternative keywords for the
same procedure. The use of either one is correct.
NOTE: the dot ( . ) after the keyword must be specified.
4. Weighted Least Squares Estimation
WLS is performed by adding a weight to the PROC REG statement. A WEIGHT
statement names a variable in the input data set with values that are relative
weights for a weighted least-squares fit. If the weight value is proportional to the
reciprocal of the variance for each observation, then the weighted estimates are
the best linear unbiased estimates (BLUE).
11
Values of the weight variable must be nonnegative. If an observation's weight is
zero, the observation is deleted from the analysis. If a weight is negative or
missing, it is set to zero, and the observation is excluded from the analysis. An
example is provided below.
proc reg data=test;
model q = p t;
weight p;
run;
* specifies the weight variable ;
5. GLM Regression
PROC GLM analyzes data within the framework of General linear models. PROC
GLM handles models relating one or several continuous dependent variables to
one or several independent variables. The independent variables may be either
classification variables, which divide the observations into discrete groups, or
continuous variables.
The general GLM statement is provided below:
proc glm data=test;
model dependent(s) = independent(s) / options;
run;
For the detailed description of PROC GLM statement and options available to
estimate general linear models please see the “The GLM Procedure” document
available online through the SAS Institute.
/>6. Seemingly Unrelated Regression
Assume we have two regression models:
science = math female
write
= read female
It is the case that the errors (residuals) from these two models would be correlated
because all of the values of the variables are collected on the same set of
observations. In this situation we can use seemingly unrelated regression to
estimate both models simultaneously while accounting for the correlated errors at
the same time, leading to efficient estimates of the coefficients and standard
errors. For this purpose we use PROC SYSLIN statement with option SUR. The
PROC SYSLIN estimates both models simultaneously. Below is an example of
SUR regression.
proc syslin data=test SUR;
model science = math female ;
model write = read female ;
run;
12
The first part of the output consists of the OLS estimate for each model. The
second part of the output gives an estimate of the correlation between the errors of
the two models. The last part of the output will have the seemingly unrelated
regression estimation for our models. Note that both the estimates of the
coefficients and their standard errors are different from the OLS model estimates
shown above.
NOTE: one can easily conduct SUR estimation using 3 and more models. Th
procedure is the same. Just add another MODEL statement.
7. Non-Linear Estimation
f. LOGIT
PROC LOGISTIC statement in SAS performs logistic regression. It is
necessary to include descending option when a variable is coded 0/1 with
1 representing the event whose probability is being modeled. This is
needed so that the odds ratios are calculated correctly.
proc logistic data=test descending ;
model payment = income age gender ;
run;
For the detailed description of PROC LOGISTIC statement and options
available to conduct logistic regression please see the “The LOGISTIC
Procedure” document available online through the SAS Institute.
/>g. PROBIT
PROC PROBIT statement in SAS computes maximum likelihood
estimates of regression parameters and the natural (or threshold) response
rate for quantal response data. It estimates the parameters and C of
probit equation using a modified Newton-Raphson algorithm.
The general PROBIT statement is provided below:
PROC PROBIT DATA=file < options > ;
CLASS variables ;
MODEL response=independents < / options > ;
BY variables ;
OUTPUT < OUT=SAS-data-set > <options > ;
WEIGHT variable ;
For the detailed description of PROC PROBIT statement and options
available to conduct maximum likelihood estimation please see the “The
PROBIT Procedure” document available online through the SAS Institute.
/>
13
8. External Resources
This manual contains the basic information that will be needed to start learning
the SAS software. For more advanced use, I will encourage to use the resources
available through the SAS software help or others that are available through other
organizations. For your convenience, two sources containing one of the most
comprehensive resources are listed below:
a. SAS/STAT User Guide (PDF files). Dipartimento di Scienze Statistiche
"Paolo Fortunati", Bologna, Italia. Available at:
/>Contains downloadable PDF files on all procedures available in SAS
(Version 8). This is a very comprehensive source and I would personally
encourage using it.
b. SAS Learning Resources. University of California at Los Angeles
Academic Technology Services. Available at:
/>Contains learning resources that help to master SAS software including
text and audio/video resources. This is especially useful for those who just
started to learn SAS.
14
STATA® Tutorial
1. Introduction to STATA
a. Limitations
The current version of STATA that is used at the Department of Agricultural
and Applied Economics at UGA is the Intercooled STATA that has the
following limitations:
b. Max number of variables
c. Max number of observations
d. Max number of characters
for a string variable
e. Matrices
- 2,047
- 2,147,483,647 (limited to memory)
- 80
- 800 x 800
b. STATA toolbar and window
STATA toolbar consists of several buttons that have the following
functions.
open
save
open:
save:
print:
log:
viewer:
results:
graph:
do-file editor:
data editor:
data browser:
more:
break:
viewer
log
results
graph
data editor
do-file editor
more
data browser
break
open a STATA dataset
save a dataset
print contents of active window
to start or stop, pause or resume a log file
open viewer window, or bring to the front
open results window, or bring to the front
open graph window, or bring to the front
open do-file editor, or bring window to the front
open data editor, or bring window to the front
open data browser, or bring window to the front
command to continue when paused in long output
stop the current task. This command returns the system
to as it was before you issued the command.
15
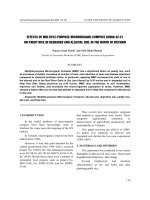
The default STATA working window has the following view. The
descriptions of the individual components are provided below.
Past command appear here
Working directory
displayed here
Variable list
displayed here
Results appear here
Commands typed
appear here
c. STATA Transfer
This is a separate package that is used to convert a variety of different filetypes into other formats. For example, you can easily convert Excel into
STATA or vice versa.
16
2. Working with data
a. Creating the so called ‘do-files’
Even though you can directly type your command statements in the
STATA Command window, it is advised to create a STATA do-file,
which will allow you skip typing each statement line every time you need
to re-run the program as well as for the use in the future. Just click on the
“do-file editor” button and save it. Now you can start writing your
program in do-file editor window and execute the program directly from
there by selecting Tools DO or simply using your keyboard, Ctrl+D.
NOTE: Unlike SAS, in STATA you do not end the statement with
semicolons.
b. Loading data into STATA data editor
To read data in STATA you can either convert the original file into
STATA-friendly format or simply create STATA data file (*.dta). Follow
the steps below to create a STATA data file.
a) Copy data from the original file. For example notepad or Excel.
b) Open STATA data editor (see Section 1b: STATA toolbar and
window) and paste copied data into the editor. If you copy the
variable names from the original data file, then after pasting
STATA data editor will use them as variable headings when
creating a new file. Otherwise, it will name the variables
according to its default procedures (e.g. var1, var2, etc.)
NOTE: throughout the text, var1, var2, etc. are generic variable
names.
c) Click on Preserve (in Data Editor) and close the Data Editor
window.
d) Go to STATA window and select
- File
Save As… choose Stata Data file Save
e) Now you can use that file for your estimation.
c. Reading data into STATA
There are two primary ways of uploading data into STATA. The use of
either one will depend on personal preferences. Instructions for both are
provided below.
i. When using non-STATA data file, make sure to convert it into
*.csv (Excel comma separated values) format or any other that is
readable in STATA. For such data use the following statement:
insheet using “C:\MyDocuments\test.csv”
17
NOTE: Always put the file path into quotation marks. It is also
suggested to use the clear statement before the insheet
statement to clear the use of previous dataset(s), unless otherwise
needed. Regular *.xls file format is not accepted by STATA.
clear
insheet using “C:\MyDocuments\test.csv”
ii.
When using STATA data file (see Section 2.b) use the following
statement:
clear
use "C:\MyDocuments\test.dta"
d. Changing memory
There is a default memory volume set in STATA (=1m), which may not
always be enough for your estimation. To change the memory assigned to
STATA use the following statement:
set mem #k
where # is a number greater than the size of the dataset, and less than the
total amount of memory available on your system and k defines the usnit
of measurement. In this case it means kilobytes. To use megabytes, use m
instead of k. Usually setting memory to 100m will be adequate for most
analysis.
NOTE: To use comments in STATA, simply start your comment from a
new line and a star (*) before the comment text. For example, in the
statement below, the first line is a comment and will not be used by STATA
as a command statement.
* set new memory volume
set mem #k
e. Saving files
To save a data file, use the following statement;
[overwrites current file]
[saves file as filename. Replace is
optional, but necessary if a file of
that name already exists.]
where filename is the name you give to the file.
save, replace
save filename, replace
NOTE: The statements above will save the file in the same directory
where the original file is located.
18
f. LOG files
You can save all output appearing in the Results window in a log file. The
log file can be saved either as a STATA markup and Control Language
(SMCL) or as a text (ASCII) file. SMCL is the default format in STATA.
Please note that the SMCL logs cannot be read by other packages and
should only be read and printed from the Viewer.
- To start a log, use the statement below:
log using filename
log using filename, replace
log using filename.log
[starts an SMCL log]
[overwrites filename.smcl]
[starts a text log]
- To translate a SMCL log file to text, go to File
Log
Translate
- If you want to create a log file that only contains the results and not
command statements. You can use pause and resume options as
illustrated below:
log off
log on
[temporarily suspends log file]
[resumes log file]
- To close a log file, use the statement below:
log close
[closes current log file]
NOTE: As in the do-file, you can add comments in a new line preceded by
a star (*).
g. Controlling output
-more- may appear in your Results window when the output is longer
than the screen height. At anytime you can press Enter to see the next line
or simply click on -more- to go to the end of the listing. To turn off or
on the more command, use the following statement:
set more off
set more on
h. Examining the data
STATA has different alternatives for examining the datasets in STATA.
Their brief description and statements are provided below:
19
NOTE: Throughout the rest of the text, the underlined portion of the
statement indicates that the portion may be used instead of the full
statement. For example,
- to produce summary of contents of a dataset
describe
[describes dataset in current memory]
NOTE: Throughout the rest of the text, the underlined portion of the
statement indicates that the portion may be used instead of the full
statement. For example, the statement d in the statement (describe)
above serves exactly the same purpose as the full statement describe.
d using filename
d varlist
[describes a stored STATA dataset]
[describes a subset of a dataset]
where varlist is the specified variable(s). You may simply list the
variables you want to be described with a space in-between. For
example,
d var1 var2 var3
- To calculate and display a variety of summary statistics, use the
command statement below;
summarize
su varlist
su, d
su variable1, d
[summarize whole dataset]
[summarize subset varlist]
[outputs detailed summary]
[outputs detailed summary of variable1]
- The most detailed examination of data is performed using list
statement. It displays the values of variables by observation.
list
l varlist
[lists all variables by observation]
[lists specified variable(s)]
- To close a log file, use the statement below:
log close
[closes current log file]
NOTE: the arguments illustrated below can be used with all descriptive
statements discussed above, except otherwise stated.
d var4-var7
[describes variables between var4 and var7]
20
HINT: To sort a dataset in an alphabetical order, use the statement
below:
aorder varlist
[if no variable is specified, it will sort the
entire dataset]
su abc* [summarize all variables beginning with the string abc*]
su abc?5
[summarize all variables beginning with the string
abc and ending with 7]
The statements below work only with list command.
list
list
list
list
in
in
in
in
3
-3
11/29
7/-2
[list the 3rd observation]
[list the 3rd from last observation]
[list observations 11 through 29]
[list observation 7 to 2nd from last]
- To view extra information on the variables, such as summary statistics of
numerics, example data-point of strings, details of missing values, data
ranges, etc. use codebook command statement. If not variable name is
specified, the command will give information on all variables in the
dataset.
i. Sorting data
The sort statement in STATA allows sorting data into ascending order of
the values of the variables of varlist.
sort var1
[sorts data by the values of the variable var1]
To sort in descending order, use the following statement:
gsort -var1
NOTE: notice that the variable listed with gsort statement has minus
sign in front of it.
j. Creating new variables
i. The generate and egen commands in STATA are used to create
new variables. The statements below create variables that are algebraic
expressions of others.
g varNEW=var2*var3
[creates new variable that is the
product of var2 and var3]
21
g varNEW=var2+var3
[creates new variable that is the sum
of var2 and var3]
g varNEW=exp(var8/var2)
g varNEW=log(var1)
g varNEW=var2^3
[creates new variable that is
the exponential of the ratio of
var8 and var2]
[creates new variable that is the
natural logarithm of var1]
[creates new variable as 3rd power of var2]
NOTE: statement gen may also be used along with generate & g.
ii. The egen command typically creates new variables based on
summary measures, such as sum, mean, max and min.
egen varNEW=sum(var2)
egen varNEW=max(var1)
[sum of var2]
[largest value in var1]
egen varNEW=mean(var3)
[average value of var3]
egen varNEW=count(var1)
[counts number of nonmissing observations]
iii. The following statement replaces the old variable (varOLD) with the
new one (varNEW).
replace varOLD=var2*var3
iv.
[replaces the varOLD with
the new variable that is the
product of var2 and var3]
There are other two cases where replace statement is used.
(1) Assume that we want to create a new variable (varNEW) from
the existing variable based on some specified criteria. For
example, given the age of the respondents (AGE), we want to
group them into 3 (three) group-ranges: 0-25; 26-60; and 61 and
above. The statements below will create the new variable, say
agerange, based on the listed criteria.
g agerange= . [creates variable agerange that has missing
values ]
22
replace agerange = 1 if 0
is met, i.e. 0
[replace the agerange with 2 if the condition
is met, i.e. 25
[replace the agerange with 3 if the condition
is met, i.e. age>60]
NOTE: in STATA ( . ) stands for missing values. i.e. the
statement above simply creates a new variable that has no values
for any of the observations.
The list of relational operators used in STATA is:
==
~=
>
>=
<
<=
equal to
not equal to
greater than
greater than or equal to
less than
less than or equal to
(2) To create a dummy variable. For the case above, we want to
create a dummy variable for the age. The new variable, say
dummy, takes value of zero (0) if the respondent’s age is below
35 and value of one (1), if the age is more than 35. The statement
below will do it.
g dummy=0
replace dummy=1 if age>35
alternatively,
g dummy = .
replace dummy=0 if 0
NOTE: Both statements will produce the same desired results.
v. String variables. In STATA values for string variables are denoted by
inverted commas – “ ”. For example, if we want to create a new string
variable that will take the string-values of “KID” and “ADULT” for
the ages of 0-18 and 19 and above, respectively. The statements below
will generate the new string variable.
23
g string = “ ”
[will create string variable w/ empty values]
replace string= “kid”
if age<=18
replace string= “adult” if age>=19
alternatively,
g string = “kid” [creates string with values kid]
replace string= “adult”
if age>=19
vi. Lags and leads
- To generate lagged variable, use the following command:
gen varNEW = var1[_n-1]
- To generate a lead variable, use the statement below:
gen varNEW = var1[_n+1]
- One can always do additional manipulation with data when creating
lagged or lead variables. For example, the command below will
create lagged variable for var1 and will also raise the new variable to
the 2nd power.
gen varNEW = var1[_n-1]^2
NOTE: all examples above would create lags of one period. To create
other lags, simply replace 1 in [_n-1] with the desired number of
periods. For example, [_n-5] will create lags of 5 periods.
k. Keep and Drop statements
The original dataset may contain many variables that may not be of
your interest. You may alter the dataset before reading into STATA or
do it in STATA. You can tell STATA to either keep what you want or
drop what you do not want. The results are the same. Assume dataset
has 10 (ten) variables, named var1 to var10. variables of interest are
only var1, var3 and var6.
keep var1 var3 var6
alternatively,
drop var2 var4 var5 var7 var8 var9 var10
alternatively,
drop var2 var4 var5 var7-var10
24