01 general introduction of travel demand analysis dr binh
Bạn đang xem bản rút gọn của tài liệu. Xem và tải ngay bản đầy đủ của tài liệu tại đây (855.77 KB, 47 trang )
October 5, 2016
Transportation Planning and Policy
General introduction of travel
demand analysis
Contents of today’s class
Introduction
Process of travel demand forecast
Travel demand models
2
Introduction
Characteristics of travel
Each consumer or company makes a complex set of
decisions relating the movement based on his/her
needs and environment.
These include purpose, frequency, timing, destination,
and mode of trips.
Further, these decisions must be analyzed in the
context of the intertemporal behavior of the
consumer and company, and long-run decisions on
home, workplace, office location and on automobile
ownership.
Thus, travel is a concomitant of various consumption
and supply activities.
4
What is the travel demand?
Travel demand is defined as the amount of
movements of individuals and/or goods.
There are various units of travel demand, for
example,
Total number of passengers during a specific
period (ex. Passenger per day)
Total travel distance (ex. Passenger kilometer)
The number of goods transported by a specific
transportation mode
The number of passengers traveling from one
place to other place
5
What is the travel demand
analysis?
Travel demand analysis examines the
characteristics of travel demand.
Travel demand analysis is not
transportation planning; it can only
support planning, and in a few cases it
may have the most important role in
the process.
6
Travel demand forecast
Travel demand analysis can contribute to the travel
demand forecast.
Travel demand
Policy A
?
Past trend
Year
7
Travel demand forecast in a
transportation planning
Travel demand forecast
8
Philosophical background of
travel demand analysis
Empiricism (Chủ nghĩa kinh nghiệm)
Empiricism is a theory of knowledge which emphasizes
those aspects of scientific knowledge that are closely
related to evidence, especially as formed through
deliberate experimental arrangements.
It is a fundamental requirement of scientific method that
all hypotheses and theories must be tested against
observations of the natural world, rather than resting
solely on a priori reasoning, intuition, or revelation.
Scientific laws describe the general patterns of our
experiences. To explain the phenomena in a scientific way
means to show an example of scientific laws.
We can forecast the future of the same phenomena by
knowing the laws.
9
Travel demand analysis as a
part of social science
Positivism (chủ nghĩa thực chứng)
Positivism is a philosophy that states that the only authentic
knowledge is scientific knowledge, and that such knowledge
can only come from positive affirmation of theories through
strict scientific method.
The above idea can be applied to the human psychology and
social life. Then, these discipline can be formulated as the
“Social Science”.
Once the knowledge of social science is established, it is
possible to control and regulate the individual behavior and
social collective movement. Like the natural scientists who
contribute to solving the practical engineering problems, the
social scientists can also recognize the social problems and
conflicts based on the social scientific knowledge and solve
them one by one.
10
Process of travel demand
forecast
Process of travel demand
forecast
1.
2.
3.
4.
5.
6.
Identification of the travel demand
which will be forecasted.
Setting the target area and year.
Definition of the network and zoning
system.
Survey: data collection
Travel demand modeling
Travel demand forecast
12
1. Identification of travel
demand
First, we should clarify the purpose/context of the
travel demand forecast.
Which transportation policy/project should be evaluated?
How do we evaluate the policy/project with the forecasted
demand?
Then, the travel demand that will be forecasted can
be identified based on the policy purpose/context.
An analytical approach can be fixed after the travel
demand which should be forecasted is specified.
Example. The goal is to evaluate the introduction of new
public transit service. Then, the transit demand should be
forecasted. To do so, we need the modeling of the modal
choice.
13
2. Setting the target area
Geographical range which should be covered by the
analysis is dependent on the goal/context of analysis.
Case 1: Demand analysis of the
visitors to the Tokyo Disneyland
Case 2: Demand analysis of visitors to
a large-scale shopping mall in Tokyo
14
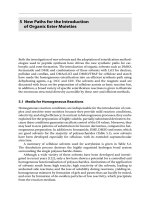
2. Setting the target year
The target year of the travel demand forecast
depends on the context of the transportation
project/policy.
Case 1: A single urban
transit project : 10-15 years
Case 2: Urban master transport
investment plan: 20-40 years
関
越
自
動
車
道
東
北
縦
貫
自
動
車
道
新
大
宮
上
尾
道
路
大宮市
首都圏中央連絡自動車道
土浦市
核都市広域幹線道路
浦和市
青梅市
常
磐
自
動
車
道
東京外かく環状道路
東
埼
玉
道
路
柏市
東関東自動車道水戸線
10号
線
北千葉道路
八王子市
成田市
中央自動車道路
路
道
速
高
路
名
道
東
状
環
浜
横
道路
湾岸
東京
第二
第
三 川
京
崎
縦
浜
貫
道
路
川崎市
東京湾岸道路
ン
湾 イ
京 ラ
東 クア
ア
厚木市
第二東名高速道路
京葉道路
中
央
環
状
線
横浜市
木更津市
横
浜
横
須
賀
道
路
道路
湾口
東京
道
車
動
自
東
関
東 山線
館
千
葉
環
状
道
路
凡 例
計 画 中
富津市
事 業 中
供 用 中
新五計内供用予定
(平成9年度末現在)
高速自動車国道の事業中区間には
整備計画区間を含む
館山市
15
3. Definition of zoning system
Zoning system is used to
aggregate the individual
households and premises
into manageable chunks for
modeling purposes.
The main two dimensions of
a zoning system are the
number of zones and their
size.
It has been common practice
in the past to develop a
zoning system specifically for
each study and decisionmaking context.
Zones are represented in the
travel demand models as if
all their attributes and
properties were
concentrated in a single
point called the zone
centroid.
centroid
zone
16
A list of zoning criteria
1.
2.
3.
4.
5.
6.
Zoning size must be such that the aggregation
error caused by the assumption that all activities
are concentrated at the centroid is not too large.
The zoning system must be compatible with other
administrative divisions, particularly with census
zones.
Zones should be as homogeneous as possible in
their land use and/or population composition.
Zone boundaries must be compatible with cordons
and screen lines and with those of previous zoning
systems.
The shape of the zones should allow an easy
determination of their centroid connectors.
Zones do not have to be of equal size.
17
Example of zoning system
208 zones in Japan. This is often used
in the national travel demand forecast.
18
3. Definition of network
Transportation network
may be represented at
different levels of
aggregation in a model.
Normal practice is to
model the network as a
directed graph i.e. a
system of nodes and
links joining them.
Most nodes are taken to
represent junctions and
the links are
characterized by several
attributes.
If more roads are
included, the
presentation of reality
should be better.
However, there is a
problem of economy
versus realism which
forces the modeler to
select some links for
exclusion.
19
Example of transportation
network
Road network used in the travel demand forecast in the context
of urban railway master plan (Ministry of Transport, 2000)
20
4. Survey: data collection
In many urban areas,
travel survey data
plays an important
role to portray a rich
picture of the existing
situation.
Sometimes this data
is collected primarily
for use in forecasting
and modeling.
The requirements in
terms of survey
methodology are stateof-art design, sampling
and analysis, costeffectiveness and
reliability for prediction
over the medium to
long term.
21
Ideal data collection method
Collection of stage-based trip data, ensuring that
analyses can relate specific modes to specific
locations/times of day/trip lengths, etc.
Inclusion of all modes of travel.
Measurements of highly disaggregated levels of trip
purposes.
Coverage of the broadest possible time period.
Collection of data from all members of the household.
High-quality data robust enough to be used even at a
disaggregate level
Integrated data collection systems incorporating
household interviews as well as origin-destination
data from other sources.
22
Types of travel survey
Household survey: trips made by all household
members.
Intercept survey at external cordon: data on people
crossing the study area border.
Intercept survey inside the study area: trips by nonresidents.
Traffic and person counts: Counts provide further
check information.
Other related data: land-use inventory, infrastructure
and existing services inventories, etc.
23
Questionnaire survey
The aims of a survey is to achieve the highest
possible response rate and to minimize nonresponse bias.
It is recommended to use the mixed methods
to collect the data.
In particular, a self-completion system seems
more appropriate in districts where people
are used to “filling in” forms or where
households cannot be accessed.
24
Design of questionnaire survey
The order of the
questions normally
seeks to minimize the
respondent’s resistance
to answering them.
The difficult questions
are usually put at the
end.
The survey is divided
into two parts: (1)
personal and household
characteristics and
identification; and (2)
trip data.
The survey form should
try to satisfy the
following criteria.
The questions should be
simple and direct.
The number of open
questions should be
minimized.
Sample size can be
determined based on
the sampling theory.
25