Corporate finance 3rd edition graham test bank
Bạn đang xem bản rút gọn của tài liệu. Xem và tải ngay bản đầy đủ của tài liệu tại đây (405.33 KB, 18 trang )
Chapter 2—Financial Statement and Cash Flow Analysis
MULTIPLE CHOICE
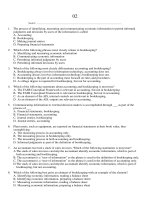
1. A company's balance sheet shows the value of assets, liabilities, and stockholders' equity:
a. at the end of the fiscal year
b. for any given period of time
c. at a specific point in time
d. over an annual period
e. at the end of the calendar year
ANS: C
PTS: 1
REF: 2.1
OBJ: TYPE: fact retention
2. On a balance sheet, retained earnings are not "unspent cash" because:
a. they have been paid out to common stockholders
b. they have an arbitrarily assigned value
c. they are always changing
d. they have been used to finance the firm's assets
e. they are an estimate of future inflows
ANS: D
PTS: 1
REF: 2.1
OBJ: TYPE: fact retention
3. For both managers and external financial analysts, __________ is the single most important
accounting number found on the income statement.
a. net income (net profit after tax)
b. earnings before interest and taxes (EBIT)
c. earnings available for common stockholders
d. operating profit
e. gross margin
ANS: A
PTS: 1
REF: 2.1
OBJ: TYPE: fact retention
4. Earnings per share (EPS) is calculated by:
a. dividing pretax income by the number of shares of common stock outstanding
b. dividing the dividends paid by the number of shares of common stock outstanding
c. dividing earnings available for common stockholders by the number of shares of common
stock outstanding
d. dividing net profits after tax by the total number of preferred and common stock shares
outstanding
e. none of the above
ANS: C
PTS: 1
REF: 2.1
OBJ: TYPE: fact retention
5. Pennywise, Inc. had a great year. Sales reached an all-time high of $25 million, with a gross margin of
$7.5 million. Depreciation was recorded at $800000. Earnings before interest and taxes were $3
million, interest was $1.5 million, and total taxes were $700000. The firm's operating cash flow (OCF)
was:
a. $3400000
b. $950000
c. $3100000
d. $2150000
e. $7100000
ANS: C
OCF=EBIT- taxes + depreciation =
3 M – 0.7 M + 0.8 M = $3100000
PTS: 1
REF: 2.2
OBJ: TYPE: application of concepts
6. In May, GoGreen, Inc. increased its inventory of home composting kits, expecting sales to spike with
warmer weather. This decision resulted in __________ for the firm.
a. a decrease in depreciation expense
b. an increase in depreciation expense
c. an inflow of cash
d. an outflow of cash
e. a decrease in earnings
ANS: D
PTS: 1
OBJ: TYPE: application of concepts
REF: 2.2
7. While examining her firm's Statement of Cash Flows, Amy discovered an unusually large increase in
accounts receivable. This might occur if:
a. the firm was holding more inventory
b. the firm had softened its credit requirements
c. sales had increased significantly
d. a & b
e. b & c
ANS: E
PTS: 1
OBJ: TYPE: application of concepts
REF: 2.2
8. Net working capital:
a. is a measure of a firm's overall liquidity
b. is defined as total assets minus current liabilities
c. reflects decreasing firm solvency as it increases
d. all of the above
e. none of the above
ANS: A
PTS: 1
REF: 2.2
OBJ: TYPE: fact retention
9. When evaluating financial ratios, analysts typically examine a firm's ratio values:
a. compared to firms in other industries
b. compared to the firm's previous years' ratios
c. compared to regional averages
d. compared to firms with similar net profit margins
e. all of the above
ANS: B
PTS: 1
REF: 2.3
OBJ: TYPE: fact retention
10. Why is the quick ratio a more appropriate measure of liquidity than the current ratio for a
large-airplane manufacturer?
a. It recognizes the contribution of all assets so that analysts can see how "quickly" a firm
can satisfy its short-term obligations.
b. It recognizes that parts can be quickly converted to cash.
c. It provides a better measure of overall liquidity when a firm has highly liquid inventory.
d. It is not more appropriate. The current ratio would provide better information in this
situation.
e. It excludes inventory from the numerator of the ratio because it is difficult to convert
inventory to cash and most sales are made on a credit basis.
ANS: E
PTS: 1
OBJ: TYPE: application of concepts
REF: 2.3
11. __________ ratios would provide the best information regarding total return to common stockholders.
a. Profitability
b. Activity
c. Liquidity
d. Market
e. Debt
ANS: A
PTS: 1
REF: 2.3
OBJ: TYPE: fact retention
12. Jane's Foods, Inc., a retail grocery chain, has an inventory turnover ratio of 18.7. The industry average
is 16.8. The difference in these ratios shows that Jane's Foods, Inc.:
a. carries larger inventories than the industry average.
b. has lower sales than the average firm in the industry.
c. sells its goods at a slower rate than the industry average.
d. sells its goods more quickly than the industry average.
e. invests more in inventory per dollar of sales than the industry average.
ANS: D
PTS: 1
OBJ: TYPE: application of concepts
REF: 2.3
13. The one fixed asset that is not depreciated is __________.
a. cash
b. inventories
c. plant
d. land
e. equipment
ANS: D
PTS: 1
REF: 2.1
OBJ: TYPE: fact retention
14. A __________ expresses all income statement entries as a percentage of sales.
a. ratio income statement
b. statement of retained earnings
c. common-size income statement
d. common-size balance sheet
e. cash flow analysis
ANS: C
PTS: 1
REF: 2.1
OBJ: TYPE: fact retention
NOT: Common-size income statements are mentioned only in a footnote.
15. Noncash charges, such as __________, are expenses that appear on the income statement but do not
involve an actual outlay of cash.
a. investment flows, operating flows, financing flows
b. NOPAT
c. free cash flows
d. depreciation, amortization, and depletion allowance
e. All of the above
ANS: D
PTS: 1
REF: 2.2
16. The firm's managers use ratios to __________.
a. generate an overall picture of the company's financial health
b. monitor the firms' performance from period to period
OBJ: TYPE: fact retention
c. isolate developing problems
d. monitor all aspects of the firm's financial situation
e. all of the above
ANS: E
PTS: 1
REF: 2.3
OBJ: TYPE: fact retention
17. Return on total assets (ROA) is equal to __________.
a. net profit margin total asset turnover
b. [earnings available for common stockholders / sales] [sales / total assets]
c. earnings available for common stockholders / total assets
d. the product of the components of the DuPont System
e. all of the above
ANS: E
PTS: 1
OBJ: TYPE: application of concepts
REF: 2.3
18. When a firm has no "other income," its operating profit and __________ are equal.
a. net income
b. net profit after taxes
c. EPS
d. EBIT
e. EAT
ANS: D
PTS: 1
REF: 2.1
OBJ: TYPE: fact retention
19. The __________ flows result from debt and equity financing transactions.
a. financing
b. operating
c. investment
d. cash
e. free cash
ANS: A
PTS: 1
REF: 2.2
OBJ: TYPE: fact retention
20. The firm's __________ are primarily interested in ratios that measure the short-term liquidity of the
company and its ability to make principal and interest payments.
a. board of directors
b. creditors
c. owners
d. financial managers
e. customers
ANS: B
PTS: 1
REF: 2.3
OBJ: TYPE: fact retention
21. A firm changes from LIFO to FIFO; this change will be found in the
a. The balance sheet
b. The income statement
c. The statement of cash flows
d. Notes to the financial statements
ANS: D
PTS: 1
REF: 2.1
OBJ: TYPE: fact retention
22. In 2011, a firm books the following: increase in cash, $0; increase in inventories $24; increase in
accounts receivable, $27; increase in accounts payable, $10; what is the firms change in net working
capital?
a. $0
b. -$41
c. $41
d. $51
ANS: C
PTS: 1
REF: 2.2
OBJ: TYPE: application of concepts
23. A manager has a choice of depreciation methods, 5 year straight line or 5 year MACRS; which is the
most likely choice, and why?
a. MACRS to decrease taxes
b. Straight line to minimize depreciation expense
c. Straight line to match financial accounting records
d. Both choices are simply accounting choices with no real economic impact
ANS: A
PTS: 1
OBJ: TYPE: application of concepts
REF: 2.2
24. Which of the following is an inflow of corporate cash?
a. Dividends
b. Increasing treasury stock
c. Purchasing treasury bills
d. Depreciation charges
ANS: D
PTS: 1
OBJ: TYPE: application of concepts
REF: 2.2
MATCHING
Match each cash flow to its type:
a. Inflow
b. Outflow
1.
2.
3.
4.
5.
6.
Dividends paid
Decrease in any liability
Depreciation
Sale of stock
Repurchase of stock
Decrease in any asset
1. ANS:
OBJ:
2. ANS:
OBJ:
3. ANS:
OBJ:
4. ANS:
OBJ:
5. ANS:
OBJ:
B
PTS: 1
TYPE: application of concepts
B
PTS: 1
TYPE: application of concepts
A
PTS: 1
TYPE: application of concepts
A
PTS: 1
TYPE: application of concepts
B
PTS: 1
TYPE: application of concepts
REF: 2.2
REF: 2.2
REF: 2.2
REF: 2.2
REF: 2.2
6. ANS: A
PTS: 1
OBJ: TYPE: application of concepts
REF: 2.2
Match the following ratios to the appropriate category:
a. Current
b. Assets-to-equity (A / E)
c. Earnings per share
d. Price / earnings
e. Average payment period
7.
8.
9.
10.
11.
Profitability
Liquidity
Market Value
Activity
Debt
7.
8.
9.
10.
11.
ANS:
ANS:
ANS:
ANS:
ANS:
C
A
D
E
B
PTS:
PTS:
PTS:
PTS:
PTS:
1
1
1
1
1
REF:
REF:
REF:
REF:
REF:
2.3
2.3
2.3
2.3
2.3
OBJ:
OBJ:
OBJ:
OBJ:
OBJ:
TYPE: fact retention
TYPE: fact retention
TYPE: fact retention
TYPE: fact retention
TYPE: fact retention
Match the following terms to their definitions with their proper agency and rules:
a. accepted accounting rules
b. developed accepted accounting rules
c. responsible for regulating publicly held U.S. companies
d. accounting standards followed by most developed countries
12.
13.
14.
15.
FASB
SEC
GAAP
IAS
12. ANS:
OBJ:
13. ANS:
OBJ:
14. ANS:
OBJ:
15. ANS:
OBJ:
B
PTS: 1
TYPE: application of concepts
C
PTS: 1
TYPE: application of concepts
A
PTS: 1
TYPE: application of concepts
D
PTS: 1
TYPE: application of concepts
REF: 2.1
REF: 2.1
REF: 2.1
REF: 2.1
Match the following terms to their definitions:
a. cash
b. marketable securities
c. accounts receivable
d. gross property
e. net property
16.
17.
18.
19.
liquid, short-term investment
original cost of an asset
asset that can be used directly as a means of payment
original cost of an asset minus accumulated depreciation
20. amount customers owe the firm from sales made on credit
16. ANS:
OBJ:
17. ANS:
OBJ:
18. ANS:
OBJ:
19. ANS:
OBJ:
20. ANS:
OBJ:
B
PTS: 1
REF: 2.1
TYPE: fact retention | TYPE: application of concepts
D
PTS: 1
REF: 2.1
TYPE: fact retention | TYPE: application of concepts
A
PTS: 1
REF: 2.1
TYPE: fact retention | TYPE: application of concepts
E
PTS: 1
REF: 2.1
TYPE: fact retention | TYPE: application of concepts
C
PTS: 1
REF: 2.1
TYPE: fact retention | TYPE: application of concepts
Match the following flows to their definitions:
a. operating flows
b. investment flows
c. financing flows
d. free cash flow
e. non-cash charges
21.
22.
23.
24.
25.
associated with the purchase or sale of fixed assets and business interests
result from debt and equity financing
cash flow available to investors
expenses that appear on the income statement but do not involve an actual outlay of cash
directly related to the production and sale of the firm's products or services
21. ANS:
OBJ:
22. ANS:
OBJ:
23. ANS:
OBJ:
24. ANS:
OBJ:
25. ANS:
OBJ:
B
PTS: 1
REF: 2.2
TYPE: fact retention | TYPE: application of concepts
C
PTS: 1
REF: 2.2
TYPE: fact retention | TYPE: application of concepts
D
PTS: 1
REF: 2.2
TYPE: fact retention | TYPE: application of concepts
E
PTS: 1
REF: 2.2
TYPE: fact retention | TYPE: application of concepts
A
PTS: 1
REF: 2.2
TYPE: fact retention | TYPE: application of concepts
Match the following account changes with cash inflows and outflows:
a. inflows
b. outflows
26.
27.
28.
29.
30.
decrease in inventory
increase in accounts receivable
depreciation
repurchase of common stock
dividend paid
26. ANS:
OBJ:
27. ANS:
OBJ:
28. ANS:
OBJ:
A
PTS: 1
TYPE: application of concepts
B
PTS: 1
TYPE: application of concepts
A
PTS: 1
TYPE: application of concepts
REF: 2.2
REF: 2.2
REF: 2.2
29. ANS:
OBJ:
30. ANS:
OBJ:
B
PTS: 1
TYPE: application of concepts
B
PTS: 1
TYPE: application of concepts
REF: 2.2
REF: 2.2
SHORT ANSWER
1. Consider a firm with a current ratio of 1.2, a quick ratio of 0.9, and an inventory turnover ratio of 12.7.
If the firm has inventories of $1.2 million, what are their current assets and cost of goods sold?
ANS:
Given the firm has an inventory turnover ratio of 12.7, and inventories of 1.2 million, the firm's cost of
goods sold must be $15.24 million. The firm's current ratio is 1.2, so current liabilities may be written
as current assets / 1.2. Substituting this relationship into the quick ratio formula produces,
0.9
= (current assets - inventory) / current liabilities
= (current assets - inventory) / (current assets / 1.2)
= 1.2 (current assets – $1.2 M) / (current assets)
Solving for current assets yields
0.9 = 1.2 – $1.44 M / (current assets)
0.3 = $1.44 M / (current assets)
therefore current assets = $1.44 M / 0.3 = $4.8 M
Similarly, cost of goods sold can be computed directly from the inventory turnover ratio as 12.7
$1.2M = $15.24M
PTS: 1
REF: 2.3
OBJ: TYPE: advanced critical thinking
2. The DuPont System allows us to relate the return on total assets and the return on common equity to
various measures of firm characteristics. Consider a firm with a ROA of 0.04.
a. If you were analyzing a firm that had sales of $12500 and total assets of $10000, how much in
earnings were available for common shareholders?
b. If the firm had common stockholders' equity of $3300, what would be the firm's ROE?
c. If we compare this firm to another similar firm in the industry we find that the comparison
firm has an ROA and ROE of 0.05 and 0.191663, respectively. Given this information,
calculate the comparison firm's ratio of total assets to common stock equity. How does this
ratio differ from our firm?
d. Interpret the performance differences between these firms.
ANS:
a. earnings available for common shareholders = 0.04 $10000 = $400
b. ROE = $400 / $3300 = 0.1212 or 12.12%
c. ROE = ROA A / E
0.191663 = 0.05 A / E therefore, A / E = 3.83326 (virtually the same as for our firm, i.e.
$10000 / $3300 = 3.0303)
d. The performance differences between these firms are therefore due to the differing abilities of
the two firms to earn returns on their assets The first firm earned only 4 cents on each dollar of
assets whereas the comparison firm earned 5 cents on each dollar of assets, thereby accounting
for its greater return on common stockholder equity.
PTS: 1
REF: 2.3
OBJ: TYPE: application of concepts
3. Consider a firm with an ROA of 0.04 and ROE of 0.13. A comparison firm from the same industry has
an ROA of 0.06 and an ROE of 0.191667. Both firms have the same degree of financial leverage as
reflected in their identical assets-to-equity ratios of 3.194445. Suppose we were to learn that our
comparison firm is 70 years old. Our firm is relatively young. Taking into account this new
information, interpret the performance differences between these firms.
ANS:
The performance differences between these firms are therefore due to the ability of the firms to
productively employ their assets. However, older firms tend to have smaller book values of assets,
which tend to lead to overstated measures of ROA. That is, the smaller ROA denominator may only
reflect accounting differences between the firms. If this is the case here, there may be no real
performance differences between the firms. The differences might solely be due to a bias in our
'historical cost less accumulated depreciation' accounting system.
PTS: 1
REF: 2.3
OBJ: TYPE: advanced critical thinking
4. Given the balance sheets provided for Local Oil Co (2003 and 2004) below, calculate the following
ratios for both 2003 and 2004:
a. Current ratio
b. Quick ratio
c. Debt ratio
d. Assets-to-equity
e. Debt-to-equity
Local Oil Co. Balance Sheet 2003 and 2004 ($ in millions)
Assets
Current Assets
Cash and cash equivalents
Marketable securities
Accounts receivable
Inventories
Other
Total current assets
Fixed assets
Gross property, plant, and equipment
Less: Accumulated Depreciation
Net property, plant, and equipment
Intangible assets and others
Net fixed assets
Total assets
Liabilities and Stockholders' Equity
Current liabilities
Accounts payable
Notes payable
Accrued expenses
Total current liabilities
Long term liabilities
Deferred taxes
2004
$
220
50
1,750
650
150
$2820
2003
$
200
40
1,550
670
160
$2620
$9,550
(3,450)
$6,100
750
$6,850
$9670
$9,025
(3,250)
$5,775
575
$6,350
$8970
$1700
350
300
$2350
$1600
600
300
$2500
$
950
$
900
2,000
$2950
$5300
Long-term debt
Total long-term liabilities
Total Liabilities
Stockholders' equity
Preferred stock
Common stock par value
Paid-in capital in excess of par
Retained earnings
Less: Treasury stock
Total stockholders' equity
Total liabilities and stockholders' equity
$
240
240
1250
840
(550)
$2020
$9670
1,800
$2700
$5200
$
240
220
1075
215
(480)
$1270
$8970
ANS:
a.
b.
c.
d.
e.
2004
1.2000
0.9234
0.5481
4.7871
1.4604
Current ratio =
Quick ratio =
Debt ratio =
Assets-to-equity =
Debt-to-equity =
PTS: 1
REF: 2.3
2003
1.0480
0.7800
0.5797
7.0630
2.1260
OBJ: TYPE: application of concepts
5. If one of the entries on the asset side of the balance sheet is measured with error, what must happen to
the other side of the balance sheet? Do we expect items near the top of the balance sheet to be more or
less subject to measurement errors?
ANS:
If one of the entries on the asset side of the balance sheet is measured with error, there must be on
offsetting value on the other side of the balance sheet. In general, measurement errors are greatest for
items that are less marketable and exist for longer periods of time. These entries will be reported in the
lower portion of the balance sheet.
PTS: 1
REF: 2.1
OBJ: TYPE: application of concepts
6. Consider a firm that shows an increase in liquidity according to the current ratio, but a decrease in
liquidity according to the quick ratio for some interval of time. How would you decide if liquidity has
improved or deteriorated?
ANS:
The difference in the ratios relates entirely to inventory levels. It is possible for this situation to occur.
For instance, consider a firm with a large increase in inventories and a small increase in current
liabilities. To decide if this represents a positive or negative liquidity event, we need to interpret the
role of inventories. If inventories may be readily sold to others in the case of a cash shortage, then the
current ratio reflects the correct state of affairs. If, in contrast, inventories could not be sold in the case
of a serious negative event, then the quick ratio should be followed. A lot of the activity of inventory
using the inventory turnover ratio would show the general liquidity of inventory. High inventory
turnovers would validate the current ratio whereas low inventory turnover would support use of the
quick ratio.
PTS: 1
REF: 2.3
OBJ: TYPE: application of concepts | TYPE: critical thinking
7. Identify the four key financial statements required by the SEC for reporting to stockholders.
ANS:
1. balance sheet
2. income statement
3. statement of retained earnings
4. statement of cash flows
PTS: 1
REF: 2.1
OBJ: TYPE: application of concepts
8.
a.
Calculate the net profit margin, total asset turnover, assets-to-equity ratio, and ROE using the
data in the following table for firms in the same industry.
Axel Co.
Blue Co.
Carol Co
David Co.
b.
Sales
Earnings available
for common
stockholders
Total assets
$260000
150000
100000
300000
49400
9000
10000
12000
170000
80000
100000
270000
Stockholder's
equity
$50000
50000
94000
150000
Evaluate each firm's performance relative to the other three firms in the industry.
ANS:
a.
Axel Co.
Blue Co
Carol Co.
David Co.
b.
Net profit margin
19%
6%
10%
4%
Total asset
turnover
1.53
1.88
1.00
1.11
Assets-to-Equity
Ratio
3.4
1.6
1.06
1.8
ROE
98.8%
18.0%
10.6%
8.0%
Axel Co. appears to have the best financials
• Blue Co. has a low net profit margin indicating the need for lower costs or higher prices.
• Carol Co. has both a low total assets turnover and a low assets-to-equity ratio. The low
turnover indicates excessive investment in assets. The low assets-to-equity ratio indicates
that the firm is not taking advantage of financial leverage (debt).
• David Co. has a lower net profit margin and total asset turnover, but makes up for these
weaknesses by using more financial leverage which is reflected in its high assets-to-equity
ratio, i.e., high risk.
PTS: 1
REF: 2.3
OBJ: TYPE: application of concepts | TYPE: critical thinking
9. The following financial data is given for four firms:
Axel Co.
Blue Co
Carol Co.
David Co.
Net profit margin
15%
5%
15%
12%
Total asset
turnover
1.33
1.33
1.00
1.04
Assets-to-Equity
Ratio
1.50
1.50
1.07
2.40
ROE
30.0%
10.0%
16.0%
30.0%
What additional information would you require to complete your analysis of the companies presented
here?
ANS:
Knowing the makeup of the current and fixed assets, along with a separate breakout of current
liabilities would provide insight into the company's liquidity. In addition, it would be helpful to know
the method used by the company to report its financial information.
PTS: 1
REF: 2.3
OBJ: TYPE: critical thinking
10. What determines the order in which assets and liabilities appear within their respective balance sheet
sections?
ANS:
Assets and liabilities appear in descending order of liquidity, or the length of time it will take for the
accounts to be converted into cash in the normal course of business.
PTS: 1
REF: 2.1
OBJ: TYPE: critical thinking
11. What is the final step in the income statement?
ANS:
The final step is to subtract taxes from pretax income to arrive at net income, or net profit after tax.
Net income is the "bottom line" and is the single most important accounting number for both corporate
managers and external financial analysis. Subtracting any preferred dividends from net income results
in earnings available for common stockholders, which when divided by the number of shares of
common stock outstanding results in earnings per share (EPS).
PTS: 1
REF: 2.1
OBJ: TYPE: critical thinking
12. What is the purpose of the statement of retained earnings?
ANS:
The statement of retained earning reconciles the net income earned during a given year, and any cash
dividend paid, with the change in retained earnings between the start and end of that year.
PTS: 1
REF: 2.1
OBJ: TYPE: critical thinking
13. Why do financial managers tend to be more interested in free cash flow (FCF) than in the net operating
profit after taxes?
ANS:
FCF is the amount of cash flow available to investors--the providers of debt and equity. It represents
the net amount of cash flow remaining after the firm has met all operating needs and paid for
investments--both short-term and long-term.
Net operating profit after taxes, on the other hand, is a rough accounting estimate of the internal cash
flow generated by the firm in a given period.
PTS: 1
REF: 2.2
14. What is financial leverage?
OBJ: TYPE: critical thinking
ANS:
Financial leverage is the magnification of risk and expected return introduced through the use of
fixed--cost financing, such as debt and preferred stock. The more financial leverage a firm uses, the
greater will be its risk and the higher the return investors will demand on the firm's securities.
PTS: 1
REF: 2.3
OBJ: TYPE: critical thinking
Rich Corporation's Financial Statements
Rich Corporation Balance Sheets ($000)
Assets
Current assets
Cash
Marketable securities
Accounts receivable
Inventory
Other
Total current assets
Fixed Assets
Gross Property, plant, and equipment
Less: accumulated depreciation
Net property, plant, and equipment
Intangible assets
Net fixed assets
Total Assets
Liabilities and Stockholders' Equity
Current liabilities
Accounts payable
Notes payable
Accrued expenses
Total current liabilities
Long-term liabilities
Deferred taxes
Long-term debt
Total long-term liabilities
Total liabilities
Stockholders' equity
Preferred stock
Common stock ($1 par value)*
Paid-in capital in excess of par
Retained earnings
Less: treasury stock
Total stockholders' equity
Total liabilities and stockholders' equity
2004
2003
$ 350.00
$
10.00
$1,450.00
$ 450.00
$
65.00
$2325.00
$ 200.00
$
5.00
$ 925.00
$ 300.00
$
80.00
$1,510.00
$ 7,900.00
$(2,725.00)
$ 5,175.00
$
250.00
$ 5325.00
$ 7650.00
$ 7,000.00
$(2,225.00)
$ 4,775.00
$
150.00
$ 4,925.00
$ 6,435.00
$ 900.00
$ 700.00
$ 390.00
$ 1990.00
$ 550.00
$ 550.00
$ 225.00
$1,325.00
$
650.00
$1004.00
$1654.00
$3644.00
$ 425.00
$ 950.00
$1,375.00
$2,700.00
$
10.00
$ 670.00
$ 585.00
$3,113.00
$ (400.00)
$2016.00
$7650.00
$
20.00
$ 652.00
$ 575.00
$2,688.00
$ (200.00)
$3,735.00
$6,435.00
* 665,000 shares of common stock outstanding in 2004 and 652,000 shares of common stock
outstanding in 2003
Rich Corporation Income Statements ($000)
Sales revenue
Less: Cost of goods sold (COGS)*
Gross profit
Less: Operating expenses
Less: Selling, general, & administrative expenses
Less: Depreciation
Operating profit
Plus: Other income
EBIT
Less: Interest expense
Pretax income
Less: Taxes
Current
Deferred
Total taxes
Net income after tax
Less: Preferred stock dividends
Earnings available for common stockholders
Less: Dividends
Total retained earnings**
2004
2003
$10250.00
$ 7754.00
$ 2496.00
$ 600.00
$
555.00
$
500.00
$ 841.00
$
120.00
$ 961.00
$
140.00
$ 821.00
$8,350.00
$5,177.00
$3,173.00
$1,420.00
$ 530.00
$ 475.00
$ 748.00
$
90.00
$ 838.00
$ 125.00
$ 713.00
$
$
$
$
$
$
$
$
$
$
$
$
325.00
180.00
505.00
795.00
$
5
790.00
365.00
425.00
$
$
$
178.00
90.00
268.00
445.00
3.00
442.00
190.00
252.00
* Rich's annual credit purchases represent about 75% of COGS. Using this relationship, its credit
purchases in 2004 were $5815500 and in 2003 were $3,882,750.
** The price per share of stock at the end of 2004 was $14.30 and in 2003 it was $6.10.
15. Refer to Rich Corporation's Financial Statements. Calculate the liquidity ratios for Rich Corporation in
2004.
ANS:
Current ratio
=
current assets
current liabilities
=
$2325
$1990
= 1.17
Quick ratio
=
current assets - inventory
current liabilities
=
$2325 - $450
$1990
= 0.94
PTS: 1
REF: 2.3
OBJ: TYPE: application of concepts
16. Refer to Rich Corporation's Financial Statements. Calculate the activity ratios for Rich Corporation in
2004.
ANS:
Inventory turnover
=
COGS
inventory
Average sales per day
=
annual sales
365
Average collection period
=
accounts receivable
average sales per day
=
$7754
$450
= 17.23
= $10,250,000.00 = $28082
365
=
$1450000
$28082
= 51.6 days
Average purchases per day
=
annual purchases
365
=
$5815500
365
= $15933
Average payment period
=
accounts payable
avg. purch. per day
=
$900,000
$15933
= 56.5 days
Net fixed asset turnover
=
sales
net fixed assets
=
$10250
$5325
= 1.92
Total asset turnover
=
sales
total assets
=
$10250
$7650
= 1.34
PTS: 1
REF: 2.3
OBJ: TYPE: application of concepts
17. Refer to Rich Corporation's Financial Statements. Calculate the debt ratios for the Rich Corporation in
2004.
ANS:
Debt ratio
=
total liabilities
total assets
=
$3644
$7650
Assets-to-equity
=
total assets
common stock equity
=
$7650
$2016 - $10
Debt-to-equity
=
long-term debt
stockholders' equity
=
$1004
$2016
= 49.8%
Times interest earned
=
EBIT
interest expense
=
$961
$140
= 6.86
PTS: 1
REF: 2.3
= 47.6%
= 3.81
OBJ: TYPE: application of concepts
18. Refer to Rich Corporation's Financial Statements. Calculate the profitability ratios for Rich
Corporation in 2004.
ANS:
Gross profit margin
=
gross profit
sales
=
$2496
$10250
= 24.4%
Operating profit margin
=
operating profit
sales
=
$841
$10250
= 8.2%
Net profit margin
=
earnings available for common stockholders
sales
=
$790
$10250
= 7.7%
EPS
=
earnings available for common stockholders
number of shares of common stock outstanding
=
$790
665
= $1.19
ROA
=
earnings available for common stockholders
total assets
=
$790
$7650
= 10.3%
ROE
=
earnings available for common stockholders
common stock equity
=
$790
$2016 - $10
= 39.4%
PTS: 1
REF: 2.3
OBJ: TYPE: application of concepts
19. Refer to Rich Corporation's Financial Statements. Calculate the market ratios for the Rich Corporation
in 2004 assuming the firm's earnings per share (EPS) are $1.19.
ANS:
P/E ratio
=
Book value per share
Market/book ratio
PTS: 1
=
market price per share of common stock
earnings per share
=
$14.30
$1.19
= 12.04
=
common stock equity
number of shares of common stock
outstanding
=
$670.00
665
= $1.01
market value per share of common stock
book value per share of common stock
=
$14.30
$1.01
= 14.16
REF: 2.3
OBJ: TYPE: application of concepts
20. Refer to Rich Corporation's Financial Statements. Calculate the ROA and ROE ratios using the
DuPont system for Rich Corporation in 2004.
ANS:
ROA
= net profit margin total asset turnover
ROA
=
earnings available for common stockholders
sales
sales
total assets
=
$790
$10250
$10250
$7650
= 7.7% 1.34
= 10.3%
= (net profit margin total asset turnover)
ROE
=
= ROA
assets-to-equity ratio
= ROA
total assets
common stock equity
10.3%
_$7650.00_
$670.00
= 117.6%
PTS: 1
REF: 2.3
OBJ: TYPE: application of concepts | TYPE: critical thinking
ESSAY
assets-to-equity ratio
1. In a well-written essay, discuss the types of financial information sought by at least three different
potential users of financial statements. What difficulties arise when creating a set of accounting
statements for multiple users? Do you believe that there is a single set of accounting rules that, once
found, will solve all reporting controversies?
ANS:
A well-written essay will consider potential users of financial statements such as external financial
analysts seeking timely information for investment purposes, legal analysts seeking a detailed
accounting history of the firm's operations and performance, internal users seeking consistent
measurement of past events for management decisions and compensation contracts, and managers
seeking information related to comparison firms in the same industry.
Unfortunately, it is extremely difficult for a single set of financial statements to provide 'best'
information for a wide list of alternative purposes. Perhaps the best we can seek is a set of financial
statements that are consistent over time and across firms. This data bank of information can then be
used meaningfully and modified for a variety of purposes.
Because of the varied viewpoints and concerns of users of financial information, it is unlikely that a
single set of accounting rules will solve all reporting controversies. As long as the rules allow firms
some flexibility with regard to the reporting of various transactions there will be controversies. The
goal should be the minimization of potential controversies.
PTS: 1
REF: 2.1
OBJ: TYPE: advanced critical thinking
2. Given the appropriate financial statements, what is required to do a complete ratio analysis and
interpretation of the ratio for a given corporation? What other analyses might you do?
ANS:
Ratio
Current ratio
Quick ratio
Activity ratios:
Inventory turnover
Average sales per day
Average collection period
Average purchases per day
Average payment period
Fixed asset turnover
Total asset turnover
Debt Ratios:
Assets-to-equity
Debt-to-equity
Times interest earned
Profitability ratios:
Gross profit margin
Operating profit margin
Net profit margin
Information required
Current assets
Current liabilities
Current assets inventory
Current liabilities
COGS
Inventory
Annual sales
Accounts receivable
Annual purchase
Accounts payable
Net fixed assets
Total assets
Total liabilities
Total assets
Common stock equity
Long-term-debt
Stockholders' equity
EBIT
Interest expense
Gross profit
Sales
Operating profit
Earnings available for common stockholders
EPS
ROA
ROE
Market ratios:
P/E ratio
Book value per share
Market/book ratio
Number of shares of common stock outstanding
Total assets
Common stock equity
Market price per share of common stock
Earnings per share
Common stock equity
Number of common stock shares outstanding
Other analyses that might be done:
1. Do a trend analysis of the ratios over multiple years. Discuss the upward or downward trend of
each ratio.
2. Make a comparison of each ratio in each year to the appropriate industry average.
3. Compare the DuPont system for ROA and ROE over multiple years to the industry ratios.
4. Draw conclusions on the corporation's liquidity, activity, debt, profitability, and market ratios.
5. You could also analyze the statement of retained earning and the statement of cash flows.
PTS: 1
REF: 2.2 | 2.3
OBJ: TYPE: critical thinking
3. How do you calculate a firm's free cash flow (FCF)?
ANS:
First you calculate the firm's operating cash flow (OCF), the cash flow generated from operations.
OCF = NOPAT + depreciation = EBIT * (1- T) + depreciation
Second, you convert OCF to free cash flow (FCF). This is done by deducting the firm's net investment
in fixed (FA) and current assets (CA) from OCF.
Only spontaneous current liability changes--changes in accounts payable (A / P) and changes in
accrued liabilities ( accruals)--are deducted from current assets to find the net change in short-term
investment.
FCF = OCF - FA - (CA - A / P - accruals)
PTS: 1
REF: 2.2
OBJ: TYPE: critical thinking
4. What are the basic steps in constructing a statement of cash flows?
ANS:
You construct the statement of cash flows by using the income statement for a given year, along with
the beginning and end-of-year balance sheets. The procedure involves classifying balance sheet
changes as inflows or outflows of cash; obtaining income statement data; classifying the relevant
values into operating, investment, and financing cash flows; and presenting them in the proper format.
By adding up the items in each category--operating, investment, and financing activities--you obtain
the net increase (decrease) in cash and marketable securities for the year.
PTS: 1
REF: 2.2
OBJ: TYPE: critical thinking