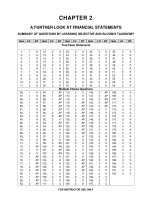
Elementary statistics 6th edition larson test bank
Bạn đang xem bản rút gọn của tài liệu. Xem và tải ngay bản đầy đủ của tài liệu tại đây (484 KB, 56 trang )
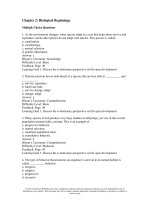
MULTIPLE CHOICE. Choose the one alternative that best completes the statement or answers the question.
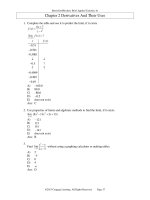
Use the given frequency distribution to find the
(a) class width.
(b) class midpoints of the first class.
(c) class boundaries of the first class.
1)
Height (in inches)
Class
Frequency, f
50 - 52
5
53 - 55
8
56 - 58
12
59 - 61
13
62 - 64
11
A) (a) 3
(b) 51
(c) 49.5-52.5
2) Phone Calls (per day)
Class
Frequency, f
8 - 11
18
12 - 15
23
16 - 19
38
20 - 23
47
24 - 27
32
A) (a) 3
(b) 9.5
(c) 7.5-11.5
3)
4)
Weight (in pounds)
Class
Frequency, f
135 - 139
6
140 - 144
4
145 - 149
11
150 - 154
15
155 - 159
8
A) (a) 4
(b) 137.5
(c) 134.5-139.5
Miles (per day)
Class
Frequency, f
1-2
9
3-4
22
5-6
28
7-8
15
9 - 10
4
A) (a) 1
(b) 1
(c) 1-2
1)
B) (a) 2
(b) 51.5
(c) 50-52
C) (a) 2
(b) 51.5
(c) 49.5-52.5
D) (a) 3
(b) 51
(c) 50-52
2)
B) (a) 3
(b) 10.5
(c) 8-11
C) (a) 4
(b) 10.5
(c) 8-11
D) (a) 4
(b) 9.5
(c) 7.5-11.5
3)
B) (a) 4
(b) 137.5
(c) 135-139
C) (a) 5
(b) 137
(c) 134.5-139.5
D) (a) 5
(b) 137
(c) 135-139
4)
B) (a) 2
(b) 1
(c) 1-2
C) (a) 1
(b) 1.5
(c) 0.5-2.5
1
D) (a) 2
(b) 1.5
(c) 0.5-2.5
SHORT ANSWER. Write the word or phrase that best completes each statement or answers the question.
Use the maximum and minimum data entries and the number of classes to find the class width, the lower class limits,
and the upper class limits.
5) min = 1, max = 30, 6 classes
5)
6) min = 80, max = 265, 6 classes
6)
MULTIPLE CHOICE. Choose the one alternative that best completes the statement or answers the question.
Provide an appropriate response.
7) Use the ogive below to approximate the number in the sample.
A) 28
B) 100
C) 341
7)
D) 80
8) Use the ogive below to approximate the cumulative frequency for 24 hours.
A) 63
B) 75
C) 17
2
8)
D) 27
SHORT ANSWER. Write the word or phrase that best completes each statement or answers the question.
Use the relative frequency histogram to
a) identify the class with the greatest, and the class with the least, relative frequency.
b) approximate the greatest and least relative frequencies.
c) approximate the relative frequency of the fifth class.
9)
9)
Use the given frequency distribution to construct a frequency histogram, a relative frequency histogram and a
frequency polygon.
10)
Height (in inches)
10)
Class
Frequency, f
50 - 52
5
53 - 55
8
56 - 58
12
59 - 61
13
62 - 64
11
11)
Weight (in pounds)
Class
Frequency, f
135 - 139
6
140 - 144
4
145 - 149
11
150 - 154
15
155 - 159
8
11)
Use the given frequency distribution to construct a cumulative frequency distribution and an ogive.
12) Phone Calls (per day)
12)
Class
Frequency, f
8 - 11
18
12 - 15
23
16 - 19
38
20 - 23
47
24 - 27
32
3
13)
Height (in inches)
Class
Frequency, f
50 - 52
5
53 - 55
8
56 - 58
12
59 - 61
13
62 - 64
11
13)
14)
Weight (in pounds)
Class
Frequency, f
135 - 139
6
140 - 144
4
145 - 149
11
150 - 154
15
155 - 159
8
14)
15)
Miles (per day)
Class
Frequency, f
1-2
9
3-4
22
5-6
28
7-8
15
9 - 10
4
15)
MULTIPLE CHOICE. Choose the one alternative that best completes the statement or answers the question.
Provide an appropriate response.
16) A city in the Pacific Northwest recorded its highest temperature at 91 degrees Fahrenheit and its
lowest temperature at 12 degrees Fahrenheit for a particular year. Use this information to find the
upper and lower limits of the first class if you wish to construct a frequency distribution with 10
classes.
A) 7-17
B) 12-18
C) 12-19
D) 12-20
17) A sample of candies have weights that vary from 2.35 grams to 4.75 grams. Use this information to
find the upper and lower limits of the first class if you wish to construct a frequency distribution
with 12 classes.
A) 2.35-2.54
B) 2.35-2.55
C) 2.35-2.75
D) 2.35-2.65
SHORT ANSWER. Write the word or phrase that best completes each statement or answers the question.
The grade point averages for 40 students are listed below.
2.0
3.1
2.2
3.0
3.2
2.4
2.2
4.0
1.8
2.4
1.7
4.0
2.9
2.3
0.5
2.1
0.9
1.6
3.6
1.9
4.0
1.6
3.4
1.1
3.3
4.0
1.9
0.5
2.9
3.1
2.0
3.2
3.6
3.2
3.0
3.0
0.8
1.8
1.1
2.2
18) Construct a frequency distribution, a relative frequency distribution, and a cumulative
frequency distribution using eight classes. Include the midpoints of the classes.
4
18)
16)
17)
19) Construct a frequency histogram, a relative frequency histogram and a frequency polygon
using eight classes.
19)
20) Construct an ogive using eight classes.
20)
The heights (in inches) of 30 adult males are listed below.
70
67
69
72
71
71
71
70
68
70
74
67
69
69
73
73
68
74
69
71
70
68
71
71
70
71
69
71
72
68
21) Construct a frequency distribution, a relative frequency distribution, and a cumulative
frequency distribution using five classes.
21)
22) Construct a frequency histogram using five classes.
22)
23) Construct a relative frequency histogram using five classes.
23)
24) Construct a frequency polygon using five classes.
24)
25) Construct a ogive using five classes.
25)
The Highway Patrol, using radar, checked the speeds (in mph) of 30 passing motorists at a checkpoint. The results are
listed below.
44
35
50
38
40
41
41
37
47
50
41
36
36
43
35
36
50
40
43
45
42
42
45
43
49
39
48
48
38
33
26) Construct a frequency distribution, a relative frequency distribution, and a cumulative
frequency distribution using six classes.
26)
27) Construct a frequency histogram, a relative frequency histogram and a frequency polygon
using six classes.
27)
28) Construct an ogive using six classes.
28)
5
Provide an appropriate response.
29) Listed below are the ACT scores of 40 randomly selected students at a major university.
18
16
26
19
22
25
26
19
13
14
25
14
15
19
25
24
24
21
19
20
24
23
17
21
20
25
18
23
19
18
15
22
19
18
13
19
29)
12
13
21
17
a) Construct a relative frequency histogram of the data, using eight classes.
b) If the university wants to accept the top 90% of the applicants, what should the
minimum score be?
c) If the university sets the minimum score at 17, what percent of the applicants will be
accepted?
30) Explain the difference between class limits and class boundaries.
30)
MULTIPLE CHOICE. Choose the one alternative that best completes the statement or answers the question.
Match the description of the sample with the correct plot.
31) Time (in minutes) it takes a sample of employees to drive to work
A)
B)
C) Key: 7 2 = 72
6 89
7 0233678
8 2456778
9 0115
D) Key: 0 9 = 0.9
0 9
1 49
2 3678
3 01568
4 0
6
31)
SHORT ANSWER. Write the word or phrase that best completes each statement or answers the question.
Provide an appropriate response.
32) The numbers of home runs that Sammy Sosa hit in the first 15 years of his major league
baseball career are listed below. Make a stem-and-leaf plot for this data. What can you
conclude about the data?
32)
4 15 10 8 33 25 36 40 36 66 63 50 64 49 40
33) The numbers of home runs that Barry Bonds hit in the first 18 years of his major league
baseball career are listed below. Make a stem-and-leaf plot for this data. What can you
conclude about the data?
16
33
25
42
24
40
19
37
33
34
25
49
34
73
46
46
33)
37
45
MULTIPLE CHOICE. Choose the one alternative that best completes the statement or answers the question.
34) For the stem-and-leaf plot below, what is the maximum and what is the minimum entry?
34)
Key : 11 9 = 11.9
11 6 9
12 4 6 6 7 8 9
13 0 1 1 2 3 6 6 7 8 8
14 3 4 6 6 8 9 9 9
15 0 1 1 2 3 7 7 8 9
16 2 2 5 7 8 8 9 9
17 7 8
A) max: 17.8; min: 11.9
C) max: 17.7; min: 11.6
B) max: 17.8; min: 11.6
D) max: 178; min: 116
35) For the dot plot below, what is the maximum and what is the minimum entry?
A) max: 14; min: 12
C) max: 54; min: 12
B) max: 54; min: 15
D) max: 17; min: 12
7
35)
SHORT ANSWER. Write the word or phrase that best completes each statement or answers the question.
36) The heights (in inches) of 30 adult males are listed below. Construct a stem-and-leaf chart
for the data.
What can you conclude about the data?
36)
70 72 71 70 69 73 69 68 70 71
67 71 70 74 69 68 71 71 71 72
69 71 68 67 73 74 70 71 69 68
37) The Highway Patrol, using radar, checked the speeds (in mph) of 30 passing motorists at a
checkpoint. The results are listed below. Construct a stem-and-leaf plot for the data,
listing each stem twice. What can you conclude about the data?
44
35
50
38
40
41
41
37
47
50
41
36
36
43
35
36
50
40
43
45
42
42
45
43
49
39
48
37)
48
38
33
MULTIPLE CHOICE. Choose the one alternative that best completes the statement or answers the question.
38) Display the data below in a stem-and-leaf plot.
38)
A)
B)
6 0466788899
7 0224579
8 1
6 0455677799
7 0224589
8 1
C)
D)
5
6
7
8
9
456688899
0114589
1
5
6
7
8
0
0
7
1
SHORT ANSWER. Write the word or phrase that best completes each statement or answers the question.
39) The Highway Patrol, using radar, checked the speeds (in mph) of 30 passing motorists at a
checkpoint. The results are listed below. Construct a dot plot for the data.
44
35
50
38
40
41
41
37
47
50
41
36
36
43
35
36
50
40
43
45
42
42
45
43
49
39
48
48
38
33
8
39)
40) The heights (in inches) of 30 adult males are listed below. Construct a dot plot for the data.
70
67
69
72
71
71
71
70
68
70
74
67
69
69
73
73
68
74
69
71
70
68
71
71
40)
70 71
71 72
69 68
41) A study was conducted to determine how people get jobs. Four hundred subjects were
randomly selected and the results are listed below.
41)
Job Sources of
Survey Respondents Frequency
Newspaper want ads
69
Online services
124
Executive search firms
72
Mailings
32
Networking
103
Construct a pie chart of the data.
42) A study was conducted to determine how people get jobs. Four hundred subjects were
randomly selected and the results are listed below.
42)
Job Sources of
Survey Respondents Frequency
Newspaper want ads
72
Online services
124
Executive search firms
69
Mailings
32
Networking
103
Construct a Pareto chart of the data.
43) The heights (in inches) of 30 adult males are listed below. Construct a Pareto chart for the
data.
70
67
69
72
71
71
71
70
68
70
74
67
69
69
73
73
68
74
69
71
70
68
71
71
70
71
69
43)
71
72
68
44) Use a scatter plot to display the data below. All measurements are in milligrams per
cigarette.
Brand
Tar Nicotine
Benson & Hedges 16
1.2
Lucky Strike
13
1.1
Marlboro
16
1.2
Viceroy
18
1.4
True
6
0.6
9
44)
45) The numbers of home runs that Barry Bonds hit in the first 10 years of his major league
baseball career are listed below. Use a scatter plot to display the data. Is there a
relationship between the home runs and the batting averages?
45)
Home Runs
16
25
24
19
33
25
34
46
37
33
Batting Average .223 .261 .283 .248 .301 .292 .311 .336 .312 .294
46) The data below represent the numbers of absences and the final grades of 15 randomly
selected students from a statistics class. Use a scatter plot to display the data. Is there a
relationship between the students' absences and their final grades?
Student
1
2
3
4
5
6
7
8
9
10
11
12
13
14
15
Number of Absences
5
6
2
12
9
5
8
15
0
1
9
3
10
3
11
Final Grade as a Percent
79
78
86
56
75
90
78
48
92
78
81
86
75
89
65
47) The data below represent the infant mortality rates and the life expectancies for seven
selected countries in Africa. Use a scatter plot to display the data.
Infant Mortality
Life Expectancy
63
45
199
31
71
51
61
47
67
39
35
70
1965
42
1985
30
1990
25
1995
25
10
2000
23
47)
194
37
48) The data below represent the smoking prevalence among U.S. adults over a 35-year
period. Use a time series chart to display the data. Describe any trends shown.
Year
Percent of Smokers
46)
48)
49) A safety engineer wishes to use the following data to show the number of deaths from the
collision of passenger cars with trucks on a particular highway. Use a time series chart to
display the data. Describe any trends shown.
Year
1930
1940
1950
1960
1970
1980
1990
2000
49)
Number of Deaths
12
17
22
21
16
13
11
12
50) Women were allowed to enter the Boston Marathon for the first time in 1972. Listed below
are the winning women's times (in minutes) for the first 10 years. Use a time series chart to
display the data.
Year 1972
Time 190
1973
186
1974
167
1975
162
1976
167
1977
168
1978
165
1979
155
1980
154
50)
1981
147
51) The five longest winning streaks for NCAA Men's Division I Basketball are listed below.
Construct a Pareto chart for the data.
51)
University
Number of Games
Indiana
57
San Francisco
51
UCLA
76
Marquette
56
Kentucky
54
52) The lengths, in kilometers, of the world's largest subway systems are listed below.
Construct a Pareto chart for the data.
52)
City
Length
Moscow
340
Paris
211
London
415
Tokyo
281
New York City 371
53) The number of beds in a sample of 24 hospitals are listed below. Construct a
stem-and-leaf plot for the data.
149
221
244
167
145
287
162
137
137
127
194
204
130
207
166
180
150
174
160
254
180
11
167
262
151
53)
54) The number of minutes that a dentist kept 20 patients waiting beyond their appointment
times are listed below. Construct a stem-and-leaf plot for the data.
12.9
10.7
12.1 9.6
10.0 13.0
9.8
9.7
11.5
11.4
13.0
12.8
10.5
11.9
10.3
9.3
15.7
9.6
11.3
10.1
55) A study was conducted to determine how certain families pay on their credit card
balances. Two hundred families with a household annual income between $25,000 and
$49,999 were randomly selected and the results are listed below. Construct a pie chart of
the data.
Payment schedule
Almost always pay off balance
Sometimes pay off balance
Hardly ever pay off balance
55)
Frequency
97
41
62
56) Of the 55 tornado fatalities in a recent year, the locations of the victims are listed below.
Construct a pie chart of the data.
Location
Mobile home
Permanent home
Vehicle
Business
Unknown
54)
56)
Fatalities
37
10
4
2
2
57) The data below represent the alcohol-related driving fatalities, in thousands, in the United
States over a 20-year period. Use a time series chart to display the data. Describe any
trends shown.
Year
1983 1985 1987 1989 1991 1993 1995 1997 1999 2001
Fatalities 25
23
24
22
20
18
18
17 17
17
12
57)
58) The graph below shows the number of car accidents occurring in one city in each of the
years 1 through 6. The number of accidents dropped in year 3 after a new speed limit was
imposed. Does the graph distort the data? How would you redesign the graph to be less
misleading?
58)
MULTIPLE CHOICE. Choose the one alternative that best completes the statement or answers the question.
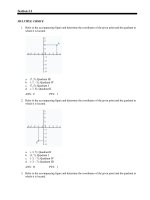
59) Determine whether the approximate shape of the distribution in the histogram is symmetric,
uniform, skewed left, skewed right, or none of these.
A) skewed right
B) uniform
C) skewed left
13
D) symmetric
59)
60) Determine whether the approximate shape of the distribution in the histogram is symmetric,
uniform, skewed left, skewed right, or none of these.
A) skewed right
B) symmetric
C) skewed left
60)
D) uniform
61) Find the mean, median, and mode of the data.
61)
A) x = 70; median = 69; mode = 67
B) x = 70; median = 67; mode = 69
C) x ≈ 70.3; median = 69; mode = 68
D) x ≈ 70.1; median = 69; mode = 68
For the given data , construct a frequency distribution and frequency histogram of the data using five classes. Describe
the shape of the histogram as symmetric, uniform, skewed left, or skewed right.
62) Data set: California Pick Three Lottery
62)
3 6 7 6 0 6 1 7 8 4
1 5 7 5 9 1 5 3 9 9
2 2 3 0 8 8 4 0 2 4
A) skewed left
B) symmetric
C) skewed right
D) uniform
63) Data set: California Pick Three Lottery
63)
8 6 7 6 0 9 1 7 8 4
1 5 7 5 9 7 5 3 9 9
8 8 3 9 8 8 9 0 2 7
A) symmetric
B) skewed left
C) skewed right
14
D) uniform
64) Data set: ages of 20 cars randomly selected in a student parking lot
12 6 4 9 11 1 7 8 9 8
9 13 5 15 7 6 8 8 2 1
A) skewed left
B) skewed right
C) symmetric
64)
D) uniform
65) Data set: systolic blood pressures of 20 randomly selected patients at a blood bank
135 120 115 132 136 124 119 145 98 110
125 120 115 130 140 105 116 121 125 108
A) skewed left
B) skewed right
C) symmetric
D) uniform
Provide an appropriate response.
66) Use the histogram below to approximate the mode heart rate of adults in the gym.
A) 70
B) 55
C) 42
B) 42
C) 65
15
66)
D) 2
67) Use the histogram below to approximate the median heart rate of adults in the gym.
A) 70
65)
D) 75
67)
68) Use the histogram below to approximate the mean heart rate of adults in the gym.
A) 70.8
B) 70
C) 31.6
68)
D) 1425.7
SHORT ANSWER. Write the word or phrase that best completes each statement or answers the question.
69) Find the mean, median, and mode of the following numbers:
69)
65 68 61 65 58 66 65 59 60 63
MULTIPLE CHOICE. Choose the one alternative that best completes the statement or answers the question.
70) The top 14 speeds, in miles per hour, for Pro-Stock drag racing over the past two decades are listed
below. Find the mean speed.
181.1
201.2
202.2
193.2
190.1
201.2
201.4
194.5
A) 210.9
191.3
199.2
201.4
196.0
192.2
196.2
B) 201.2
C) 195.8
D) 196.1
71) The scores of the top ten finishers in a recent golf tournament are listed below. Find the mean
score.
71
67
67
72
76
A) 67
72
73
68
72
72
B) 71
C) 72
D) 68
SHORT ANSWER. Write the word or phrase that best completes each statement or answers the question.
72) The numbers of runs batted in that Sammy Sosa hit in the first 15 years of his major league
baseball career are listed below. Find the mean and median number of runs batted in.
Round the mean to the nearest whole number.
13
119
70
158
33
141
25
138
93
160
70
108
119
103
70)
100
16
72)
71)
73) The numbers of home runs that Barry Bonds hit in the first 18 years of his major league
baseball career are listed below. Find the mean and median number of home runs. Round
the mean to the nearest whole number. Which measure of central tendency- the mean or
the median- best represents the data? Explain your reasoning.
16
33
25
42
24
40
19
37
33
34
25
49
34
73
46
46
73)
37
45
MULTIPLE CHOICE. Choose the one alternative that best completes the statement or answers the question.
74) The top 14 speeds, in miles per hour, for Pro-Stock drag racing over the past two decades are listed
below. Find the median speed.
181.1
201.2
202.2
193.2
190.1
201.2
201.4
194.5
A) 201.2
191.3
199.2
201.4
196.0
192.2
196.2
B) 196.1
C) 195.8
D) 196.7
75) The scores of the top ten finishers in a recent golf tournament are listed below. Find the median
score.
67 67 68
71
72 72
72 72
A) 72
B) 71
202.2
193.2
190.1
201.2
201.4
194.5
C) 73
191.3
199.2
201.4
196.0
D) 67
B) 201.4
D) 201.2
77) The scores of the top ten finishers in a recent golf tournament are listed below. Find the mode
score.
71 67 67 72 76 72 73 68 72 72
B) 76
C) 72
D) 67
SHORT ANSWER. Write the word or phrase that best completes each statement or answers the question.
78) The amounts of money won by the top ten finishers in a recent Daytona 500 are listed
below. Find the mean and median winnings. Round to the nearest dollar. Which measurethe mean or the median- best represents the data? Explain your reasoning.
$2,194,246
$613,659
$464,084
$142,884
76)
192.2
196.2
A) bimodal: 201.2, 201.4
C) no mode
A) 73
75)
73 76
76) The top 14 speeds, in miles per hour, for Pro-Stock drag racing over the past two decades are listed
below. Find the mode speed.
181.1
201.2
74)
$164,096
$240,731
$199,209
$145,809
$438,834
$290,596
17
78)
77)
MULTIPLE CHOICE. Choose the one alternative that best completes the statement or answers the question.
79) A student receives test scores of 62, 83, and 91. The student's final exam score is 88 and homework
score is 76. Each test is worth 20% of the final grade, the final exam is 25% of the final grade, and
the homework grade is 15% of the final grade. What is the student's mean score in the class?
A) 76.6
B) 80.6
C) 90.6
D) 85.6
79)
80) Grade points are assigned as follows: A = 4, B = 3, C = 2, D = 1, and F = 0. Grades are weighted
according to credit hours. If a student receives an A in a four-credit class, a D in a two-credit class,
a B in a three-credit class and a C in a three-credit class, what is the student's grade point average?
A) 1.75
B) 2.75
C) 3.00
D) 2.50
80)
Approximate the mean of the frequency distribution.
81)
Miles (per day) Frequency
1-2
15
3-4
28
5-6
11
7-8
14
9-10
9
A) 5
B) 15
81)
C) 4
D) 6
82)
82)
Phone calls (per day) Frequency
8-11
37
12-15
49
16-19
17
20-23
46
24-27
39
A) 18
B) 17
C) 16
D) 38
E) 19
83)
83)
Weight (in pounds) Frequency
135-139
7
140-144
12
145-149
10
150-154
11
155-159
20
A) 151
B) 12
C) 147
D) 149
SHORT ANSWER. Write the word or phrase that best completes each statement or answers the question.
Provide an appropriate response.
84) What is the difference between using μ and x to represent a mean?
84)
85) Why do data entries need to be ordered before the median can be found?
85)
86) On a recent Statistics test, the scores were 15, 66, 66, 81, 82, 83, 85, 88, 90, 92, 93, and 95. Is
the mean a good representation of the center of data? If not, why?
86)
18
87) On a recent Statistics test, the scores were 15, 66, 66, 81, 82, 83, 85, 88, 90, 92, 93, and 95. Is
the mode a good representation of the center of data? If not, why?
87)
MULTIPLE CHOICE. Choose the one alternative that best completes the statement or answers the question.
88) On a recent Statistics test, the scores were 61, 66, 68 , 82, 84, 86, 88, 90, 92, and 97. Find the 10%
trimmed mean of this data.
A) 77
B) 38.5
C) 85
D) 82
88)
89) The lengths of phone calls from one household (in minutes) were 2, 4, 6, 7, and 10 minutes. Find
the midrange for this data.
A) 6 minutes
B) 7 minutes
C) 10 minutes
D) 2 minutes
89)
90) The cost of five homes in a certain area is given.
90)
$141,000 $149,000 $169,000 $139,000 $1,219,000
Which measure of central tendency should be used?
A) mode
B) median
C) mean
D) midrange
91) The cost of five homes in a certain area is given.
91)
$186,000 $194,000 $214,000 $184,000 $1,264,000
List any outlier(s).
A) $1,264,000
C) $186,000
B) $1,264,000 and $186,000
D) There are no outliers.
92) The cost of five homes in a certain area is given.
92)
$206,000 $214,000 $234,000 $204,000 $1,284,000
Calculate the midrange.
A) $540,000
B) $1,080,000
C) $428,400
D) $214,000
93) For the stem-and-leaf plot below, find the range of the data set.
93)
Key: 2 7 = 27
1
2
2
3
3
4
4
6
7
0
6
0
5
6
7
1
6
3
A) 43
6
7
1
6
7
8
2
7
8
8
3
8
9
9 9 9
4 4 5
8 9
B) 29
C) 37
19
D) 14
94) Find the range of the data set represented by the graph.
A) 6
B) 5
C) 20
94)
D) 17
95) The grade point averages for 10 students are listed below. Find the range of the data set.
2.0 3.2 1.8 2.9 0.9 4.0 3.3 2.9 3.6 0.8
A) 2.8
B) 2.45
C) 1.4
D) 3.2
96) The heights (in inches) of 20 adult males are listed below. Find the range of the data set.
70 72 71 70 69 73 69 68 70 71
67 71 70 74 69 68 71 71 71 72
A) 6.5
B) 7
C) 6
6 15
A) 6.3
9
11
22
1
4
97)
8 19
B) 6.8
C) 2.1
D) 7.1
98) Find the sample standard deviation.
15
42 53
A) 29.1
7
9
12
14
98)
28 47
B) 15.8
C) 17.8
D) 16.6
99) Find the sample standard deviation.
22
29 21
A) 2.8
24
27
28
96)
D) 5
97) Find the sample standard deviation.
2
95)
99)
25 36
B) 1.6
C) 4.8
D) 4.2
100) The heights (in inches) of 10 adult males are listed below. Find the sample standard deviation of
the data set.
70 72 71 70 69 73 69 68 70 71
A) 70
B) 3
C) 1.49
20
D) 2.38
100)
101) Sample annual salaries (in thousands of dollars) for public elementary school teachers are listed.
Find the sample standard deviation.
17.0 10.7 38.7 32.1 16.4 15.9
A) 35.40
B) 10.97
C) 2851.44
101)
D) 3453.36
SHORT ANSWER. Write the word or phrase that best completes each statement or answers the question.
102) The heights (in inches) of all 10 adult males in an office are listed below. Find the
population standard deviation and the population variance.
102)
70 72 71 70 69 73 69 68 70 71
103) In a random sample, 10 students were asked to compute the distance they travel one way
to school to the nearest tenth of a mile. The data is listed below. Compute the range,
standard deviation and variance of the data.
103)
1.1 5.2 3.6 5.0 4.8 1.8 2.2 5.2 1.5 0.8
MULTIPLE CHOICE. Choose the one alternative that best completes the statement or answers the question.
104) Without performing any calculations, use the stem-and-leaf plots to determine which statement is
accurate.
(i) 0
1
2
3
4
9
58
3377
25
1
(ii)
10
11
12
13
14
9
58
3377
25
1
(iii) 0
1 5
2 33337777
3 5
4
A) Data set (ii) has the greatest standard deviation.
B) Data sets (i) and (iii) have the same range.
C) Data sets (i) and (ii) have the same standard deviation.
D) Data set (i) has the smallest standard deviation.
21
104)
105) You are asked to compare three data sets. Without calculating, determine which data set has the
greatest sample standard deviation and which has the least sample standard deviation.
105)
(i)
(ii)
(iii)
A) Greatest sample standard deviation: (iii)
Least sample standard deviation: (i)
C) Greatest sample standard deviation: (i)
Least sample standard deviation: (iii)
B) Greatest sample standard deviation: (i)
Least sample standard deviation: (ii)
D) Greatest sample standard deviation: (iii)
Least sample standard deviation: (ii)
106) You are asked to compare three data sets. Without calculating, determine which data set has the
greatest sample standard deviation and which has the least sample standard deviation.
(i)
(ii)
2
3
4
5
6
6
4
003399
8
1
(iii)
2
3 4
4 00033399
5 8
6
2
3
4
5
6
A) Greatest sample standard deviation: (iii)
Least sample standard deviation: (ii)
C) Greatest sample standard deviation: (i)
Least sample standard deviation: (ii)
6
45
0399
89
1
B) Greatest sample standard deviation: (i)
Least sample standard deviation: (iii)
D) Greatest sample standard deviation: (iii)
Least sample standard deviation: (i)
22
106)
SHORT ANSWER. Write the word or phrase that best completes each statement or answers the question.
107) You need to purchase a battery for your car. There are two types available. Type A has a
mean life of five years and a standard deviation of one year. Type B has a mean life of five
years and a standard deviation of one month. Both batteries cost the same. Which one
should you purchase if you are concerned that your car will always start? Explain your
reasoning.
107)
108) Here are the batting averages of Sammy Sosa and Barry Bonds for 13 recent years. Which
player is more consistent? Explain your reasoning.
108)
Sammy Sosa
Barry Bonds
0.300 0.268
0.312 0.294
0.203
0.292
0.273
0.308
0.260
0.311
0.251
0.291
0.261
0.336
0.308 0.288 0.320 0.328 0.288 0.279
0.303 0.262 0.306 0.328 0.370 0.341
109) You are the maintenance engineer for a local high school. You must purchase fluorescent
light bulbs for the classrooms. Should you choose Type A with μ = 3000 hours and
σ = 200 hours, or Type B with μ = 3000 hours and σ = 250 hours?
109)
MULTIPLE CHOICE. Choose the one alternative that best completes the statement or answers the question.
110) The mean IQ score of adults is 100, with a standard deviation of 15. Use the Empirical Rule to find
the percentage of adults with scores between 70 and 130. (Assume the data set has a bell-shaped
distribution.)
A) 100%
B) 68%
C) 95%
D) 99.7%
110)
111) The mean score of a placement exam for entrance into a math class is 80, with a standard deviation
of 10. Use the Empirical Rule to find the percentage of scores that lie between 60 and 80. (Assume
the data set has a bell-shaped distribution.)
A) 34%
B) 68%
C) 95%
D) 47.5%
111)
112) The mean IQ score of students in a particular calculus class is 110, with a standard deviation of 5.
Use the Empirical Rule to find the percentage of students with an IQ above 120. (Assume the data
set has a bell-shaped distribution.)
A) 11.15%
B) 2.5%
C) 15.85%
D) 13.5%
112)
113) The mean score of a competency test is 65, with a standard deviation of 4. Use the Empirical Rule
to find the percentage of scores between 53 and 77. (Assume the data set has a bell-shaped
distribution.)
A) 68%
B) 99.7%
C) 50%
D) 95%
113)
114) The mean score of a competency test is 82, with a standard deviation of 2. Between what two
values do about 99.7% of the values lie? (Assume the data set has a bell-shaped distribution.)
A) Between 74 and 90
B) Between 78 and 86
C) Between 80 and 84
D) Between 76 and 88
114)
23
115) The mean length of a human pregnancy is 266 days, with a standard deviation of 9 days. Use the
Empirical Rule to determine the percentage of women whose pregnancies are between 257 and
275 days. (Assume the data set has a bell-shaped distribution.)
A) 68%
B) 99.7%
C) 50%
D) 95%
115)
116) The mean SAT verbal score is 462, with a standard deviation of 98. Use the Empirical Rule to
determine what percent of the scores lie between 462 and 560. (Assume the data set has a
bell-shaped distribution.)
A) 49.9%
B) 47.5%
C) 68%
D) 34%
116)
117) The mean SAT verbal score is 486, with a standard deviation of 95. Use the Empirical Rule to
determine what percent of the scores lie between 391 and 486. (Assume the data set has a
bell-shaped distribution.)
A) 34%
B) 49.9%
C) 47.5%
D) 68%
117)
118) The mean SAT verbal score is 500, with a standard deviation of 100. Use the Empirical Rule to
determine what percent of the scores lie between 500 and 700. (Assume the data set has a
bell-shaped distribution.)
A) 34%
B) 49.9%
C) 47.5%
D) 68%
118)
119) The mean SAT verbal score is 490, with a standard deviation of 96. Use the Empirical Rule to
determine what percent of the scores lie between 298 and 586. (Assume the data set has a
bell-shaped distribution.)
A) 68%
B) 83.9%
C) 81.5%
D) 34%
119)
120) The mean monthly rent for a sample of studio apartments in one city is $1200 with a standard
deviation of $210. The monthly rents for eight more studio apartments in the city are listed. Using
the sample statistics above, determine which of the data values are unusual. Are any of the data
values very unusual? Explain. (Assume the data set has a bell-shaped distribution.)
$1074, $1536, $1641, $528, $801, $1662, $1347, $696
A) $528 is unusual because it is more than 3 standard deviations from the mean. There are no
values that are very unusual because no value is more than 4 standard deviations from the
mean.
B) $1641, $528, $1662, $696 are unusual because they are more than 2 standard deviations from
the mean. $528 is very unusual because it is more than 3 standard deviations from the mean.
C) $1641, $528, $801, $1662, $696 are unusual because they are more than 2 standard deviations
from the mean. $528 and $696 are very unusual because they are more than 3 standard
deviations from the mean.
D) $1536, $1641, $528, $801, $1662, $696 are unusual because they are more than 1 standard
deviation from the mean. $1641, $528, $1662, $696 are very unusual because they are more
than 2 standard deviations from the mean.
120)
SHORT ANSWER. Write the word or phrase that best completes each statement or answers the question.
121) Heights of adult women have a mean of 63.6 in. and a standard deviation of 2.5 in. Does
Chebyshev's Theorem say about the percentage of women with heights between 58.6 in.
and 68.6 in.?
121)
122) Heights of adult women have a mean of 63.6 in. and a standard deviation of 2.5 in. Apply
Chebyshev's Theorem to the data using k = 3. Interpret the results.
122)
24
MULTIPLE CHOICE. Choose the one alternative that best completes the statement or answers the question.
Use the grouped data formulas to find the indicated mean or standard deviation.
123) The salaries of a random sample of a company's employees are summarized in the frequency
distribution below. Approximate the sample mean.
123)
Salary ($) Employees
5,001-10,000
16
10,001-15,000
14
15,001-20,000
11
20,001-25,000
16
25,001-30,000
23
A) $18,500.50
B) $17,500
C) $16,650.45
D) $20,350.55
124) The speeds of a random sample of 100 cars are recorded as they pass a highway checkpoint. The
results are summarized in the frequency distribution below. Approximate the sample mean.
124)
Speed (mph) Cars
30-39
3
40-49
17
50-59
50
60-69
19
70-79
11
A) 59.1 mph
B) 54.5 mph
C) 61.9 mph
D) 56.3 mph
125) The manager of a bank recorded the amount of time a random sample of customers spent waiting
in line during peak business hours one Monday. The frequency distribution below summarizes the
results. Approximate the sample mean. Round your answer to one decimal place.
Waiting time Number of
(minutes)
customers
0-3
12
4-7
14
8 - 11
13
12 - 15
6
16 - 19
8
20 - 23
2
24 - 27
1
A) 13.5 min
B) 8.0 min
C) 9.1 min
25
D) 9.2 min
125)