Assessing coral bleaching and diseases in the ninh hai coastal waters of ninh thuan province under impacts of el nino in 2016
Bạn đang xem bản rút gọn của tài liệu. Xem và tải ngay bản đầy đủ của tài liệu tại đây (1.87 MB, 49 trang )
MINISTRY OF EDUCATION AND TRAINING
NHA TRANG UNIVERSITY
THAI MINH QUANG
ASSESSING CORAL BLEACHING AND DISEASES IN THE
NINH HAI COASTAL WATERS OF NINH THUAN
PROVINCE UNDER IMPACTS OF EL NINO IN 2016
MASTER THESIS
KHANH HOA – 2017
MINISTRY OF EDUCATION AND TRAINING
NHA TRANG UNIVERSITY
THAI MINH QUANG
ASSESSING CORAL BLEACHING AND DISEASES IN THE
NINH HAI COASTAL WATERS OF NINH THUAN
PROVINCE UNDER IMPACTS OF EL NINO IN 2016
MASTER THESIS
Major:
Marine Ecosystem Management
and Climate Change
Topic allocation Decision:
772/QD-ĐHNT date 20/9/2016
Decision on establishing the
Committee:
461/QD-ĐHNT date 16/05/2017
Defense date:
01/06/2017
Supervisors:
1. Assoc Prof. Vo Si Tuan
2. Prof. Sigurd Stefansson
3. Prof. Henrik Glenner
Chairman:
1. Assoc Prof. Ngo Dang Nghia
Faculty of Graduate Studies:
KHANH HOA – 2017
UNDERTAKING
I undertake that the thesis entitled: “Assessing coral bleaching and diseases in
the Ninh Hai coastal waters of Ninh Thuan province under impacts of El Nino in
2016” is my own work. The work has not been presented elsewhere for assessment
until the time this thesis is submitted.
Khanh Hoa, April 28, 2017
Thai Minh Quang
i
ACKNOWLEDGMENT
I would like to express the deepest appreciation to the Institute of Oceanography,
Nha Trang University and Nui Chua Nation Park for helping and giving best conditions
I finish my thesis.
My special thanks go to Assoc. Prof. Dr. Vo Si Tuan, Prof. Henrik Glenner and
Prof. Sigurd Stefansson for the continuous support of my master study and research, for
this patience, motivation, enthusiasm, immense knowledge and suggestions for
completing the report.
A very special gratitude goes out to all down at Department of marine living
resource - Institute of Oceanography for helping and providing the funding for the work.
With a special mention of Mr. Phan Kim Hoang, Mr. Hua Thai Tuyen and Mr. Mai Xuan
Dat for helping in field survey and collected data.
I would like to thank the NORHED project has provided a high quality master
program “Marine Ecosystem Management and Climate Change”.
And finally, last but not the least, I would like to thank my family: my parents,
my wife and my young sister for supporting me spiritually throughout writing this thesis.
Thanks for all your help!
Khanh Hoa, April 28, 2017
Thai Minh Quang
ii
TABLE OF CONTENTS
UNDERTAKING .............................................................................................................i
ACKNOWLEDGMENT ................................................................................................ ii
TABLE OF CONTENTS .............................................................................................. iii
LIST OF ABBREVIATIONS .........................................................................................v
LIST OF TABLES .........................................................................................................vi
LIST OF FIGURES ...................................................................................................... vii
ABTRACT................................................................................................................... viii
CHAPTER 1. INTRODUCTION ....................................................................................1
CHAPTER 2. REVIEW ..................................................................................................2
2.1.
Coral reef............................................................................................................2
2.2.
Ninh Hai coral reefs ...........................................................................................2
2.3.
Coral bleaching phenomenon ............................................................................3
2.4.
El Nino ...............................................................................................................4
2.5.
Forecast of Bleaching Alert Area ......................................................................4
2.6.
Coral bleaching in Vietnam ...............................................................................5
2.7.
Coral diseases .....................................................................................................6
CHAPTER 3. MATERIAL AND METHOD .................................................................8
3.1.
Research subjects ...............................................................................................8
3.2.
Second data and information .............................................................................8
3.2.1. Sea surface temperature data ..........................................................................8
3.2.2. Coral cover data ..............................................................................................8
3.3.
Location and time study .....................................................................................8
3.4.
Data collection ...................................................................................................9
3.4.1. For environmental parameter .........................................................................9
3.4.2. For biological parameter .................................................................................9
3.4.2.1.
Experimental setting ................................................................................9
3.4.2.2.
Measure techniques................................................................................10
3.5.
Data analysis ....................................................................................................11
3.5.1. Assessment of change coral cover during 2007-2016 ..................................11
3.5.2. Assessment ratio of coral bleaching and coral damage ................................12
3.5.3. Assessment coral disease ..............................................................................12
CHAPTER 4. RESULT AND DISCUSSION ..............................................................13
4.1.
Sea surface temperature (SST) during April and August 2016 .......................13
iii
4.2. Long-term changes in hard corals during 2007-2016 at three reef sites
monitoring ..................................................................................................................14
4.3. Assessment of coral bleaching and coral disease in 2016 under the influence
of El Nino ...................................................................................................................16
4.3.1. Assessment of coral bleaching .....................................................................16
4.3.1.1.
Ratio of coral bleaching on the benthic substrate. .................................16
4.3.1.2.
Coral bleaching response index .............................................................18
4.3.1.3.
Difference of coral bleaching between 2010 and 2016 .........................19
4.3.2. The status of coral disease in Ninh Hai reefs ...............................................20
4.4.
Resilience of scleractinian corals after bleaching events in 2016 ...................20
4.5.
Comparison the level bleaching among coral reef of Vietnam in 2016. .........22
CHAPTER 5. CONCLUSION AND RECOMMENDATION .....................................24
LIST OF REFERENCES ..............................................................................................25
APPENDICES ...............................................................................................................28
iv
LIST OF ABBREVIATIONS
NOAA: National Oceanic and Atmospheric
SST: Sea Surface Temperature
ONI: Oceanic Niño Index
BI: Bleaching index
HC: Hard coral
SC: Soft coral
SP: Sponges
RKC: Recent killed corals
DCA: Dead coral with algae
SW: Seaweeds
CA: Coralline algae
TA: Turf algae
RC: Rock (RC)
RB: Coral rubble
SD: Sand
SI: Silt/clay
OT: Others
v
LIST OF TABLES
Table 3.1: Reef sites monitoring. ....................................................................................8
Table 4.1: Mean coral cover (%) at Hang Rai (HR), Mui Thi (MT) và My Hoa (MH)16
Table 4.2: The change mean cover of some common genus coral................................18
Table 4.3: Coral bleaching response index in three sites reef .......................................19
Table 4.4: The rate (%) of common genus coral were bleached in 2010 and 2016 ......20
Table 4.5: Ratio of coral disease on the reef .................................................................20
Table 4.6: The extent of coral damage in three sites .....................................................21
Table 4.7: Mean substrate composition on the reef in some Vietnam reefs .................22
vi
LIST OF FIGURES
Figure 3.1: Limiting area for analysis SST data in CWS ................................................9
Figure 3.2: Reef sites monitoring ....................................................................................9
Figure 3.3: A transect line of 100 m long for surveys of benthos .................................10
Figure 3.4: A transect line of 100 m long for coral bleaching and coral disease ..........11
Figure 4.1: Sea surface temperature data analyzed from satellite. ...............................13
Figure 4.2: Sea surface temperature during May to August 2016.................................14
Figure 4.3: The trend of hard coral cover from 2007 to 2016 .......................................15
Figure 4.4: Mean percent cover (%) in June 2016 on the reefs.....................................15
Figure 4.5: Percent coral cover on reef slope (Deep) ....................................................17
Figure 4.6: Percent coral cover on reef flat (Shallow) ..................................................17
Figure 4.7: Vertical transects of the reef with large reef flat at My Hoa (a) and
incipient reefs at Bai Nho (b) and Hang Rai (c) ............................................................17
Figure 4.8: Genus Acropora and Montipora were bleached in May 2016 ....................21
Figure 4.9: Genus Acropora and Montipora were bleached in August 2016 ................21
Figure 4.10: Percent change in coral and macroalgae in Ninh Hai reefs ......................22
vii
ABTRACT
Coral reefs are one of the highly biodiversity ecosystems distributed in shallow
tropical sea waters and an important role in fisheries, shoreline protection and human
social economic development. However, world coral reefs are facing environmental
recession due to the effects of climate change and human activity. Climate change is the
change of environmental factors that can cause negative or positive impacts on coral reef
ecosystems. Recent studies show that climate change has increased the frequency of El
Niño activity which result increase sea surface temperature and is the main cause make
the coral bleaching. We are going to assess the reef status in Ninh Hai district at the
bleaching time based on the forecast data of NOAA Coral Reef Watch for 2016. The
primary objective of this study is to provide the basic understanding of coral bleaching,
coral diseases and coral reef resilience of Ninh Hai coral reef during and after the El
Niño phenomenon in 2016. Long term monitoring data of Ninh Hai coral reefs (Hang
Rai, Mui Thi and My Hoa reef sites) was reviewed for assessment status and trend of
coral reef during 2007 to 2016. Field trips were performed in May, June and August
2016. The parameters of coral reef component and number bleaching and disease
colonies were recorded in reef flat and reef slope by SCUBA divers. The result showed
Ninh Hai reefs underwent a mass bleaching event as a result of an increasing anomaly
of sea surface temperature under impacts of El Nino during in May to June 2016.
Bleaching occurred most severely in My Hoa reef site (20.69-27.16% coral bleached),
while in Hang Rai and Mui Thi suffers very little. The coral genera Montipora and
Acropora were most bleached. However, the severity of coral bleaching mortality (217%) was low in August. Ninh Hai coral reefs can resistant bleaching event (average
coverage of 32-44% on the reef), which could be an activity of the season upwelling in
this areas. At present, the Ninh Hai coral reef is not impressed by diseases. The ratio of
coral bleaching in Ninh Thuan was higher than that in Con Dao and Nha Trang, but the
lower than that in Phu Quoc Island. The conservation of Ninh Hai coral reefs is very
important to serve sources of coral larvae for other reefs in the South China Sea
Keywords: El Nino, reefs, coral bleaching, coral disease, Ninh Hai, Vietnam.
viii
CHAPTER 1. INTRODUCTION
Coral reefs are one of the highly biodiversity ecosystems distributed in shallow
tropical sea waters. Coral reefs, like tropical rainforests, play an important part in the
formation, nurturing, dispersing and reproducing of fisheries resources, contributing to
ensuring food security for humans. In addition to its important role in fisheries, coral
reefs also help shoreline protection by reducing wave energy before overflowing to the
shoreline, to minimize the risk of shoreline erosion. However, world coral reefs are
facing environmental recession due to the effects of climate change and human economic
development.
Climate alteration is the alteration of environmental agents that can cause
negative or positive impacts on coral reef ecosystems. The research on the effects of
climate change focus to ocean acidification, sea level rise and the rising of sea water
temperatures. In the above phenomena, the increase in sea water temperature is the most
noticeable impact on coral reefs. Coral bleaching is a sign of the coral's response as a
loss of color when sea water temperature increase abnormal in the area. The level of
bleaching and survival of the coral depends on the value and time storage of water
temperature in the incident area. The relationship between El Nino and coral bleaching
became clear when comparing the time series of two events.
El Niño was most active in 1998 when the world's coral reefs were severe
damaged. Therefore, coral reef monitoring program has been intensified since 1998 with
the purpose of assessing of the resilience of the corals. Therefore, in this study
"Assessing coral bleaching and diseases in the Ninh Hai coastal waters of Ninh Thuan
province under impacts of El Niño in 2016”, we are going to assess the reef status in
Ninh Hai district at the bleaching time based on the forecast data of NOAA Coral Reef
Watch for 2016. The details of reef benthic substrate and coral bleaching then will be
monitored with the concerns on other physical parameters related to coral reef resilience
such as water surface temperature or water exchange. The study provide the basic
understanding of coral bleaching and coral diseases during the El Niño phenomenon in
2016. The secondary objective is divided in two: (1) Assessment of coral bleaching and
coral disease in 2016 under the influence of El Niño. (2) Assessment of the scleractinian
corals resilience under the influence of El Niño.
1
CHAPTER 2. REVIEW
2.1.
Coral reef
Coral reefs, the “rainforests of the sea” are among the most biologically rich and
productive ecosystems on earth with total area is 284,803 km2 distribute in 17 reefs in
the world (Spalding et al. 2002; Wilkinson 2008). In many developing countries, they
also provide valuable benefits to the livelihood of coastal communities. Coral reefs play
important roles as reservoirs of biodiversity, for fisheries, and tourist development in
the coastal zone (Burke et al. 2011). Coral reefs are important habitats in the South China
Sea generally and Vietnam particularly. As the combined data from UNEP (2007) and
Burke et al. (2002), the total area of coral reefs in the coastal waters in the South China
Sea is approximately 930,000 ha. Coral reefs in the South China Sea have extraordinary
biodiversity with 571 species of scleractinian reef corals (Huang et al. 2015; Huang et
al. 2016) and over 3000 species of fish (Randall & Lim 2000). Vietnam coral reef is
located in the western South China Sea and considered as the richest of over 350 species
of hard corals distributed on 110,000 ha reefs (Ming Chou et al. 2002; Vo et al. 2013).
However, coral reefs have been threats by “over-fishing, use of destructive fishing
techniques, pollution (mainly eutrophication) and increased sedimentation; indirect
causes of these threats are unsustainable practices in the fisheries sector, coastal
development, deforestation and unsustainable tourism” (Vo et al. 2013).
2.2.
Ninh Hai coral reefs
The Ninh Hai district of Ninh Thuan Province, is located in south-central
Vietnam. With a shoreline of more than 40 km, the district includes 3 coastal communes.
The area receives moderate to high levels of wave energy seasonally, from wind- and
typhoon-generated swells, and cool waters (< 24oC) in coastal upwelling during summer
(Tuan et al. 2014). Ninh Hai Reef has an estimated total area more than 2.300 ha, which
is the largest reef area in Vietnam and belongs to the nature reserve of Nui Chua National
Park in Ninh Thuan province, where morphological reef is fringing reef (Tuan et al.
2014). There are 334 species of coral, 188 species of seaweed, 147 species of reef fish,
115 species of Mollusk, and 80 species of Crustaceans and 13 species of Echinodermata
(Tuấn et al. 2005).
2
The average cover of corals (including hard and soft coral) on the reef is about
21.1-30.5% (Long et al. 2013). Coral cover in Ninh Hai waters was significantly reduced
in 2003-2007, but remained relatively stable and tended to increase during 2007-2011.
Sustainability of coral cover before and after the bleaching event in 2010 shows that
coral reefs are highly adaptable (Long et al. 2013). Adaptability of Ninh Hai coral reef
may be related to the upwelling phenomenon of cold nutrition rich water in this area
during the summer. Upwelling phenomena in the region have brought cold water from
the deep sea to surface, which will reduce the temperatures of surface water (Dippner et
al. 2007) and thereby decrease the bleaching event. Resilience of corals at Ninh Hai
seems to be higher than in other areas without upwelling.
2.3.
Coral bleaching phenomenon
Sudden warming of sea temperatures in the long term will seriously impact the
reef leading to coral bleaching in the region this phenomenon occurs. Coral bleaching is
a stress response that results in the change of abiotic (sea surface temperature, irradiance,
salinity, ultraviolet radiation, etc.) and/or biotic factors (diseases). Bleaching is the
whitening of reef-building corals due to a reduction in their symbiotic dinoflagellate
zooxanthellae and/or loss of the pigments in the symbionts (Brown 1997). Symbiotic
algae provide photosynthetic products vital to meeting host energetic requirements for
the growth and development of corals. The reduced amount of symbiotic algae will be
disturbs the metabolism of the coral host and can lead to delayed or reduced
reproduction, tissue degradation, reduced growth, and death of the affected tissue (Bahr
et al. 2015).
The phenomenon of coral bleaching affecting extensive reef areas across the
Pacific was first described by Glynn in 1984. Since that date, coral bleaching has
occurred in the Caribbean, Indian, and Pacific Oceans on a regular basis in 1983—84,
1986—87, 1991, 1994 and 1996 (Brown 1997). The acknowledgment of the coral
bleaching phenomenon has been noted in other countries in the region since 1998, coral
bleaching in many areas including Vietnam (UNEP 2007). Coral bleaching has done
significant damage to coral reefs worldwide (16% of damaged reefs in 1998) and
decreased coral cover 50-90% (Obura & Grimsditch 2009).
3
Report on the status of coral in Asia Pacific in 2007, noted in 1999-2004 corals
signs of recovery. The resilience of the reef north of Southeast Asia have part better than
the Gulf of Thailand (UNEP 2007). Repeated bleaching is also a common feature at
many sites throughout the Caribbean and Pacific Oceans in 2010. Bleaching was
recorded in Southern Caribbean (Alemu I & Clement 2014), In the Southeast Pacific
Ocean corals bleached in the Thailand (Sutthacheep et al. 2013) and Vietnam (Long &
Vo 2013; Tun et al. 2010). Reports from these countries showed the more severe
bleaching in 2010 than in 1998 (Tun et al. 2010). The most affected area is the Gulf of
Thailand and the Andaman Sea (Sutthacheep et al. 2013; Tun et al. 2010).
2.4.
El Nino
El Niño and the Southern Oscillation, also known as ENSO is a periodic
fluctuation in sea surface temperature (El Niño) and the air pressure of the overlying
atmosphere (Southern Oscillation) across the equatorial Pacific Ocean (NOAA 2016).
El Niño is the abnormal warming of sea surface layer in the central region and eastern
equatorial Pacific Ocean, a change of one side will cause the reaction of the other side.
El Nino an oscillation of the system interact with large-scale to complex between the
atmosphere and ocean in the tropical Pacific. El Nino strongest before Christmas
(December each year) then may last until next year (NOAA 2016). NOAA has used
Oceanic Niño Index (ONI) become de-facto standard for identifying El Niño and La
Niña events in the tropical Pacific. Years with the ONI exceeds 0.5, the year will occur
El Niño phenomenon, and its intensity depends on the magnitude of the ONI with four
categorized as Weak (0.5 ÷ 0.9), Normal (1.0 ÷ 1.4), Strong (1.5 ÷ 1.9) and Very Strong
(> 2.0) (GGWS 2017).
2.5.
Forecast of Bleaching Alert Area
Studies on the model for predicting levels and areas of bleaching potential were
developed by the U.S. National Oceanic and Atmospheric Administration’s Coral Reef
Watch (NOAA CRW) (Heron et al. 2016). Bleaching Alert Area was localized by
analysis data from satellite sea surface temperature (SST). When SST exceeded forecasts
for a time long enough to observe a bleaching event, it became possible to provide four
level forecast maps of areas likely bleach (“Watch”, “Warning”, ”Alert Level 1” and
“Alert level 2”) (Liu et al. 2013; Heron et al. 2016).
4
Forecast results of NOAA showed that the Vietnamese coral reef had an Alert
level 1 for bleaching at the Phu Quoc Island and south central Vietnam (from Nha Trang
to Ninh Thuan province) in June 2010. Comparisons between the results predicted by
NOAA and the survey results of Nguyen Van Long et al (2013), indicated a 10,8% risk
for Alert level 1 bleaching event in the Ninh Thuan coral reef. The hard coral coverage
of the Ninh Hai reef were reduced in the period 2003-2007 but remained stable in the
period 2007-2009. After that bleaching event 2010 made for the mean coral cover
decrease on the reef. According to a forecast by NOAA in February 2016 the risk of
bleaching along Vietnamese reefs between May and June 2016 is at Alert level 1 in the
South West sea, and at Warning level in the central part of the country (Ninh Thuan
province to Con Dao Island).
2.6.
Coral bleaching in Vietnam
The coral bleaching in Vietnam in 1998 was first recorded in Con Dao Island
(October 1998) and Cu Lao Cau Island (May to August 1998). In the Con Dao reef was
bleaching 37% (0-74% between 11 survey stations) (Tuan 2000). In the Cu Lao Cau
Island, coral bleaching was recorded in May, but was not considered serious. However,
the survey results at September 1998 at Cu Lao Cau showed no bleaching, but many
reefs were found dead and covered by algae. This suggests that coral bleaching happened
between May and August (Tuan 2000). Coral reefs in Con Dao were bleached 20-100%
of it killed in 2005, because of sea water temperature increase combined with a decrease
of salinity over a period of 7 consecutive days (Bền et al. 2008).
The coral bleaching in 2010 were submitted in the reports of coral reef monitoring
in Khanh Hoa province, Ninh Thuan province and the Kien Giang province by Long et
al. (Long 2010; Long et al. 2010; Long et al. 2013). The time when bleaching occured
were different in Phu Quoc Island, Van Phong bay, Nha Trang bay, Cam Ranh bay and
Ninh Hai reefs with different damage levels.
Coral reef had a bleaching average of 56.6% (24.6-91.6% between the stations)
in May 2010 at Phu Quoc Islands where hard coral covered from 2.5% to 40.3% of the
stations (Long et al. 2010). The bleaching average of the Ninh Hai coral reef was 10.8%
(2.4-40% between the stations) with hard coral covering between 21.1 and 30, 5% at the
ten monitored station in June 2010 (Long et al. 2013). In waters around Khanh Hoa, the
5
assessment results from six fixed stations monitored in August 2010 showed that hard
coral covered from 6.3 to 41.9% of the shore and 3% (0-8.4% between the stations) of
the corals were bleached (Long 2010).
2.7.
Coral diseases
Corals are colonial animals that belong to the phylum Cnidaria that form polyps
with stinging cells. Hard (Scleractinian) corals secrete a skeleton of calcium carbonate
whereas soft corals, polyps secrete a proteinaceous skeleton (Work & Meteyer 2014).
Hard (Scleractinian) corals can be infected by bacteria, viruses and are influenced by the
shocks from the environment such as temperature, nutrients and toxins. Coral diseases
have been named as ‘‘coral disease, white syndrome, white plague, black band, yellow
blotch, yellow band, sea fan aspergillosis, dark spot, coral bleaching, white pox coral,
coral ciliate, coral fungus and coral virus (Work & Meteyer 2014). After infection, the
coral tissue will become inactive. In addition, the disease also changes the reproductive
rate, the rate of growth, community structure, species diversity and abundance of other
organisms in the reef (Raymundo et al. 2008). A number of studies indicate that disease
prevalence in areas of the Indo-Pacific region, American Samoa and Hawaii is currently
quite low (ICRI/UNEP-WCMC 2010). Some common coral diseases on the reefs of
tropical waters are: black band disease (BBD); Brown band disease (BRB); White
syndrome (WS); Ulcerative white spots (UWS); Skeletal eroding band (SEB).
Black band disease (BBD) is caused by bacteria, mainly Phormidium
corallyticum and bacteria species of the genus Beggiatoa (ICRI/UNEP-WCMC 2010).
These are most active when the water temperature rises to 28oC. The temperature
increases the severity of the disease since the nutrient content when the water
temperature decreases (Singer & Richardson n.d.). Recent studies by Garren et al. (2014)
on the correlation when corals are stressed by heat, the mucus releases DMSP around
the environment about five times higher, this high concentration of DMSP has a
chemotaxis that attracts (Garren et al. 2014).
The cause of Brown band disease (BRB) is still not determined, but researchers
have noted the emergence of single-celled organisms, ciliates, in the samples (Bourne et
al. 2008). White syndrome (WS) is the common name of the disease White Patches (WP)
and the White Band Disease (WBD). White Patches (WP) disease has two type: White
6
Patches type 1, type 2. The differences of the two types are based on the rate of infection,
or disease patterns affecting the species (Raymundo et al. 2008). White plague II in
Monastraea coral is caused by Gram-negative bacteria Aurantimonas coralicida (Denner
et al. 2003). White Band Disease type 1, type 2, it is recognized more in the Caribbean
(Raymundo et al. 2008). Acroporid white band I (White band I) has not been identified
(Bythell, J. & Sheppard 1993), while white band II (white band II) appears in many
species of corals and is known to be caused by Vibrio charcharvina (Ritchie & Smith
1998). Skeletal eroding band (SEB) induced by Halofolliculina corallasia was first
recorded in the Indo-Pacific (Page & Willis 2008).
The spread of the diseases in high biodiversity reefs with high coverage are higher
than in reefs that have low coverage. The health of corals after bleaching are very
weakened and susceptible to infections. An increase in coral diseases in the Great Barrier
Reef (GBR) were recorded after the bleaching events in 2002. The same was reported
from US Virgin Islands in 2005 and 2010.
7
CHAPTER 3. MATERIAL AND METHOD
3.1.
Research subjects
Coral Bleaching and Coral Disease
3.2.
Second data and information
3.2.1. Sea surface temperature data
The average water temperature data of the sea floor to the surface and standard
deviation (SD) is calculated from the NOAA satellite image source by Coast Watch
Software V 3.3.0 (CWS) limited in range 109oE-110oE and 11oN-12oN (Fig. 3.1). The
satellite images used from April 4, 2016 to August 31, 2016.
3.2.2. Coral cover data
Coral coverage data in three survey stations were referenced from the primary coral
reef monitoring data (2007-2014) made by Department of Marine Living Resource of
Institute of Oceanography. Data was reviewed from framework on monitoring coral
reefs of project's Ninh Thuan province and project's UNEP.
3.3.
Location and time study
The study was implemented during May, June and August, 2016 at Hang Rai, Mui
Thi and My Hoa reef sites (Table 3.1 and Fig. 3.2):
No.
1
2
3
Table 3.1: Reef sites monitoring.
Site
Latitude
Hang Rai
11.67717
Mui Thi
11.61808
My Hoa
11.60536
8
Longitude
109.18281
109.16124
109.15371
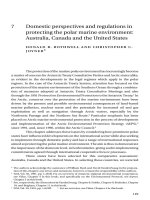
Figure 3.1: Limiting area for
analysis SST data in CWS
3.4.
Figure 3.2: Reef sites monitoring
Data collection
3.4.1. For environmental parameter
Water environment parameters including the sea water temperature (oC) and salinity
(‰) were recorded by the ultimate handheld sampling instrument HIROBA. The values
measured in two layer: surface (1 m) and bottom (>3 m depending on the depth of reef).
3.4.2. For biological parameter
3.4.2.1.
Experimental setting
Two transects were laid parallel to the depth contours (100m/transect); the shallow
contour located on the reef flat (2 - 5 m deep) and the deep contour on the reef slope
(from 6 - 10 m). The transect are divided into four individual 20 m transect lines (0 – 20
m, 25 – 45 m, 50 – 70 m, 75 – 95 m) (Fig. 3.3). The 5 m gap between each individual 20
m transect, allows independence of samples, avoiding replication and ensuring more
precise statistical analysis. These four segments are considered as replicates for each of
shallow or deep transect at each site. Methodology and selected parameters are assessed
9
using standard methods based on the Global Coral Reef Monitoring Network (GCRMN)
(English et al. 1997), Reefcheck protocols (Hodgson et al. 2006) and Coral disease
handbook (Raymundo et al. 2008).
1st Section
2nd Section
3rd Section
4th Section
(20m)
(20 m)
(20m)
(20m)
2
0
0
2
5
4
5
5
0
7
0
7
5
9
5
10
0
5m space
100 m
Figure 3.3: A transect line of 100 m long for surveys of benthos
3.4.2.2.
Measure techniques
Benthic substrate: Components are recorded at each 0.5m interval of the 20 m
long of each segment flowing the point-intercept survey method to record parameters of
coral reef component (Hodgson et al. 2006). Parameters of coral reef components
recorded including hard corals none-bleaching (HC), Coral Bleaching (BL), soft corals
(SC), recent killed corals (RKC), dead coral with algae (DCA), fleshy seaweeds (FS),
coralline algae (CA), turf algae (TA), sponges (SP), rock (RC), coral rubble (RB), sand
(SD), silt/clay (SI) and others (OT) were recorded. Total score recorded for each
segment is 40 points touch section. Additionally, coral genera recorded along transects
were used for estimating abundant level. Percentage of cover of each genus were
calculated based on records of their touch to 0.5m point as for benthic component cover.
Coral bleaching index: Bleached colonies were counted for more quantitative
survey in the twenty 1m2 quadrats along the 100m length of each transects (Figure 3.4).
There was an interval of 5 m between two quadrats. The total of 40 quadrats were
monitored including 20 of them at the reef flat and 20 others at the reef slope. In addition,
photos of each quadrat was be taken for further analysis.
10
1st transect
(20m)
2nd transect
(20m)
20
0
25
3rd transect
(20m)
45
50
4th transect
(20m)
70
75
95
100
Figure 3.4: A transect line of 100 m long for coral bleaching and coral disease
Coral bleaching was recorded and estimated per hard coral colonies at each
quadrat and assigned to one of seven categories: (1) nomarl, (2) 1-10% of the suface
bleached, (3): 11-30% bleached, (4) 31-50% bleached, (5) 51-75% bleached, (6) 76100% bleached, (7) dead.
Similar to coral bleaching level, coral damage also was surveyed at six levels
(Level 1: normal; Level 2: 1-10%; Level 3: 11-30%; Level 4: 31-50%; Level 5: 51-75%;
Level 6: 76-100%).
Coral diseases: Diseases colonies were counted for more quantitative survey in
the twenty 1m2 quadrats along the 100m length of each transects (Figure 3). There was
an interval of 5 m between two quadrats (0; 5; 10; 15; 20 … 95). The total of 40 quadrats
were monitored including 20 of them at the reef flat and 20 others at the reef slope. The
disease was recorded including Black band disease (BBD); Brown band disease (BRB);
White syndrome (WS); Ulcerative white spots (UWS); Skeletal eroding band (SEB).
The coral disease was photographed and described.
3.5.
Data analysis
3.5.1. Assessment of change coral cover during 2007-2016
Benthic substrate coverage and ratio coral bleached during 2007-2014 and June
2016 were calculated according to the rate of individual components for each section 20
m (Formula 1). After that percent cover of each benthic substrate was estimated average
for 4 section flowing transect and sites.
𝐵𝑒𝑛𝑡ℎ𝑖𝑐 𝑠𝑢𝑏𝑠𝑡𝑟𝑎𝑡𝑒 =
𝑇𝑜𝑡𝑎𝑙 𝑛𝑢𝑚𝑏𝑒𝑟 𝑜𝑓 𝑝𝑜𝑖𝑛𝑡 𝑒𝑎𝑐ℎ 𝑝𝑎𝑟𝑎𝑚𝑒𝑡𝑒𝑟
𝑥 100% (1)
40
Data of coral cover were analyzed and compared among different year, sites,
using a one way analysis of variance (ANOVA).
11
3.5.2. Assessment ratio of coral bleaching and coral damage
Coral bleaching data was analyzed in two directions: (A) Ratio of coral bleached
on benthic substrate. (B) The number coral colonies were bleached in quadrat 1m2.
The ratio of coral gets bleached on benthic substrate was calculated according to
the formula (2)
𝑅𝑎𝑡𝑖𝑜 𝑜𝑓 𝑐𝑜𝑟𝑎𝑙 𝑏𝑙𝑒𝑎𝑐ℎ𝑒𝑑 =
𝑃𝑒𝑟𝑐𝑒𝑛𝑡 𝑐𝑜𝑟𝑎𝑙 𝑏𝑙𝑒𝑎𝑐ℎ𝑖𝑛𝑔 𝑐𝑜𝑣𝑒𝑟 (𝐵𝐿)
𝑥 100% (2)
𝑃𝑒𝑟𝑐𝑒𝑛𝑡 𝑡𝑜𝑡𝑎𝑙 𝑐𝑜𝑟𝑎𝑙 𝑐𝑜𝑣𝑒𝑟 (𝑇𝐻𝐶)
Ratio of coral bleaching and mortality were estimated for each categories in each
quadrat 1m2. In which the ratio of each categories is calculated from the number of coral
colonies divide total colonies (formula 3 & 4).
After that, the average of ratio of each categories coral bleaching and mortality
were estimated for transect and sites. Total have 20 reification of each category in each
transect, 40 reification for each site.
𝑛
𝑅𝑎𝑡𝑖𝑜 𝑜𝑓 𝐶𝑎𝑡𝑒𝑔𝑜𝑟𝑖𝑒𝑠 (𝐶𝑖 ) = 𝑖 𝑥 100% (3)
𝑁
Ci: The percent of each bleached category (i = 1-7)
ni: The number colonies of each categories
N: Total colonies were recoded in quadrat
𝑎
𝑅𝑎𝑡𝑖𝑜 𝑜𝑓 𝑚𝑜𝑟𝑡𝑎𝑙𝑖𝑡𝑦 (𝑀𝑖 ) = 𝑖 𝑥 100% (4)
𝑁
Mi: The percent of each damage category (i = 1-6)
ai: The number colonies of each damage categories
N: Total colonies were recoded in quadrat
Coral beaching index (BI) value was modify from formula of McClanahan et al.
(2005, 2007) (McClanahan et al. 2005; McClanahan et al. 2007). c1-7 were estimated
from formula 3.
𝐵𝐼 =
(0𝑐1+1𝑐2+2𝑐3+3𝑐4+4𝑐5+5𝑐6+6𝑐7)
6
(5)
3.5.3. Assessment coral disease
Percentage of each disease was calculated according to the formula 6 from the
ratio of the number of disease colonies and the total number of coral disease colonies.
𝑅𝑎𝑡𝑖𝑜 𝑜𝑓 𝑒𝑎𝑐ℎ 𝑑𝑖𝑠𝑒𝑎𝑠𝑒 =
𝑇𝑜𝑡𝑎𝑙 𝑛𝑢𝑚𝑏𝑒𝑟 𝑜𝑓 𝑒𝑎𝑐ℎ 𝑑𝑖𝑠𝑒𝑎𝑠𝑒 𝑐𝑜𝑙𝑜𝑛𝑖𝑒𝑠
𝑥 100% (6)
𝑇𝑜𝑡𝑎𝑙 𝑛𝑢𝑚𝑏𝑒𝑟 𝑜𝑓 𝑐𝑜𝑟𝑎𝑙 𝑑𝑖𝑠𝑒𝑎𝑠𝑒 𝑐𝑜𝑙𝑜𝑛𝑖𝑒𝑠
12
CHAPTER 4. RESULT AND DISCUSSION
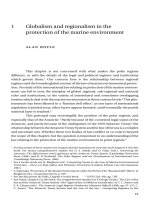
4.1.
Sea surface temperature (SST) during April and August 2016
Sea surface temperature values (SST) by analysis of satellite images and field survey
showed SST increase during April to May of 2016 (from 29 to 31oC). After that SST
reduced to 23-24°C at both layers of water at the time of reef monitoring in June, 2016
(Fig. 4.1 & 4.2). During the August 2016 seawater temperature changes among from 27
to 29oC. The difference of temperature among site, time study were about 0.5oC
(Appendix 3).. There was no signification among sites, in surface and bottom layers for
each field survey with P value >0.05. The salinity of seawater remained stable at over
34 ‰ at three sites, indicating that the study area was not affected by fresh water
(Appendix 2). Therefore, Thermal stress is the cause of the bleaching phenomenon.
31.5
31
30.5
SST (OC)
30
29.5
29
28.5
28
27.5
27
Figure 4.1: Sea surface temperature data analyzed from satellite.
13
Sea Surface temperature
(oC)
May
34
32
30
28
26
24
22
20
18
16
14
12
10
Deep
Shallow
Deep
Hang Rai
Shallow
Mui Thi
June
August
Deep
Shallow
My Hoa
Figure 4.2: Sea surface temperature during May to August 2016
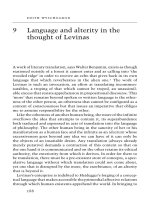
4.2.
Long-term changes in hard corals during 2007-2016 at three reef sites
monitoring
The average pattern of coral cover did not vary greatly from 2007 to 2010. Mean
coral cover is almost maintained at an average of 37.53% on reefs from 2007-2009, and
declined to 35.31% in 2010 by bleaching events. The historical data show that bleaching
events occurred between May and July 2010 that reduced the hard coral cover range 510% in each site monitoring (Fig. 4.3). After that coral recover on the reef in 2011, mean
coral recover higher than one year ago (Mean±SE: 44.79±3.07%) (Fig. 4.3). The results
monitoring in 2011 at Hang Rai, Mui Thi and My Hoa showed that the corals were high
adaptable and resilient (increasing from 10-20% of hard coral cover in each region
compared to 2010). From 2011 to 2012, coral cover was reduced to 35% on reefs at all
three monitoring stations (Fig. 4.3). After that coral recover on the reefs in the period
from 2012 to 2014. This fluctuations increased the coral cover from 35.52% to 55%.
From 2014 to 2016 the coral cover decreased 40.94%.
14
90
80
Coral cover ± SE (%)
70
60
50
40
30
20
10
0
2007 2008 2009 2010 2011 2012 2013 2014 2015 2016
Hang Rai
Mui Thi
My Hoa
Average changes in coral cover
Figure 4.3: The trend of hard coral cover from 2007 to 2016
Result of field trip in 2016 showed healthy reefs with the main benthic substrate
cover was hard coral (Mean±SE: 40.94±3.37%; range: 35-50.63%), which developed
on rock structure (Mean±SE: 32.5±3.81%) (Fig. 4.4). Mean percent macro-algae cover
(NIA) was poor (Mean±SE: 8.75±1.36%), which including the seaweed (Mean±SE:
5.10±1.19), coralline algae (Mean±SE: 1.56±0.49%), and turf algae (Mean±SE:
2.08±0.65%). The mean of soft coral and sponges were very low (<0.20%) and
uncommon on the reef at three sites monitoring. The mean percent of recent killer coral
(RKC) by bleaching in this time about 2.40±1.46%. The other composition including
ruble, dead coral with algae and sand cover 14.69% on the reefs.
50
Mean Percent Cover ± SE (%)
45
40
35
30
25
20
15
10
5
0
HC
SC
NIA
OT
SP
RKC
DCA
RB
RC
SD
Figure 4.4: Mean percent cover (%) in June 2016 on the reefs
15