Các Linh Kiện Điện Tử Cơ Bản
Bạn đang xem bản rút gọn của tài liệu. Xem và tải ngay bản đầy đủ của tài liệu tại đây (1.37 MB, 56 trang )
Getting Started with DASYLab
Getting Started with DASYLab
National Instruments Ireland Resources Limited
September 2005
374212A-01
English-Language Support and Distribution
Americas
CEC Capital Equipment
6 Bedford Farms
Bedford, NH 03110 USA
Tel.: +1 603 472 1068
Fax: +1 603 472 1069
E-Mail:
www.cec488.com
Worldwide - Outside the Americas
measX GmbH & Co.KG
Trompeterallee 110
41189 Moenchengladbach
Germany
Tel.: +49 2166 9520-0
Fax: +49 2166 9520-20
E-Mail:
www.measx.com
Worldwide Support and Distribution
www.dasylab.com
© 2005 National Instruments Ireland Resources Limited. All Rights Reserved.
Important Information
Warranty
DASYLab is warranted against defects in materials and workmanship for a period of 90 days from the date of shipment, as evidenced by
receipts or other documentation. National Instruments will, at its option, repair or replace equipment that proves to be defective during the
warranty period. This warranty includes parts and labor.
The media on which you receive National Instruments software are warranted not to fail to execute programming instructions, due to defects
in materials and workmanship, for a period of 90 days from date of shipment, as evidenced by receipts or other documentation. National
Instruments will, at its option, repair or replace software media that do not execute programming instructions if National Instruments receives
notice of such defects during the warranty period. National Instruments does not warrant that the operation of the software shall be
uninterrupted or error free.
A Return Material Authorization (RMA) number must be obtained from the factory and clearly marked on the outside of the package before
any equipment will be accepted for warranty work. National Instruments will pay the shipping costs of returning to the owner parts which are
covered by warranty.
National Instruments believes that the information in this document is accurate. The document has been carefully reviewed for technical
accuracy. In the event that technical or typographical errors exist, National Instruments reserves the right to make changes to subsequent
editions of this document without prior notice to holders of this edition. The reader should consult National Instruments if errors are suspected.
In no event shall National Instruments be liable for any damages arising out of or related to this document or the information contained in it.
E
XCEPT
AS
SPECIFIED
HEREIN
, N
ATIONAL
I
NSTRUMENTS
MAKES
NO
WARRANTIES
,
EXPRESS
OR
IMPLIED
,
AND
SPECIFICALLY
DISCLAIMS
ANY
WARRANTY
OF
MERCHANTABILITY
OR
FITNESS
FOR
A
PARTICULAR
PURPOSE
. C
USTOMER
’
S
RIGHT
TO
RECOVER
DAMAGES
CAUSED
BY
FAULT
OR
NEGLIGENCE
ON
THE
PART
OF
N
ATIONAL
I
NSTRUMENTS
SHALL
BE
LIMITED
TO
THE
AMOUNT
THERETOFORE
PAID
BY
THE
CUSTOMER
. N
ATIONAL
I
NSTRUMENTS
WILL
NOT
BE
LIABLE
FOR
DAMAGES
RESULTING
FROM
LOSS
OF
DATA
,
PROFITS
,
USE
OF
PRODUCTS
,
OR
INCIDENTAL
OR
CONSEQUENTIAL
DAMAGES
,
EVEN
IF
ADVISED
OF
THE
POSSIBILITY
THEREOF
. This limitation of the liability of National Instruments will apply regardless of the form of action, whether in contract or tort, including
negligence. Any action against National Instruments must be brought within one year after the cause of action accrues. National Instruments
shall not be liable for any delay in performance due to causes beyond its reasonable control. The warranty provided herein does not cover
damages, defects, malfunctions, or service failures caused by owner’s failure to follow the National Instruments installation, operation, or
maintenance instructions; owner’s modification of the product; owner’s abuse, misuse, or negligent acts; and power failure or surges, fire,
flood, accident, actions of third parties, or other events outside reasonable control.
Copyright
Under the copyright laws, this publication may not be reproduced or transmitted in any form, electronic or mechanical, including photocopying,
recording, storing in an information retrieval system, or translating, in whole or in part, without the prior written consent of National
Instruments Corporation.
Trademarks
National Instruments, NI, ni.com, and LabVIEW are trademarks of National Instruments Corporation. Refer to the Terms of Use section
on
ni.com/legal
for more information about National Instruments trademarks.
Other product and company names mentioned herein are trademarks or trade names of their respective companies.
Patents
For patents covering National Instruments products, refer to the appropriate location: Help»Patents in your software, the
patents.txt
file
on your CD, or
ni.com/patents
.
WARNING REGARDING USE OF NATIONAL INSTRUMENTS PRODUCTS
(1) NATIONAL INSTRUMENTS PRODUCTS ARE NOT DESIGNED WITH COMPONENTS AND TESTING FOR A LEVEL OF
RELIABILITY SUITABLE FOR USE IN OR IN CONNECTION WITH SURGICAL IMPLANTS OR AS CRITICAL COMPONENTS IN
ANY LIFE SUPPORT SYSTEMS WHOSE FAILURE TO PERFORM CAN REASONABLY BE EXPECTED TO CAUSE SIGNIFICANT
INJURY TO A HUMAN.
(2) IN ANY APPLICATION, INCLUDING THE ABOVE, RELIABILITY OF OPERATION OF THE SOFTWARE PRODUCTS CAN BE
IMPAIRED BY ADVERSE FACTORS, INCLUDING BUT NOT LIMITED TO FLUCTUATIONS IN ELECTRICAL POWER SUPPLY,
COMPUTER HARDWARE MALFUNCTIONS, COMPUTER OPERATING SYSTEM SOFTWARE FITNESS, FITNESS OF COMPILERS
AND DEVELOPMENT SOFTWARE USED TO DEVELOP AN APPLICATION, INSTALLATION ERRORS, SOFTWARE AND
HARDWARE COMPATIBILITY PROBLEMS, MALFUNCTIONS OR FAILURES OF ELECTRONIC MONITORING OR CONTROL
DEVICES, TRANSIENT FAILURES OF ELECTRONIC SYSTEMS (HARDWARE AND/OR SOFTWARE), UNANTICIPATED USES OR
MISUSES, OR ERRORS ON THE PART OF THE USER OR APPLICATIONS DESIGNER (ADVERSE FACTORS SUCH AS THESE ARE
HEREAFTER COLLECTIVELY TERMED “SYSTEM FAILURES”). ANY APPLICATION WHERE A SYSTEM FAILURE WOULD
CREATE A RISK OF HARM TO PROPERTY OR PERSONS (INCLUDING THE RISK OF BODILY INJURY AND DEATH) SHOULD
NOT BE RELIANT SOLELY UPON ONE FORM OF ELECTRONIC SYSTEM DUE TO THE RISK OF SYSTEM FAILURE. TO AVOID
DAMAGE, INJURY, OR DEATH, THE USER OR APPLICATION DESIGNER MUST TAKE REASONABLY PRUDENT STEPS TO
PROTECT AGAINST SYSTEM FAILURES, INCLUDING BUT NOT LIMITED TO BACK-UP OR SHUT DOWN MECHANISMS.
BECAUSE EACH END-USER SYSTEM IS CUSTOMIZED AND DIFFERS FROM NATIONAL INSTRUMENTS' TESTING
PLATFORMS AND BECAUSE A USER OR APPLICATION DESIGNER MAY USE NATIONAL INSTRUMENTS PRODUCTS IN
COMBINATION WITH OTHER PRODUCTS IN A MANNER NOT EVALUATED OR CONTEMPLATED BY NATIONAL
INSTRUMENTS, THE USER OR APPLICATION DESIGNER IS ULTIMATELY RESPONSIBLE FOR VERIFYING AND VALIDATING
THE SUITABILITY OF NATIONAL INSTRUMENTS PRODUCTS WHENEVER NATIONAL INSTRUMENTS PRODUCTS ARE
INCORPORATED IN A SYSTEM OR APPLICATION, INCLUDING, WITHOUT LIMITATION, THE APPROPRIATE DESIGN,
PROCESS AND SAFETY LEVEL OF SUCH SYSTEM OR APPLICATION.
© National Instruments Ireland Resources Limited v Getting Started with DASYLab
Contents
About This Manual
Conventions ...................................................................................................................vii
Chapter 1
Data Acquisition and Visualization with DASYLab
Defining Experiments in the Worksheet Window .........................................................1-2
Designing the Visualization in the Layout Window......................................................1-4
Using the Function Bar ..................................................................................................1-6
Chapter 2
Creating Your First Worksheet
Acquiring and Displaying Signals .................................................................................2-1
Extending the Displays ..................................................................................................2-3
Saving the Worksheet ....................................................................................................2-6
Chapter 3
Creating a Complete Worksheet Solution
Configuring the Data Acquisition Device .....................................................................3-1
Collecting and Scaling the Data.....................................................................................3-4
Displaying the Data .......................................................................................................3-6
Storing the Data .............................................................................................................3-8
Connecting the Modules ................................................................................................3-9
Documenting the Worksheet .........................................................................................3-11
Configuring the Display Windows ................................................................................3-13
Designing a Layout for Visualization ............................................................................3-16
Appendix A
Module Groups
Input/Output Module Group ..........................................................................................A-1
Trigger Module Group...................................................................................................A-1
Mathematics Module Group ..........................................................................................A-2
Statistics Module Group ................................................................................................A-2
Signal Analysis Module Group......................................................................................A-2
Control Module Group...................................................................................................A-3
Display Module Group ..................................................................................................A-3
Files Module Group .......................................................................................................A-3
Getting Started with DASYLab vi www.dasylab.com
Data Reduction Module Group ..................................................................................... A-4
Network Module Group ................................................................................................ A-4
Special Module Group................................................................................................... A-4
Add-On Module Group ................................................................................................. A-5
Specific Hardware Modules .......................................................................................... A-5
Appendix B
Tips and Tricks
Combining and Configuring Modules........................................................................... B-1
Block Size and Sampling Rate ...................................................................................... B-3
Optimizing the Processing Speed.................................................................................. B-3
Trouble-Shooting........................................................................................................... B-4
© National Instruments Ireland Resources Limited vii Getting Started with DASYLab
About This Manual
This manual provides information about the operation and functions of the
DASYLab Data Acquisition and Analysis software.
Two exercises show you how to select function modules, how to link them
in the worksheet work area and how to configure each module for your
measurement. In the layout example, you will arrange the display modules
to visualize the results of the data acquisition. Each exercise includes fig-
ures that will assist you as you work through each step of the exercise.
In addition to the examples included in this manual, you can start the
DASYLab interactive Tutorial by selecting Help»Tutorial. The Tutorial
steps you through DASYLab and demonstrates the features by creating
worksheets of varying complexity. You can start the worksheets directly
from the Tutorial. You can use the Tutorial worksheets as the basis for the
construction of your own worksheet.
Conventions
The following conventions are used in this manual:
<> Angle brackets denote a keyboard key that you must press, for example
<Ctrl> for the Control key.
» The » Symbol leads you through nested menu items and dialog box options
to a final action. The sequence File»Page Setup»Options directs you to
pull down the File menu, select the Page Setup item and select Options
from the last dialog box.
This icon denotes a tip, which alerts you to advisory information.
This icon denotes a note, which alerts you to important information
bold Bold text denotes items that you must select or click in the software, such
as menu items and dialog box options. Bold text also denotes parameter
names.
italic Italic text denotes variables, emphasis, a cross reference, or an introduction
to a key concept.
monospace
Text in this font denotes text or characters that you should enter from the
keyboard, sections of code, programming examples, and syntax examples.
About This Manual
Getting Started with DASYLab viii www.dasylab.com
This font is also used for the proper names of disk drives, paths, directories,
programs, subprograms, subroutines, device names, functions, operations,
variables, filenames, and extensions.
© National Instruments Ireland Resources Limited 1-1 Getting Started with DASYLab
1
Data Acquisition and Visualization
with DASYLab
Use DASYLab to interactively create an acquisition, control, simulation or
analysis task. Simply select a function module and place it on the
worksheet. Configure your task by connecting the modules. DASYLab
supports many data acquisition and control devices, as well as different
interfaces that communicate with external instruments.
DASYLab includes acquisition, control and analysis modules, including
analog and digital inputs and outputs, mathematics, statistics, digital filters,
FFT analysis, and switches. Logical operations, switches and sliders or the
Sequence Generator provide exact, time-based waveforms for complex
control signals. You can store the results of the data acquisition and analysis
for off-line analysis by other programs.
The Chart Recorder, Y/t Chart and the X/Y Chart will plot the data as
curves. The List Display and Digital Meter display the data numerically.
Freely scalable Analog Meter, Bar Graph and Status Lamp displays are
useful for Process and Measurement controls.
Tip
You will find an overview of all available modules in Appendix A, Module Groups.
Use the DASYLab VITool Layout Windows to design one or more custom
screens. Display and Control modules can be inserted and combined with
text and graphics. In addition to creating a custom screen, you can use the
VITool to create reports to print and document the results of your
measurement. The reports can be printed manually or automatically, based
on user or data events during measurement.
Save the worksheet, with the data workflow diagram, the display screens
and the reports to a file, for use later (DASYLab Worksheet file,
.DSB
). You
can easily create solutions for each measurement task on your PC, and load
them when required. You can even configure the measurement to start at a
later time after loading.
Use the DLL Extension Toolkit to program your own DASYLab module.
The toolkit contains a complete description of the DASYLab module API
Chapter 1 Data Acquisition and Visualization with DASYLab
Getting Started with DASYLab 1-2 wwww.dasylab.com
(Applications Programming Interface) as well as example code. The
examples are complete working programs for different module types.
Experience with C Language and Microsoft Windows programming is
required.
Defining Experiments in the Worksheet Window
When you start DASYLab, the DASYLab Worksheet window appears with
the menu, Function Bar, Module Bar, Browser and the Info Area. Click on
the Function bar Worksheet button to open the Worksheet view from one
of the other DASYLab views.
Use the worksheet window to create your measurement worksheet. Select
a function module from the Browser or Module bar and place it on the work
area.
The Modules symbolize the program functions, starting from the
acquisition and generation of the data up to output and display of that data.
A worksheet can contain up to 256 modules. Use the Black Box module to
put an additional 256 modules in a “sub-worksheet”. You can have multiple
Black Box modules, and each Black Box can contain Black Boxes. Open a
Black Box by double-clicking on the module; close it by clicking on the
Close Black Box button on the Function bar.
Data channels connect the modules. Module outputs can be connected to
module inputs. Your task determines how the modules will be connected.
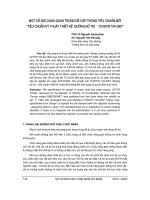
Figure 1-1 shows the DASYLab Worksheet Window with the work area,
the Module Bar, Browser and the Info Area.
Chapter 1 Data Acquisition and Visualization with DASYLab
© National Instruments Ireland Resources Limited 1-3 Getting Started with DASYLab
Figure 1-1. Worksheet View
Use the Browser to select a module and drag and drop it onto the work area.
The Browser shows all modules that were installed with DASYLab and the
selected drivers and options. The Browser uses a tree structure, organized
by a module group.
The Module bar contains a selection of modules that are used frequently.
Click on the module icon in the Module bar, move the mouse to the work
area, and click to place the module. You can choose to display or remove
the Module bar by selecting View»Module Bar.
You can easily customize the Module bar to include the functions that you
use most frequently. Right-click over a button on the Module bar and
choose New to open the selection dialog box. Scroll through the list of all
available modules, select a module, and click on OK to confirm and map
the button to that module. The Module bar button now shows the icon of the
selected module. DASYLab stores the configuration of the Module bar,
saves it when you close the program, and reloads it when you next start
DASYLab.
1 Function Bar
2 Module Bar
3Browser
4 Info Area
5 Worksheet Work Area
Chapter 1 Data Acquisition and Visualization with DASYLab
Getting Started with DASYLab 1-4 wwww.dasylab.com
You can create different Module bar configurations for different tasks, save
the configuration, and load them later. Use Edit»Module Bar to create a
new, blank configuration, to save the current configuration or to load a
stored configuration including standard Basic, Intermediate and Advanced
configurations.
You can document the worksheet with text blocks that appear on the
background of the work area. Right-click on a blank section of the work
area and choose Edit Documentation from the context menu. Next,
right-click again and select Create Documentation. Use the mouse to drag
a box on the work area. Double-click on the box to open the
Documentation Properties, where you can enter text commentary.
Designing the Visualization in the Layout Window
Create your individual layout to display data and to document the
measurement task. Click in the Function bar on the Layout Window button
to open the Layout view. DASYLab displays the Layout Tool Bar, to allow
you to create objects on the Layout Window. Click on an object and place
it on the window area by clicking and dragging a box. You can change the
size and location of each object. Connect to display objects, such as the
Chart Recorder or Switch module using the Graph object. Include bitmaps,
such as logos or process displays using the Bitmap object. Add text, boxes,
lines, and other decoration.
Use the Layout Window Properties to configure the size of the screen or
page. You can select Screen to match your monitor, or a paper size. You can
zoom to enlarge or shrink the layout as you work on it.
Each worksheet can have up to 200 layout pages. Use Window»New
Layout to add a page and Window»Delete Layout Page to remove the
current page.
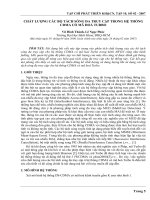
Figure 1-2 shows the DASYLab Layout Window with a layout page.
Chapter 1 Data Acquisition and Visualization with DASYLab
© National Instruments Ireland Resources Limited 1-5 Getting Started with DASYLab
Figure 1-2. Screen Layout in the Layout Window
The Layout Window has an additional function bar, the Tool Bar. Use the
View menu to hide or to display the Tool Bar. It can be docked to the side
or the top of the DASYLab screen as shown, or free floating as shown in
Figure 1-3.
Figure 1-3. Layout Window Tool Bar
1 Function Bar
2 Layout Object Toolbar
3 Layout with text, Visualization objects and
Graphic elements
Chapter 1 Data Acquisition and Visualization with DASYLab
Getting Started with DASYLab 1-6 wwww.dasylab.com
Use the Tool Bar to add active and passive layout elements to your layout
page:
• Active Layout Elements
Active Layout elements are the objects that connect the worksheet
modules to the layout window view. The Graph object connects to dis-
play modules and control objects, such as Switch and Slider modules.
The Text object connects to the Digital Meter display. These objects
update continually while the worksheet is running.
• Passive Layout Elements
Passive Layout elements allow you to label and decorate the layout dis-
play, and have no connection to modules on the worksheet. Graphic
objects include line, circle, ellipse, rectangle, filled circles, filled rect-
angles, text lines, and text blocks. The Bitmap object allows you to
display a
.bmp
or
.wmf
graphic as a logo or as the background.
During a measurement, use <Ctrl+F> to activate the layout as Full Screen,
hiding the menus and bars. This is especially useful for configuring the
DASYLab worksheet to present only the measurement objects that you
want to display, in the orientation, shape and size that you determine.
Using the Function Bar
The Function bar contains buttons that link to frequently used menu
commands. Figure 1-4 shows the Function bar in the Worksheet View.
Figure 1-4. Worksheet View Function Bar
When you hover over a button with the mouse, a Tool Tip will appear with
the function of the button. The following list shows each button and its
function:
Chapter 1 Data Acquisition and Visualization with DASYLab
© National Instruments Ireland Resources Limited 1-7 Getting Started with DASYLab
Start Experiment
Pause Experiment
Stop Experiment
New Worksheet
Open Worksheet
Save Worksheet
Time Base
Experiment Setup for Current Driver
Hardware Setup for Current Driver
Display Worksheet Information
Change to the Control Sequencer View
Change to the Display View
Change to the Worksheet View
Change to the Layout View
Cut Selected Object
Copy Selected Object
Paste from the Clipboard to the Worksheet or Layout
Close Black-Box. This function button only appears if
you have opened a Black Box module.
Chapter 1 Data Acquisition and Visualization with DASYLab
Getting Started with DASYLab 1-8 wwww.dasylab.com
To the right of the Function bar, you will see eight numbered buttons. You
can configure these buttons to be a shortcut for frequently used functions.
In each DASYLab view, there are 8 buttons, each view with its own color.
This enables you to define custom buttons that are appropriate to each view.
Figure 1-5. User-Defined Function Buttons in the Worksheet View
Initially, three buttons are configured when DASYLab is installed. They are
customized to open the Define Global Variable dialog box, the Define
Global Strings dialog box, and the Report information. You can change the
function of any of the buttons by right-clicking on the button. Choose New
Command to select from all available menu functions. Confirm the choice
by clicking on OK. The color of the button changes from the inactive gray
color to the active color for the current view.
Hide all Display Windows
Unhide all Display Windows
Minimize all Display Windows
Restore all Display Windows to Normal View
© National Instruments Ireland Resources Limited 2-1 Getting Started with DASYLab
2
Creating Your First Worksheet
Start DASYLab. The DASYLab Worksheet view appears with the Menu at
the top of the window and the Function bar under it, the Module bar and the
Browser to the left of the display and the Info Area at the bottom. Press the
<F1> key on the keyboard to activate the Help menu.
Note
Click on <F1> while a dialog box is open to display the affiliated help page.
For this exercise, ensure that the Module bar is displayed. Click
View»Module Bar to activate it if it is hidden. The Module bar displays a
selection of icons which represent frequently used modules.
Acquiring and Displaying Signals
Follow these steps to create your worksheet:
1. Double-click on the Generator button on the Module bar. The follow-
ing Generator Type dialog box appears.
Confirm the default setting by clicking on OK. DASYLab inserts the
Generator module on the work area.
Tip
Simply click once on the desired Module bar button. Then, move the mouse cursor to
the work area, and click a second time to place the module at the desired location.
Chapter 2 Creating Your First Worksheet
Getting Started with DASYLab 2-2 www.dasylab.com
2. Double-click on the Y/t Chart button the Module bar. DASYLab
inserts the Y/t Chart module on the work area.
When you create a display module such as the Y/t Chart, an additional
display window appears at the bottom of the screen.
Now, connect the two modules with a data channel so that data will flow
from one to the other.
3. Click on the Y/t Chart Module and, holding the left mouse button
down, drag the module icon until the input I just touches the output O
of the Generator module. When you release the mouse button, DASY-
Lab will automatically connect the two modules and will autoroute the
wires.
4. Click on the Start button on the Function bar to start the measurement.
To view the data when you start the measurement, you will need to open the
display window associated with the Y/t Chart module. Initially, the display
window is minimized at the bottom of the screen.
5. Click on the Restore All Display Windows button on the Function
bar. The Y/t Chart Display window will be restored. Observe the signal
generated by the Signal Generator module.
6. Right-click on the graph area of the Y/t Chart to change the look of the
current chart. Choose Display»Window»Colors and Lines from the
context menu.
Chapter 2 Creating Your First Worksheet
© National Instruments Ireland Resources Limited 2-3 Getting Started with DASYLab
Select Drawing Board from the list. Click the Color button and select
a new color for the Drawing Board, for example, bright yellow.
Confirm your selection with OK.
Click OK to save the settings and close the dialog box. The Drawing
Board of the Y/t Chart Display Window will now show the chosen
color.
7. Click on the Stop button on the Function bar to stop the measurement.
Tip
You can use the <F5> keyboard key to start the worksheet. <CTRL-F6> will pause
the worksheet, and <CTRL-F5> will stop it.
Extending the Displays
Now, add a Bar Graph to display the data.
8. Double-click on the Bar Graph button on the Module bar. After
DASYLab puts the Bar Graph module on the work area, you can
restore the Bar Graph display window that initially appears minimized
at the bottom of the screen.
To connect the Bar Graph module to the Generator, you can “tap” the exist-
ing data channel.
9. Left-click on the existing data channel wire that connects the Genera-
tor to the Y/t Chart. The mouse pointer changes to a hand with a plug
symbol. Move this symbol to the input I of the Bar Graph module.
When the input of the Bar Graph changes color, you can left-click
again to complete the connection.
Chapter 2 Creating Your First Worksheet
Getting Started with DASYLab 2-4 www.dasylab.com
10. Double-click on the Title bar of the Bar Graph display window, cur-
rently minimized at the bottom of the screen. It will be restored so that
you can see the Bar Graph display.
11. Start the worksheet again.
DASYLab now shows the Generator signal in both the Y/t Chart and
the Bar Graph displays.
Chapter 2 Creating Your First Worksheet
© National Instruments Ireland Resources Limited 2-5 Getting Started with DASYLab
12. Stop the current measurement.
Tip
Right-click twice (don’t double-click) on a data channel to delete the data channel.
13. Double-click on the Digital Meter in the Module bar. DASYLab
places this module on the work area.
14. Move the Digital Meter module under the Bar Graph module.
DASYLab will automatically place the module to align it, and will not
allow you to place one under the other.
Tip
Right-click on the work area to open the Chart Window properties where you can
define the grid spacing.
15. Click on the data channel that connects the Generator module to the
Bar Graph module. Connect the data channel to the input I of the Dig-
ital Meter in the same way as before.
16. Double-click on the title bar of the minimized Digital Meter display
window to restore it to normal view.
17. Start the measurement.
By default, the Generator module creates a 10 Hz Square Waveform. The
characteristics of this generated signal can be changed while the experi-
ment is running.
Chapter 2 Creating Your First Worksheet
Getting Started with DASYLab 2-6 www.dasylab.com
18. Double-click on the Generator Module on the work area to open its
properties dialog box. Choose Sine as the Wave Form.
Click OK to confirm this choice and close the dialog box.
The display windows now show the sine wave form.
Note
While the measurement is running, you can examine the contents of each data chan-
nel on the work area. When you click on a data channel wire, DASYLab displays
information about the data channel in the FIFO Values area of the Info Area, including the
sampling rate, block size, and the current value of the data in the channel.
19. Stop the measurement.
Saving the Worksheet
20. Click on the Save button on the Function bar to save the worksheet
with all of the current configuration to a file.
Give this file the name
MyWorksheet
. When you click OK, DASY-
Lab stores the worksheet as
MyWorksheet.DSB
in the default
DASYLab worksheet folder. DASYLab automatically adds the
.DSB
file extension to the file name that you type. The DASYLab Title bar
now displays the worksheet name.
© National Instruments Ireland Resources Limited 3-1 Getting Started with DASYLab
3
Creating a Complete
Worksheet Solution
This chapter shows you a complete data acquisition task.
You want to test a motor and visualize that data. A Chart Recorder will
display the temperature, the power and the speed of the motor.
Additionally, you want to display the current values for power and speed in
numerical form.
You want to collect the data at 1 sample/second (Hz), then scale it, and store
it continuously to a file on the hard drive. The measurement task will be
started and stopped manually.
To do this, you need to have a supported data acquisition device available.
All sensor signals are linear, and can be scaled according to Table 3-1
below:
Configuring the Data Acquisition Device
Before you can create the worksheet for this measurement task, you must
verify that the data acquisition device is correctly installed, configured and
working with DASYLab. This is an essential step to ensure that the data
acquired by DASYLab is interpreted and displayed correctly.
DASYLab differentiates hardware drivers by whether they can be used
simultaneously with other drivers. For example, you can use the Sound
Card driver at the same time as the National Instrument NI-DAQmx driver.
When you installed DASYLab, you selected the driver for your data
acquisition device. The settings for the hardware drivers are found in the
Table 3-1. Unit Scaling for the Data Acquisition Device
Motor Temperature 1. Channel 0 0-5 Volt 0-300 Degrees C
Power 2. Channel1 0-2 Volt 0-1000 Watt
Speed 3. Channel 2 0-5 Volt 0-3500 RPM
Chapter 3 Creating a Complete Worksheet Solution
Getting Started with DASYLab 3-2 www.dasylab.com
Experiment»Hardware Setup menu. Choose the
NI-DAQmx»Hardware Setup submenu to configure National Instruments
data acquisition devices. Figure 3-1 shows an example of the available
tasks for this driver.
Figure 3-1. NI-DAQmx Hardware Settings
The modules associated with the NI-DAQmx driver are found in the
Browser or in the menu, Modules»Input/Output»NI-DAQmx.
The Driver menu choice is reserved for drivers that use the DASYLab
standard driver interface. Select this driver using the Experiment»Select
Driver menu. Figure 3-2 shows the Hardware Setup for the Sound Card
Driver.
Figure 3-2. Selecting the Sound Card Driver
Once you select the driver, all driver related features, modules and settings
refer to the Sound Card.
Chapter 3 Creating a Complete Worksheet Solution
© National Instruments Ireland Resources Limited 3-3 Getting Started with DASYLab
Once you have configured the hardware settings for your data acquisition
device, you must configure your data acquisition task. Click the
Experiment Setup button on the Function bar.
Figure 3-3. Experiment Setup
As shown in Figure 3-3, you configure the Sampling Rate, the Block Size
and the Driver Buffer in the Experiment Setup dialog box. The sampling
rate and block size determine the number of samples transferred from the
driver to DASYLab, and determine how data is moved from module to
module on the worksheet. The driver buffer determines how much data can
be stored as it moves from the sound card to DASYLab.
For this data acquisition task, choose a block size of
1
(one). The Sampling
Rate/Channel for this task is
1Hz
, or 1 sample/second. This means that
one sample will be collected and displayed each second.
Up to now, you have relied on DASYLab default settings for sample rate
and block size. DASYLab stores the Experiment Setup data acquisition
settings with the worksheet.
The Hardware Setup settings for the data acquisition card are not stored in
the worksheet file. Typically these settings remain unchanged unless the
hardware changes.