The Diversity of Countries and Economies across the World
Bạn đang xem bản rút gọn của tài liệu. Xem và tải ngay bản đầy đủ của tài liệu tại đây (974.89 KB, 8 trang )
The Diversity of Countries and Economies across the World
The Diversity of Countries
and Economies across the
World
By:
OpenStaxCollege
The national economies that make up the global economy are remarkably diverse. Let
us use one key indicator of the standard of living, GDP per capita, to quantify this
diversity. You will quickly see that quantifying this diversity is fraught with challenges
and limitations. As explained in The Macroeconomic Perspective, we must consider
using purchasing power parity or “international dollars” to convert average incomes into
comparable units. Purchasing power parity, as formally defined in Exchange Rates and
International Capital Flows, takes into account the fact that prices of the same good are
different across countries.
The Macroeconomic Perspective explained how to measure GDP, the challenges of
using GDP to compare standards of living, and the difficulty of confusing economic
size with distribution. In China’s case, for example, China ranks as the third largest
global economy along with Japan and the United States. But, when we take its GDP of
$4,522,140,211,438 and divide it by its population of 1,350,695,000 people, then the per
capita GDP is only $3,348, which is significantly lower than that of Japan, at $36,938,
and that of the United States, at $43,063. Measurement issues aside, it’s worth repeating
that the goal, then, is to not only increase GDP, but to strive toward increased GDP per
capita to increase overall standards of living for individuals. As we have learned from
Economic Growth, this can be achieved at the national level by designing policies that
increase worker productivity, deepen capital, and advance technology.
GDP per capita also allows us to rank countries into high-, middle-, or low-income
groups. Low-income countries are those with $1,025 per capita GDP per year; middleincome countries have a per capita GDP between $1,025 and $12,475; while highincome countries have over $12,475 per year per capita income. As seen in [link] and
[link], high-income countries earn 68% of world income, but represent just 12% of the
global population. Low-income countries earn 1% of total world income, but represent
18.5% of global population.
1/8
The Diversity of Countries and Economies across the World
World Income versus Global Population(Source: />views/reports/tableview.aspx?isshared=true&ispopular=series&pid=20)
Ranking based on
GDP/capita
GDP (in
millions)
Low income ($1,025 or
$501,001
less)
% of
Global
GDP
Population
0.7%
1,302,107,523 18.5%
% of Global
Population
Middle income ($1,025
$22,353,932 31.1%
- $12,475)
4,897,806,355 69.5%
High income (more
than $12,475)
$49,112,539 68.3%
846,454,901
World Total income
$71,918,394
7,046,368,779
12.0%
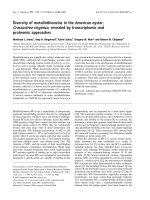
Percent of Global GDP and Percent of Population
The pie charts show the GDP (from 2011) for countries categorized into low, middle, or high
income. Low-income are those earning less than $1,025 (less than 1% of global income). They
represent 18.5% of the world population. Middle-income countries are those with per capita
income of $1,025–$12,475 (31.1% of global income). They represent 69.5% of world population.
High-income countries have 68.3% of global income and 12% of the world’s population.
(Source: />tableview.aspx?isshared=true&ispopular=series&pid=20)
2/8
The Diversity of Countries and Economies across the World
An overview of the regional averages of GDP per person for developing countries,
measured in comparable international dollars as well as population in 2008 ([link]),
shows that the differences across these regions are stark. As [link] shows, nominal
GDP per capita in 2012 for the 581.4 million people living in Latin America and the
Caribbean region was $9,190, which far exceeds that of South Asia and sub-Saharan
Africa. In turn, people in the high-income nations of the world, such as those who live
in the European Union nations or North America, have a per capita GDP three to four
times that of the people of Latin America. To put things in perspective, North America
and the European Union have slightly more than 9% of the world’s population, but they
produce and consume close to 70% of the world’s GDP.
GDP Per Capita in U.S. Dollars (2008)
There is a clear imbalance in the GDP across the world. North America, Australia, and Western
Europe have the highest GDPs while large areas of the world have dramatically lower GDPs.
(Credit: modification of work by Bsrboy/Wikimedia Commons)
Regional Comparisons of Nominal GDP per Capita and Population in
2012(Source: />Population (in millions) GDP Per Capita
East Asia
1,992
$5,246
South Asia
1,649
$1,388
Sub-Saharan Africa
910
$1,415
Latin America
581
$9,190
3/8
The Diversity of Countries and Economies across the World
Population (in millions) GDP Per Capita
Middle East and North Africa 340
$4,535
Europe and Central Asia
$6,847
272
Such comparisons between regions are admittedly rough. After all, per capita GDP
cannot fully capture the quality of life. Many other factors have a large impact on the
standard of living, like health, education, human rights, crime and personal safety, and
environmental quality. These measures also reveal very wide differences in the standard
of living across the regions of the world. Much of this is correlated with per capita
income, but there are exceptions. For example, life expectancy at birth in many lowincome regions approximates those who are more affluent. The data also illustrate that
nobody can claim to have perfect standards of living. For instance, despite very high
income levels, there is still undernourishment in Europe and North America.
Economists know that there are many factors that contribute to your standard of living.
People in high-income countries may have very little time due to heavy workloads and
may feel disconnected from their community. Lower-income countries may be more
community centered, but have little in the way of material wealth. It is hard to measure
these characteristics of standard of living. The Organization for Economic Co-Operation
and Development has developed the “OECD Better Life Index.” Visit this website to
see how countries measure up to your expected standard of living.
The differences in economic statistics and other measures of well-being, substantial
though they are, do not fully capture the reasons for the enormous differences between
countries. Aside from the neoclassical determinants of growth, four additional
determinants are significant in a wide range of statistical studies and are worth
mentioning: geography, demography, industrial structure, and institutions.
Geographic and Demographic Differences
Countries have geographic differences: some have extensive coastlines, some are
landlocked. Some have large rivers that have been a path of commerce for centuries, or
mountains that have been a barrier to trade. Some have deserts, some have rain forests.
4/8
The Diversity of Countries and Economies across the World
These differences create different positive and negative opportunities for commerce,
health, and the environment.
Countries also have considerable differences in the age distribution of the population.
Many high-income nations are approaching a situation by 2020 or so in which the
elderly will form a much larger share of the population. Most low-income countries
still have a higher proportion of youth and young adults, but by about 2050, the
elderly populations in these low-income countries are expected to boom as well. These
demographic changes will have considerable impact on the standard of living of the
young and the old.
Differences in Industry Structure and Economic Institutions
Countries have differences in industry structure. In the high-income economies of the
world, only about 2% of GDP comes from agriculture; the average for the rest of the
world is 12%. Countries have strong differences in degree of urbanization.
Countries also have strong differences in economic institutions: some nations have
economies that are extremely market-oriented, while other nations have command
economies. Some nations are open to international trade, while others use tariffs and
import quotas to limit the impact of trade. Some nations are torn by long-standing armed
conflicts; other nations are largely at peace. There are differences in political, religious,
and social institutions as well.
No nation intentionally aims for a low standard of living, high rates of unemployment
and inflation, or an unsustainable trade imbalance. However, nations will differ in their
priorities and in the situations in which they find themselves, and so their policy choices
can reasonably vary, too. The next modules will discuss how nations around the world,
from high income to low income, approach the four macroeconomic goals of economic
growth, low unemployment, low inflation, and a sustainable balance of trade.
Key Concepts and Summary
Macroeconomic policy goals for most countries strive toward low levels of
unemployment and inflation, as well as stable trade balances. Countries are analyzed
based on their GDP per person and ranked as low-, middle-, and high-income countries.
Low-income are those earning less than $1,025 (less than 1%) of global income. They
currently have 18.5% of the world population. Middle-income countries are those with
per capital income of $1,025–$12,475 (31.1% of global income). They have 69.5% of
world population. High-income countries are those with per capita income greater than
$12,475 (68.3% of global income). They have 12% of the world’s population. Regional
comparisons tend to be inaccurate because even countries within those regions tend to
differ from each other.
5/8
The Diversity of Countries and Economies across the World
Self-Check Questions
Using the data provided in [link], rank the seven regions of the world according to GDP
and then according to GDP per capita.
GDP and Population of Seven Regions of the World
Population (in
millions)
GDP Per
Capita
GDP = Population × Per Capita
GDP (in millions)
East Asia
1,992
$5,246
$10,450,032
South Asia
1,649
$1,388
$2,288,812
Sub-Saharan Africa 910
$1,415
$1,287,650
Latin America
581
$9,190
$5,339,390
Middle East and
North Africa
340
$4,535
$1,541,900
Europe and Central
272
Asia
$6,847
$1,862,384
The answers are shown in the following two tables.
Region
GDP (in millions)
East Asia
$10,450,032
Latin America
$5,339,390
South Asia
$2,288,812
Europe and Central Asia
$1,862,384
Middle East and North Africa $1,541,900
Sub-Saharan Africa
$1,287,650
Region
GDP Per Capita (in millions)
East Asia
$5,246
Latin America
$1,388
South Asia
$1,415
Europe and Central Asia
$9,190
6/8
The Diversity of Countries and Economies across the World
Region
GDP Per Capita (in millions)
Middle East and North Africa $4,535
Sub-Saharan Africa
$6,847
East Asia appears to be the largest economy on GDP basis, but on a per capita basis it
drops to third, after Europe and Central Asia and Sub-Saharan Africa.
What are the drawbacks to analyzing the global economy on a regional basis?
A region can have some of high-income countries and some of the low-income
countries. Aggregating per capita real GDP will vary widely across countries within a
region, so aggregating data for a region has little meaning. For example, if you were
to compare per capital real GDP for the United States, Canada, Haiti, and Honduras,
it looks much different than if you looked at the same data for North America as a
whole. Thus, regional comparisons are broad-based and may not adequately capture an
individual country’s economic attributes.
Review Questions
What is the primary way in which economists measure standards of living?
What are some of the other ways of comparing the standard of living in countries around
the world?
What are the four other factors that determine the economic standard of living around
the world?
Critical Thinking Question
Demography can have important economic effects. The United States has an aging
population. Explain one economic benefit and one economic cost of an aging population
as well as of a population that is very young.
Problems
Retrieve
the
following
data
from
The
World
Bank
database
( for India, Spain, and South Africa for
the most recent year available:
• GDP in constant international dollars or PPP
• Population
7/8
The Diversity of Countries and Economies across the World
•
•
•
•
GDP per person in constant international dollars
Mortality rate, infant (per 1,000 live births)
Health expenditure per capita (current U.S. dollars)
Life expectancy at birth, total (years)
Prepare a chart that compares India, Spain, and South Africa based on the data you find.
Describe the key differences between the countries. Rank these as high-, medium-, and
low-income countries, explain what is surprising or expected about this data.
References
International Labour Organization. “Global Employment Trends for Youth 2013.”
/>2013/lang—en/index.htm.
International Monetary Fund. “World Economic and Financial Surveys: World
Economic Outlook—Transitions and Tensions.” Last modified October 2013.
/>Nobelprize.org. “The Prize in Economics 1987 - Press Release.” Nobel Media AB 2013.
Last modified October 21, 1987. />Redvers, Louise. BBC News Business. “Youth unemployment: The big question and
South Africa.” Last modified October 31, 2012. />business-20125053.
The World Bank. “The Complete
/>
World
Development
Report
Online.”
The World Bank. “World DataBank.” />Todaro, Michael P., and Stephen C Smith. Economic Development (11thEdition).
Boston, MA: Addison-Wesley: Pearson, 2011, chap. 1–2.
8/8