Intermediate algebra functions and authentic applications 5th edition jay lehmann test bank
Bạn đang xem bản rút gọn của tài liệu. Xem và tải ngay bản đầy đủ của tài liệu tại đây (380.29 KB, 26 trang )
SHORT ANSWER. Write the word or phrase that best completes each statement or answers the question.
Solve the problem.
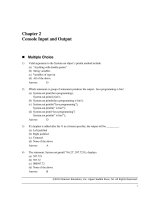
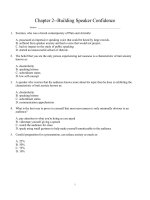
1) A computer science major found that the grade he earned on his programs increased with
the time he spent working on them in the computer lab. He made a table of the hours spent
in the lab and the corresponding program grades. Let g represent the grade earned when h
hours are spent in the lab.
Hours spent Program Grade
in lab
1
35
1.5
46
2
61
2.5
65
2.5
73
3.5
79
4.5
90
5
96
5
98
a) Sketch a scattergram for the data.
b) Sketch a line that comes close to the data points in the scattergram. Use your linear
model to estimate the Program grade when 3 hours are spent in the lab. State whether you
used interpolation or extrapolation to obtain your result.
1
1)
2) Since the end of the Cold War, jobs in defense manufacturing and aerospace have
disappeared as the U.S. government spends less on defense. Employments at Lockheed for
various years are listed in the table below.
2)
Employment
Year (thousands)
1989
27.8
1991
25
1992
21
1994
16
1995
13.5
(Source: Lockheed Missile and Space)
Let L represent the employment (in thousands of people) at Lockheed t years since 1900.
i) Use your graphing calculator to create a scattergram of the Lockheed data. Then use
your calculator to sketch the graph of the equation L = -2.48t + 249.38. Which data point(s)
are above the line?
ii) Use the linear model to estimate when there were 35 thousand employees at Lockheed.
iii) Use the linear model to predict the number of employees at Lockheed in 2010. Has
model breakdown occurred?
iv) What is the slope of the equation y = -2.48x + 249.38? What does the slope tell you in
terms of the employment at Lockheed - be as specific and complete as you can be.
v) Find the t-intercept. What does your result mean in terms of Lockheed?
vi) Find the L-intercept. What does your result mean in terms of Lockheed?
3) Although the number of people arrested for arson has remained fairly constant during the
1990s, the percent of arson arrests that have been juveniles has been on the rise. The data is
printed in the table below.
Year Percent
1990
44
1991
47
1992
49
1993
49
1994
55
1995
52
(Source: U.S. Justice Department)
Let P represent the percent of arson arrests that are juveniles at t years since 1990. The
equation P = 1.83t + 44.76 models the data well.
i) Use the linear model to predict when 75 percent of arson arrests will be juveniles.
ii) Use the linear model to estimate the percent of arson arrests that were juveniles in
1985.
iii) Find the t-intercept. What does it mean in terms of arson arrests?
iv) What is the slope of the equation P = 1.83t + 44.76? What does the slope represent in
terms of arson arrests?
v) Find the P-intercept. What does it mean in terms of arson arrests?
vi) Find P when t = 10. What does your result mean in terms of the situation?
vii) Find t when P = 100. What does your result mean in term of the situation?
2
3)
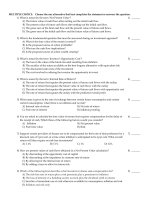
MULTIPLE CHOICE. Choose the one alternative that best completes the statement or answers the question.
Solve.
4) The average value of a certain type of automobile was $13,080 in 1994 and depreciated to $5700 in
1997. Let y be the average value of the automobile in the year x, where x = 0 represents 1994.
Write a linear equation that models the value of the automobile in terms of the year x.
1
A) y = -2460x + 13,080
B) y = x - 5700
2460
C) y = -2460x + 5700
4)
D) y = -2460x - 1680
5) An investment is worth $3713 in 1992. By 1995 it has grown to $4346. Let y be the value of the
investment in the year x, where x = 0 represents 1992. Write a linear equation that models the
value of the investment in the year x.
1
A) y =
x + 3713
B) y = -211x + 4979
211
C) y = 211x + 3713
5)
D) y = -211x + 3713
6) A faucet is used to add water to a large bottle that already contained some water. After it has been
filling for 5 seconds, the gauge on the bottle indicates that it contains 13 ounces of water. After it
has been filling for 11 seconds, the gauge indicates the bottle contains 25 ounces of water. Let y be
the amount of water in the bottle x seconds after the faucet was turned on. Write a linear equation
that models the amount of water in the bottle in terms of x.
1
21
A) y = 2x + 3
B) y = 2x + 14
C) y = -2x + 23
D) y = x +
2
2
6)
7) When making a telephone call using a calling card, a call lasting 3 minutes costs $1.05. A call
lasting 13 minutes costs $3.05. Let y be the cost of making a call lasting x minutes using a calling
card. Write a linear equation that models the cost of making a call lasting x minutes.
279
A) y = -0.2x + 1.65
B) y = 5x C) y = 0.2x - 9.95
D) y = 0.2x + 0.45
20
7)
8) A vendor has learned that, by pricing pretzels at $1.75, sales will reach 82 pretzels per day. Raising
the price to $2.50 will cause the sales to fall to 46 pretzels per day. Let y be the number of pretzels
the vendor sells at x dollars each. Write a linear equation that models the number of pretzels sold
per day when the price is x dollars each.
1
15737
A) y = x+
B) y = -48x + 166
48
192
8)
C) y = -48x - 166
D) y = 48x - 2
3
9) In 1995, the average annual salary for elementary school teachers was $24,269. In 2000, the
average annual salary for elementary school teachers was $28,148. Let y be the average annual
salary in the year x, where x = 0 represents the year 1995.
a) Write a linear equation that models the average annual salary for elementary school teachers in
terms of year x.
b) Use this equation to determine the average annual salary for elementary school teachers in 1999.
A) a) y = 770.8x + 24,269
B) a) y = 770.8x + 24,269
b) $27,372.20
b) $27,352.20
C) a) y = 775.8x + 24,269
D) a) y = 775.8x + 24,269
b) $27,372.20
b) $28,148.00
9)
10) In 1995, the average annual salary for elementary school teachers was $24,269. In 2000, the
average annual salary for elementary school teachers was $28,148. Let y be the average annual
salary in the year x, where x = 0 represents the year 1995.
a) Write a linear equation that models the average annual salary for elementary school teachers in
terms of year x.
b) Use this equation to determine the average annual salary for elementary school teachers in 2007.
A) a) y = 770.8x + 24,269
B) a) y = 770.8x - 24,269
b) $33,518.60
b) $33,518.60
C) a) y = 775.8x + 24,269
D) a) y = 775.8x - 24,269
b) $33,578.60
b) $33,578.60
10)
SHORT ANSWER. Write the word or phrase that best completes each statement or answers the question.
Solve the problem.
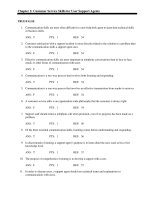
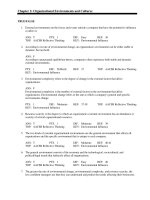
11) Consider the graph of the data and the model y = mx + b. Sketch the graph of a linear
model that better describes the data and then explain how you would adjust the slope and
the y-intercept of the original model so that it would better describe the data.
y
x
4
11)
12) The number of people who have committed violent crimes (per 100,000 people) in the U.S.
during various years are listed in the table below.
12)
Number of Violent Crime Offenders
Year
(per 100,000 people)
1960
175
1965
200
1970
360
1975
490
1980
580
1985
550
1990
750
(Source: The American Almanac)
Let N represent the number of people who have committed violent crimes (per 100,000
people) in the U.S. in the year that is t years since 1900. Find an equation of a linear model
to describe the data.
13) The percents of male teenagers who have had sex is grouped by age in the table below.
13)
Age Percent
13
9
14
13
15
27
16
41
17
52
18
64
(Source: The Universal Almanac)
Let P represent the percent of male teenagers of age a that have had sex. Find an equation
of a linear model to describe the data.
14) Given below are the winning times for the men's 100 meter Olympic freestyle for various
years.
Winning Times in Olympic
100 Meter Freestyle
Year
(in seconds)
1960
55.2
1964
53.4
1968
52.2
1972
51.22
1976
49.99
1980
50.4
1984.
49.8
1988
48.63
1992
49.02
1996
48.74
(Source: The Universal Almanac)
Let W represent the winning time (in seconds) at t years since 1950. Find an equation of a
linear model to describe the data.
5
14)
15) Three students are to find a linear model for the data in the table below. Student A uses
15)
the points (30, 14.2) and (35, 14.1), student B uses the points (40, 12.1) and (50, 9.7), and
student C uses the points (60, 6.8) and (65, 7.2). Which student seems to have made the best
choice of points? Explain.
x
10
20
30
35
40
50
60
65
y
19.1
16.9
14.2
14.1
12.1
9.7
6.8
7.2
MULTIPLE CHOICE. Choose the one alternative that best completes the statement or answers the question.
16) Draw a scattergram of the given data. Find the equation of the line containing the points (1, 1.3)
and (9, 4.5). Graph the line on the scattergram.
x1 4 5 7 9
y 1.3 2.1 2.8 3.4 4.5
y
5
4
3
2
1
2
4
6
8
10
x
A)
B)
y
y
5
5
4
4
3
3
2
2
1
1
2
4
6
8
10
x
2
y = 0.4x + 0.9
y = 0.44x + 0.9
6
4
6
8
10
x
16)
C)
D)
y
y
5
5
4
4
3
3
2
2
1
1
2
4
6
8
10
x
2
y = 0.35x + 0.95
4
6
8
10
x
y = 0.42x + 0.85
17) Draw a scattergram of the given data. Find the equation of the line containing the points (2.2, 8.2)
and (4.6, 3.1). Graph the line on the scattergram.
x 1.3 2.2 2.8 3.6 4.6
y 9.3 8.2 5.8 4.7 3.1
14
y
12
10
8
6
4
2
1
2
3
4
5
x
A)
B)
y
y
14
14
12
12
10
10
8
8
6
6
4
4
2
2
1
2
3
4
5
x
1
y = -2.125x + 12.88
2
y = -2.34x + 13.38
7
3
4
5
x
17)
C)
D)
y
y
14
14
12
12
10
10
8
8
6
6
4
4
2
2
1
2
3
4
5
x
1
2
3
4
5
x
y = 2.13x + 12.88
y = -1.5x + 10
SHORT ANSWER. Write the word or phrase that best completes each statement or answers the question.
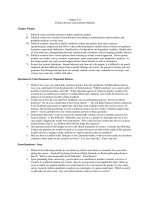
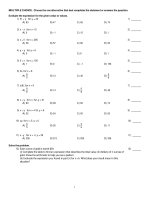
18) The following data represents the height (in inches) and weight (in pounds) of 9 randomly
selected adults.
Height, x (in.)
65
72
61
68
74
66
62
70
67
Weight, y (lb)
142
188
112
156
195
169
127
182
186
Graph the data on a scattergram treating height as the independent variable. Find an
equation of the line containing the points (62, 127) and (70, 182). Graph the line on the
scattergram. Interpret the slope of the line. Use the line to predict the weight of a person
who is 61.6 inches tall. Round to the nearest pound.
y
200
Weight (lb)
180
160
140
120
100
60 62 64 66 68 70 72 74 76
x
8
18)
MULTIPLE CHOICE. Choose the one alternative that best completes the statement or answers the question.
Evaluate the function at the given value of x.
19) f(x) = -5x + 6, f(5)
A) -19
B) -31
20) f(x) = 3x + 2, f(-
19)
C) 1
D) 5
1
)
3
A) - 3
20)
B) -
1
3
C) 1
D) - 1
21) f(x) = 4x + 1, g(a + 1)
A) 4a + 1
22) f(x) = 3 - 8x2 , f(6)
A) -93
23) f(x) =
A)
24) f(x) =
4
15
D) 4a - 1
B) -285
C) -45
D) 291
22)
23)
B)
4
3
C) -
4
15
D)
4
21
x - 10
, f(-2)
9x + 14
24)
B) 1
C) -3
D) 0
x+5
, f(9)
7x - 11
A) -
26) f(x) =
B) 4a + 5
x+3
, f(9)
6x - 9
A) 3
25) f(x) =
21)
1
C) a + 1
4
7
26
25)
B)
7
12
C)
7
26
D)
7
37
x-8
, f(-3)
2x + 5
A) 1
26)
C) -1
B) 11
D) -11
For the given function, find the value of x that corresponds to the given value of f(x).
27) f(x) = 5x - 3, f(x) = 19.5
A) -4.5
B) 4.5
C) -3.5
D) 3.5
9
27)
A graph of the function f is sketched in the figure below. Use the graph to find the indicated values.
y
5
-5
5
x
-5
28) Find f(2)
A) 0
B) 2
C) 6
D) -1
28)
29) Find x when f(x) = -1
A) 2
B) 0
C) 1
D) -2
29)
Find the x-intercept and y-intercept of the function.
30) f(x) = 3x - 6
A) x-intercept: (6, 0)
y-intercept: (0, -2)
C) x-intercept: (-6, 0)
y-intercept: (0, 2)
30)
B) x-intercept: (-2, 0)
y-intercept: (0, 6)
D) x-intercept: (2, 0)
y-intercept: (0, -6)
31) f(x) = 5x
A) x-intercept: (5, 0)
y-intercept: (0, 5)
C) x-intercept: (0, 5)
y-intercept: (5, 0)
B) x-intercept: (5, 0)
y-intercept: (0, 0)
D) x-intercept: (0, 0)
y-intercept: (0, 0)
32) f(x) = 2
A) x-intercept: none
y-intercept: (0, 2)
C) x-intercept: (2, 0)
y-intercept: (0, 2)
B) x-intercept: (0, 2)
y-intercept: (2, 0)
D) x-intercept: (2, 0)
y-intercept: none
31)
32)
10
SHORT ANSWER. Write the word or phrase that best completes each statement or answers the question.
Solve the problem.
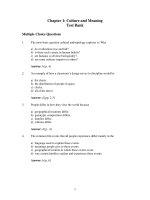
33) Ultraviolet radiation from the sun is thought to be one factor causing skin cancer. The
amount of UV radiation a person receives is a function of the thickness of the earth's
ozone layer which depends on the latitude of the area where the person lives. The
following data represent the latitudes and melanoma rates for nine randomly selected
areas in the United States. The melanoma rates refer to a three-year period.
Degrees North Latitude, x
32.4
33.7
34.4
36.5
38.1
39.9
41.6
43.2
44.0
Melanoma Rate (per 100,000), y
7.2
6.7
6.2
5.5
4.7
4.2
4.1
3.4
3.0
Graph the data on a scattergram treating latitude as the independent variable. Find an
equation of the line containing the points (32.4, 7.2) and (43.2, 3.4). Express the
relationship using the function name f. Graph the line on the scattergram. Interpret the
slope of the line. Use the line to predict the melanoma rate of an area with a latitude of
43.1 degrees north.
9
y
Melanoma Rate (per 100,000)
8
7
6
5
4
3
2
1
30 32 34 36 38 40 42 44 46
x
Latitude (degrees north)
11
33)
MULTIPLE CHOICE. Choose the one alternative that best completes the statement or answers the question.
34) The percentage of Americans owning a car with a cassette tape player during particular years is
given in the following table:
Year Percent
1980
35
1985
31
1990
26
1995
22
2000
18
2005
15
Let t be the number of years since 1980. Find a linear function, P(t), for the line containing the
points (5, 31) and (15, 22).
A) f(t) = -.9t + 39.5
B) f(t) = -.9t + 35.5
C) f(t) = -.8t + 35
D) f(t) = -.8t + 35.5
34)
35)
35)
The percentage of Americans owning a car with a cassette tape player during particular years is
given in the following table:
Year Percent
1980
44
1985
40
1990
35
1995
31
2000
27
2005
24
Let t be the number of years since 1980. Find a linear function, f(t), for the line containing the points
(5, 40) and (15, 31). Find P(7). What does this situation mean?
A) f(7) = 38.2. In 1987, 38.2% of the population owned a car with a cassette player.
B) f(7) = 38.2. In 1987, 61.8% of the population owned a car with a cassette player.
C) f(7) = 40. In 1987, 40% of the population owned a car without a cassette player.
D) f(7) = 40. In 1987, 40% of the population owned a car with a cassette player.
36) The percentage of Americans owning a car with a cassette tape player during particular years is
given in the following table:
Year Percent
1980
48
1985
44
1990
39
1995
34
2000
31
2005
28
Let t be the number of years since 1980. Find a linear function, f(t), for the line containing the points
(5, 44) and (15, 34). Find the t-intercept. What does it mean in this situation?
A) (49, 0) It means that in the year 2029, there will be no cars with cassette players.
B) (49, 0) It means that in the year 2029, there will be 1000 cars with cassette players.
C) (53, 0) It means that in the year 1985, there will be no cars with cassette players.
D) (48, 0) It means that in the year 2028, there will be no cars with cassette players.
12
36)
37) The cost of renting a certain type of car is $33 per day plus $0.12 per mile. Find a linear function
f(x) that expresses the cost of renting a car for one day as a function of the number of miles driven
x.
A) f(x) = 33x + 0.12
B) f(x) = 0.12x + 33
C) f(x) = (x + 0.12) + 33
D) f(x) = 0.12x + 33x
37)
38) The cost of renting a certain type of car is $38 per day plus $0.11 per mile. Find the linear function
f(x) that expresses the cost of renting a car for one day as a function of the number of miles driven,
x. Graph the linear function. Use a domain of 0 ≤ x ≤ 500.
38)
C
100
Cost ($)
80
60
40
20
100
200
300
400
500 x
Distance (miles)
A)
B)
C
100
100
80
80
60
60
Cost ($)
Cost ($)
C
40
20
40
20
100
200
300
400
500 x
100
Distance (miles)
200
300
400
500 x
400
500 x
Distance (miles)
C)
D)
C
100
100
80
80
60
60
Cost ($)
Cost ($)
C
40
20
40
20
100
200
300
400
500 x
100
Distance (miles)
200
300
Distance (miles)
13
39) David recently switched to a long distance phone company which charges a monthly fee of $5.95
plus $0.06 per minute. Find a linear function f(m) that expresses the monthly bill as a function of
minutes used m.
A) f(m) = 6.01m
B) f(m) = 0.06m + 5.95m
C) f(m) = 5.95m + 0.06
D) f(m) = 0.06m + 5.95
39)
40) David recently switched to a long distance phone company which charges a monthly fee of $5.45
plus $0.06 per minute. Find the linear function f(m) that expresses the monthly bill as a function of
minutes used, m. Graph the linear function. Use a domain of 0 ≤ m ≤ 300.
40)
B
30
Bill Amount ($)
25
20
15
10
5
50
100
150
200
250
300 m
Time (minutes)
A)
B)
B
30
25
25
20
Bill Amount ($)
Bill Amount ($)
B
30
15
10
5
20
15
10
5
50
100
150
200
250
300 m
50
Time (minutes)
100
150
200
Time (minutes)
14
250
300 m
C)
D)
B
30
30
25
25
20
20
Bill Amount ($)
Bill Amount ($)
B
15
10
5
15
10
5
50
100
150
200
250
300 m
50
Time (minutes)
100
150
200
250
300 m
Time (minutes)
41) A company has just purchased a new computer for $7000. The company chooses to depreciate the
computer using the straight-line method over 5 years. A linear function that expresses the book
value of the computer as a function of its age x is f(x) = -1400x + 7000. What is the book value of
the computer after 2 years?
A) 8400.00
B) 9800.00
C) 15,400.00
D) 4200.00
SHORT ANSWER. Write the word or phrase that best completes each statement or answers the question.
42) Sprint charges a flat monthly fee of $16.89 to use their services. You also must pay $0.10
per minute of talking on the telephone. Let f(t) represent the monthly phone bill (in dollars)
from talking on the phone for t minutes.
i) Find an equation for f.
ii) What is the slope of f? What does it mean in terms of the situation?
42)
43) A basement is flooded with 230 cubic feet of water. Water can be pumped out of the
basement at a rate of 47 cubic feet of water per hour. Let f(t) represent the number of cubic
feet of water that remains in the basement after t hours of pumping out water.
i) Find an equation for f.
ii) Find t when f(t) = 0. What does your result mean in terms of the situation?
iii) What is the domain and range of the model? Explain.
43)
44) In 2000, the enrollment at a college is 20,700 students. Each year the enrollment decreases
by 300 students. Let f(t) represent the enrollment at t years since 2000.
i) Find an equation for f.
ii) Use f to predict when the enrollment will be 18,000 students.
iii) What is the slope of f? What does it mean in terms of enrollment?
44)
15
41)
45) The gas mileage, m, of a compact car is a linear function of the speed, s, at which the car is
driven, for 40 ≤ s ≤ 90. For example, from the graph we see that the gas mileage for the
compact car is 45 miles per gallon if the car is driven at a speed of 40 mph.
Find the average rate of change in gas mileage between speeds of 40 mph and 60 mph.
Find the average rate of change in gas mileage between speeds of 50 mph and 70 mph.
Find the average rate of change in gas mileage between speeds of 70 mph and 90 mph.
Based on your results, do you think that gas mileage is linearly related to speed? Explain.
16
45)
MULTIPLE CHOICE. Choose the one alternative that best completes the statement or answers the question.
46) The gas mileage, m, of a compact car is a linear function of the speed, s, at which the car is driven,
for 40 ≤ s ≤ 90. For example, from the graph we see that the gas mileage for the compact car is 45
miles per gallon if the car is driven at a speed of 40 mph.
46)
Find and interpret the average rate of change in gas mileage between speeds of 40 mph and 90
mph.
A) -0.75 miles per gallon/mph;
Between speeds of 40 mph and 90 mph, gas mileage decreases at a rate of 0.75 miles per
gallon for each 1 mph increase in speed.
B) -0.5 miles per gallon/mph;
Between speeds of 40 and 90 mph, speed decreases at a rate of 0.5 miles per hour for each 1
mpg increase in gas mileage.
C) -0.5 miles per gallon/mph;
Between speeds of 40 mph and 90 mph, gas mileage decreases at a rate of 0.5 miles per gallon
for each 1 mph increase in speed.
D) 0.5 miles per gallon/mph;
Between speeds of 40 and 90 mph, gas mileage increases at a rate of 0.5 miles per gallon for
each 1 mph increase in speed.
47) When a tow truck is called, the cost of the service is given by the linear function y = 2x + 50, where
y is in dollars and x is the number of miles the car is towed. Find and interpret the slope of the
linear equation.
A) m = 50; The number of miles the car is towed increases at a rate of 50 miles per dollar spent
on the service.
B) m = 50; The cost of the service increases at a rate of $50 per mile the car is towed.
C) m = 2; The cost of the service increases at a rate of $2 per mile the car is towed.
D) m = 2; The number of miles the car is towed increases at a rate of 2 miles per dollar spent on
the service.
17
47)
Find the slope then describe what it means in the given situation.
48) The linear function f(x) = 3.9x + 31 represents the percentage of people, f(x), who graduated from
college x years after 1998.
A) m = -3.9; the percentage of people graduating from college has decreased at a rate of 3.9%
per year after 1998.
B) m = 31; the percentage of people graduating from college has increased at a rate of 31% per
year after 1998.
C) m = 3.9; the percentage of people graduating from college has increased at a rate of 3.9% per
year after 1998.
D) m = 3.9; the percentage of people graduating from college has decreased at a rate of 3.9% per
year after 1998.
49) The linear function f(x) = -5.7x + 35 models the percentage of people, f(x), who eat at fast food
restaurants x years after 1998.
A) m = 5.7; the percentage of people eating at fast food restaurants has increased at a rate of
5.7% per year after 1998.
B) m = -5.7; the percentage of people eating at fast food restaurants has decreased at a rate of
-5.7% per year after 1998.
C) m = -5.7; the percentage of people eating at fast food restaurants has decreased at a rate of
5.7% since 1998.
D) m = 35; the percentage of people eating at fast food restaurants has increased at a rate of
35% per year after 1998.
SHORT ANSWER. Write the word or phrase that best completes each statement or answers the question.
Solve the problem.
50) The following data represents the Olympic winning time in Women's 100 m Freestyle.
year
1972
1976
1980
1984
1988
1992
1996
winning time
58.59
55.65
54.79
55.92
54.93
54.65
54.50
a) Let f(t) represent the winning time in the Women's 100 m Freestyle at t years since
1972. Perform the first three steps of the four-step modeling process to find an equation for
f.
b) Find the slope of f. What does it represent in this situation?
18
50)
48)
49)
MULTIPLE CHOICE. Choose the one alternative that best completes the statement or answers the question.
51) From April through December 2000, the stock price of QRS Company had a roller coaster ride. The
chart below indicates the price of the stock at the beginning of each month during that period. Find
the monthly average rate of change in price between April, month 1, and December, month 9.
Month
Price
April (x = 1) 116
May
109
June
89
July
100
August
94
September
113
October
93
November
86
December
66
A) $6.25 per month
B) $5.56 per month
C) -$6.25 per month
D) -$5.56 per month
51)
52) From April through December 2000, the stock price of QRS Company had a roller coaster ride. The
chart below indicates the price of the stock at the beginning of each month during that period. Find
the monthly average rate of change in price between June and September.
Month
Price
April (x = 1) 114
May
107
June
89
July
99
August
94
September
113
October
92
November
86
December
66
A) -$12.00 per month
B) -$8.00 per month
C) $8.00 per month
D) $12.00 per month
52)
53) The total individual income tax collected by the tax collecting body of a country is a function of the
number of people working, their income, and the tax rates. It has increased each year since 1970.
The table below shows the individual income tax collected (in billions) for the time period between
1970 and 1995. Find the average annual rate of change between 1980 and 1990.
Year Tax Collected (billions)
1970
$101
1975
$160
1980
$290
1985
$400
1990
$540
1995
$684
A) $25 billion per year
B) $34.9 billion per year
C) $38 billion per year
D) $39.4 billion per year
53)
19
54) Along with incomes, people's charitable contributions have steadily increased over the past few
years. The table below shows the average deduction for charitable contributions reported on
individual income tax returns for the period 1993 to 1998. Find the slope of the model between
1995 and 1997.
Year Charitable Contributions
1993
$1980
1994
$2380
1995
$2490
1996
$2760
1997
$3000
1998
$3120
A) 310
B) 510
C) 255
D) 315
54)
55) The price of a certain commodity is a function of supply and demand. The table below shows the
price of the commodity per barrel between 1995 and 2000. Find the average annual rate of change
between 1996 and 1998.
Year Price/barrel
1995
$21
1996
$26
1997
$18
1998
$10
1999
$25
2000
$34
A) -$16.00 per year
B) $8.00 per year
C) $2.00 per year
D) -$8.00 per year
55)
56) The price of a certain commodity is a function of supply and demand. The table below shows the
price of the commodity per barrel between 1995 and 2000. Find the average annual rate of change
between 1998 and 2000.
Year Price/barrel
1995
$21
1996
$25
1997
$18
1998
$12
1999
$24
2000
$36
A) -$12.00 per year
B) $12.00 per year
C) $2.75 per year
D) $24.00 per year
56)
20
57) From April through December 2000, the stock price of QRS Company had a roller coaster ride. The
chart below indicates the price of the stock at the beginning of each month during that period. The
slope of the model between April and December is -$6.25 per month. Interpret this average rate of
change.
Month
Price
April (x = 1) 115
May
107
June
87
July
100
August
96
September
112
October
93
November
85
December
65
A) In each month between April and December, the price of the stock decreased by $6.25.
B) Between April and December, the price of the stock decreased by $6.25 per month.
C) Between April and December, the price of the stock increased by $6.25 per month.
D) In each month between April and December, the price of the stock increased by $6.25.
57)
58) The total individual income tax collected by the tax collecting body of a country is a function of the
number of people working, their income, and the tax rates. It has increased each year since 1970.
The table below shows the individual income tax collected (in billions) for the time period between
1970 and 1995. Between 1980 and 1990, the average rate of change in the amount of tax collected
is $25.9 billion per year. Interpret this average rate of change.
58)
Year Tax Collected (billions)
1970
$98
1975
$161
1980
$285
1985
$402
1990
$544
1995
$681
A) Between 1980 and 1990, the amount of tax collected decreased at a rate of $25.9 billion per
year.
B) Between 1980 and 1990, the amount of tax collected increased by $25.9 billion.
C) In each year between 1980 and 1990, the amount of tax collected increased by $25.9 billion.
D) Between 1980 and 1990, the amount of tax collected increased at a rate of $25.9 billion per
year.
21
59) The total individual income tax collected by the tax collecting body of a country is a function of the
number of people working, their income, and the tax rates. It has increased each year since 1970.
The table below shows the individual income tax collected (in billions) for the time period between
1970 and 1995. Do you think that the amount of income tax collected is linearly related to the year?
Explain your thinking.
[Hint: determine the average rate of change in tax collected for different time periods.]
Year Tax Collected (billions)
1970
$100
1975
$163
1980
$289
1985
$390
1990
$540
1995
$676
A) No, the amount of tax collected is not linearly related to the year. The average rate of change
(slope) is not constant.
B) Yes, the amount of tax collected is linearly related to the year. There is a constant difference
of 5 between each of the years listed.
C) No, the amount of tax collected is not linearly related to the year. The average rate of change
(slope) is increasing throughout the period 1970 to 1995.
D) Yes, the amount of tax collected is linearly related to the year. The average rate of change
(slope) is constant.
22
59)
Answer Key
Testname: UNTITLED2
1) a)
b)
2)
3)
4)
5)
6)
7)
8)
9)
10)
The Program grade should be about 71. Answers may vary slightly.
Interpolation was used to obtain the result.
i) (91, 25)
ii) 1986
iii) -23,420 employees; Model breakdown has occurred.
iv) -2.48; Employment decreases by 2480 people each year.
v) (100.56, 0); No one will be employed in 2001.
vi) (0, 249.38); Employment was 249,380 people in 1900.
i) 2007
ii) 36%
iii) (-24.46, 0); No juveniles were arrested for arson in 1965.
iv) 1.83; The percent of arson arrests that were juveniles increases by 1.83 each year.
v) (0, 44.76); The percent of arson arrests that were juveniles in 1990 was 44.76%.
vi) 63.06; 63% of arson arrests were juveniles in 2000.
vii) 30.19; All arson arrests will be juveniles in 2020.
A
C
A
D
B
C
C
23
Answer Key
Testname: UNTITLED2
11) Decrease the slope and raise the y-intercept. The improved model is sketched in the figure below.
y
x
12)
13)
14)
15)
16)
17)
18)
N = 18.89t - 973.39; Answers may vary.
P = 11.60a - 145.47; Answers may vary.
W = -0.17t + 55.55; Answers may vary.
Student B
A
A
y
200
Weight (lb)
180
160
140
120
100
60 62 64 66 68 70 72 74 76
19)
20)
21)
22)
23)
24)
25)
26)
27)
28)
x
y = 6.875x - 299.25
If height is increased by one inch, then weight will increase by 6.875 pounds
124 lb
A
C
B
B
A
A
C
B
B
A
24
Answer Key
Testname: UNTITLED2
29)
30)
31)
32)
33)
B
D
D
A
9
y
Melanoma Rate (per 100,000)
8
7
6
5
4
3
2
1
30 32 34 36 38 40 42 44 46 x
Latitude (degrees north)
34)
35)
36)
37)
38)
39)
40)
41)
42)
43)
44)
45)
46)
47)
48)
49)
50)
51)
52)
53)
y = -0.35x + 40
f(x) = -0.35x + 40
If latitude is increased by one degree north, then melanoma rate will decrease by 0.35 per 100,000
24.92 per 100,000
B
A
A
B
A
D
B
D
i) f(t) = 0.10t + 16.89
ii) 0.10; The charge per minute is $0.10.
i) f(t) = -47t + 230
ii) 4.89; It takes 4.89 hours to pump out all the water.
iii) domain 0 ≤ x ≤ 4.89; range 0 ≤ x ≤ 230
i) f(t) = -300t + 20,700
ii) 2009
iii) -300; The enrollment decreases by 300 students each year.
-0.5 miles per gallon/mph; -0.5 miles per gallon/mph; -0.5 miles per gallon/mph;
Yes, the average rate of change (slope) is constant.
C
C
C
B
a) f(t) = -0.13x + 57.09 Answers may vary.
b) The slope is about -0.13 which means that the winning time is decreasing by 0.13 of a second each year.
C
C
A
25